Invited seminar - College of Architecture and urban planning, Tongji U.
Clémentine Cottineau
Research Associate at CNRS
UMR 8097 - Centre Maurice Halbwachs
RA from Universtiy College London CASA

Shanghai, CN. Tuesday 16th April 2019
Geographer, Economist
Who am I?
Pumain D., Swerts E., Cottineau C., Vacchiani-Marcuzzo, Ignazzi A., Bretagnolle A., Delisle F., Cura R., Lizzi L., Baffi S., 2015, « Multilevel comparison of large urban systems », Cybergeo, document 706, http://cybergeo.revues.org/26730
Cottineau C., Chapron P., Reuillon R., 2015, “Growing models from the bottom up. An evaluation-based incremental modelling method (EBIMM) applied to the simulation of systems of cities”, JASSS, Vol. 18, No. 4, 9. DOI:10.18564/jasss.2828
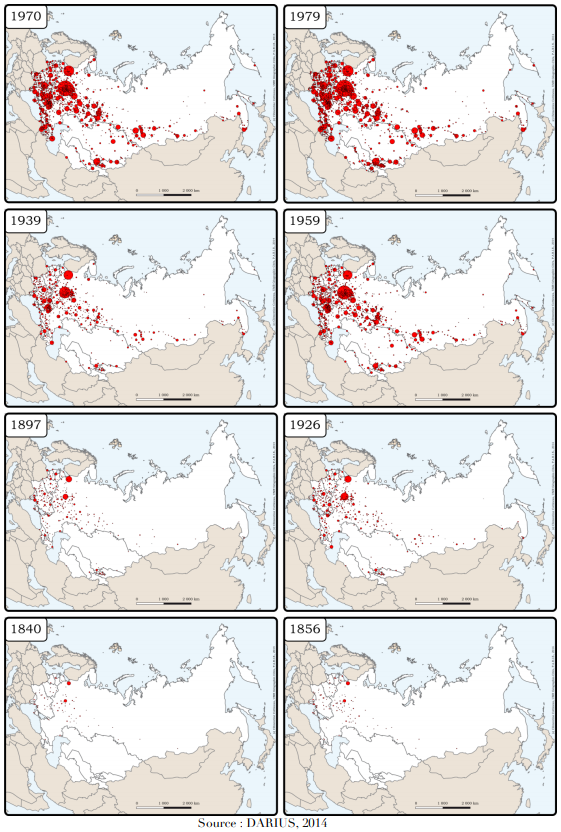
PhD on genericity of urbanisation of the post-Soviet space, 1840-2010
Data collection on 2000 cities over historical censuses
Modelling (ABM, stats) of urbanisation
Cottineau C., Slepukhina I., 2018, “The Russian urban system : evolution under transition”, in D. Pumain, C. Rozenblat & E. Velasquez, International and Transnational Perspectives on Urban Systems, Springer
Cura, R., Cottineau, C., Swerts, E., Antonio Ignazzi, C., Bretagnolle, A., Vacchiani‐Marcuzzo, C., & Pumain, D. (2017). The old and the new: qualifying city systems in the world with classical models and new data. Geographical Analysis, 49(4), 363-386.
Cottineau C., Reuillon R., Chapron P., Rey-Coyrehourcq S., Pumain D., 2015 “A modular modelling framework for hypotheses testing in the simulation of urbanisation”, Systems, 3, pp. 348-377, DOI: 10.3390/systems3040348
Chérel G., Cottineau C., Reuillon R., 2015, « Beyond corroboration: strengthening model validation by looking for unexpected patterns. », PLoS One, Vol. 10, No. 9, e0138212.
Spatial analyst à CASA, University College London
Who am I?
Post-doc on urban scaling laws with E. Arcaute and M. Batty
Generation of city definitions
Sensitivity analysis of power law relationships between city attributes and population
Cottineau, C., & Vanhoof, M. (2019). Mobile phone indicators and their relation to the socioeconomic organisation of cities. ISPRS International Journal of Geo-Information, 8(1), 19.
Finance, O., & Cottineau, C. (2018). Are the absent always wrong? Dealing with zero values in urban scaling. Environment and Planning B: Urban Analytics and City Science, 2399808318785634.
Cottineau, C., Finance, O., Hatna, E., Arcaute, E., & Batty, M. (2018). Defining urban clusters to detect agglomeration economies. Environment and Planning B: Urban Analytics and City Science, 2399808318755146.
Cottineau, C. (2017). MetaZipf. A dynamic meta-analysis of city size distributions. PloS one, 12(8), e0183919.
Cottineau C., Arcaute E., Hatna E., Batty, M., 2017, “Diverse cities or the Systematic Paradox of Urban Scaling Laws”, Computer, Environment and Urban Systems (CEUS), Vol. 59, DOI: 10.1016/j.compenvurbsys.2016.04.006

Agent-based modeler
Who am I?
Projects on urban density and segregation effects on dynamic mechanisms
Various scenarios of spatio-temporal patterns of segregation in Paris region and effect on diffusion of dietary behaviours
Sensitivity analysis of Schelling and Sugarscape results to variation of initial spatial conditions
Raimbault, J., Cottineau, C., Texier, M. L., Néchet, F. L., & Reuillon, R. (2018). Space Matters: extending sensitivity analysis to initial spatial conditions in geosimulation models. arXiv preprint arXiv:1812.06008.
Cottineau, C., Perret, J., Reuillon, R., Rey-Coyrehourcq, S., & Vallée, J. (2018, March). An agent-based model to investigate the effects of social segregation around the clock on social disparities in dietary behaviour. In CIST2018-Représenter les territoires/Representing territories.

My project at CNRS
Investigate the link between economic inequality and spatial segregation
Describe inequality at various geographic scales (global, national, regional, urban, local)
Come up with new measures of inequality to incorporate spatial distribution
Model and simulate inequality including dynamics in time and space
Test public policy scenario and compare effects at different geographical scales
Project at CASA - UCL
https://www.mdpi.com/2220-9964/8/1/19

Research question
Is there a relationship between social and spatial practices sensed by mobile phone data and the socioeconomic structure of cities?
Are they uniformly robust to city definition?
- or are there differences depending on the indicator of mobile phone chosen?
- or some delineations of cities are more illustrative of statistical relations than others?
Data sources
Mobile Phone
Socio
economic
All mobile subscribers to Orange
from 13th May 2007 to 15th October 2007
Continental France
CDR (Call Detailed Records)
- timestamp of call
- call length
- Cell tower ID of caller
- Cell tower ID of called contact
Identification of cell tower of residence
Creation of individual indicators of spatial mobility and social network characterstics
Bandicoot library / Python
Maarten Vanhoof at Orange Labs 2014-2017
Census and administrative data
2008 / 2011
Indicator definition
[Cottineau, Vanhoof, 2019]
Poverty
Inequality
Segregation


European Deprivation Index (EDI) defined by Pornet et al. (2012) from survey on subjective and objective poverty
Gini index from aggregated distribution of earnings (#jobs by earning category, CLAP 2008)
Ordinal segregation index (Reardon, 2009) from aggregated distribution of earnings (#jobs by earning category, CLAP 2008)
[Cottineau et al., 2018]
Mobile Phone
Socio
economic
Spatial distribution of indicators

[Cottineau, Vanhoof, 2019]


Mobile Phone
Socio
economic
Poverty
Inequality
Segregation
Spatial harmonisation of data
- From individuals to cell towers
- From cell towers to municipalities
- From municipalities to cities


Which definition of cities?
- municipalities?
- morphological agglomerations?
- metro areas?

Spatial harmonisation of data
Which definition(s) of cities?
Variation of density D
Variation of commuting flow F
Variation of population P
> 1 aggregation per combination
Credits: Y. Jiang, T. Russell, C. Cottineau, E. Arcaute

Cottineau, Hatna, Arcaute, Batty, 2017, Computer Environment and Urban Systems
Systematic
Delineation
of cities
39 values of D
x 21 values of F
x 6 values of P
= 4914 representations of the system of cities
From definitions of cities to sensitivity analysis of relations

39 values of D
x 21 values of F
x 6 values of P
= 4914 representations of the system of cities
x N (var mobile)
x M (Var census)
> millions regressions

From 4914 cases
to 6 cluster medoids
p = 10 000 residents
k-medoids method
Which definition(s) of cities?
How do mobile phone indicators vary with measures of socioeconomic organisation of cities?
Do these relations vary when the definition of cities change?
Results

The different definitions
Negative Correlation
Positive Correlation
The different indicators
Results
Where cities are poorer on average,
their residents have been less active, their calls shorter,
their mobility shorter and less diversified
Results
Where cities are poorer on average,
their residents have called more calls from home,
the intensity of their interactions with contacts was stronger
Results
The correlation with the total number of calls and
the share of nocturnal calls depends on city definition
Results

Where cities are more unequal on average,
their residents have been in more calls, have been more mobile and diversified in terms of social and spatial networks
Results
Temporal indicators do not correlate much
with city levels of inequality
Results

Spatial segregation by earnings in cities is associated with less calls and shorter ones, less contacts and less active days.
Results
But most correlations can go both directions
depending on the city delineation chosen.
Results

Results
Results
Restrictive definitions of dense city cores
Results

Results
Loose definitions of commuting periphery
< 40% (INSEE)
When segregation increases,
diversity of contacts called decreases
Results
Restrictive definitions of dense city core
> 15 inhab./ha
When segregation increases,
diversity of contacts called increases
or
no correlation
Results
Aires
urbaines
(metro areas)
Results
When segregation increases,
diversity of contacts called decreases
(for large cities)
or
no correlation
(p < 30,000)

Results
Poverty and segregation levels and (to a lesser extent) inequality account for a significant share of variations in size and diversity of the social network called and the spatial network of cell towers
Poverty correlates with a decrease in size and diversity of networks, regardless of city definition
Poverty and segregation levels and (to a lesser extent) inequality account for a significant share of variations in size and diversity of the social network called and the spatial network of cell towers
Results
It correlates with an intensification of interaction per contact and an increase in calls from home
Results
Poverty and segregation levels and (to a lesser extent) inequality account for a significant share of variations in size and diversity of the social network called and the spatial network of cell towers
Poverty correlates with a decrease in size and diversity of networks, regardless of city definition
Results
Poverty and segregation levels and (to a lesser extent) inequality account for a significant share of variations in size and diversity of the social network called and the spatial network of cell towers
Segregation correlates with a decrease in size and diversity of social networks. For spatial networks, statistical relations depends heavily on city definition
Results
Poverty and segregation levels and (to a lesser extent) inequality account for a significant share of variations in size and diversity of the social network called and the spatial network of cell towers
Inequality correlates with a increase in diversity and intensity of networks, regardless of city definition
Results
Poverty and segregation levels and (to a lesser extent) inequality account for a significant share of variations in size and diversity of the social network called and the spatial network of cell towers
This is even more true for definitions close to metropolitan areas (dense city core and integrated commuting periphery)
Results
Poverty and segregation levels and (to a lesser extent) inequality account for a significant share of variations in size and diversity of the social network called and the spatial network of cell towers
This is less true for definitions of compact cities (very dense city core and no commuting periphery)
Results
Some mobile phone indicators vary independently from the socio-economic structure of cities (length of calls, share of nocturnal calls)
Conclusions
Economic inequalities are sensitive to geographical space
Economic inequalities are sensitive to city size and morphology
The link between income, inequality and segregation is to be explored further, at the level of cities and citizens
Thank you.
谢谢.
clementine.cottineau@ens.fr
@clementinecttn
Campus ENS/PSE Jourdan
48 boulevard Jourdan
75014 Paris, France
Tongji University
16 April 2019
Shanghai, China
Seminar Tongji Uni Shanghai - April 2019
By Clémentine Cottineau


