Geographical Information Systems and Science:
Case studies, energy and buildings research
Ed Sharp:
ed.sharp@ucl.ac.uk | www.esenergyvis.wordpress.com | @steadier_eddy
What is GIS?
What is GIS?
Geographical Information Systems
-
Desktop
-
ArcGIS
- Comprehensive & Intuitive,
- Industry standard
- ArcPy
- Expensive
-
Opensource
- QGIS
- Grass
- Free
- Less comprehensive & Intuitive
-
Command line
- Python – Basemap etc
- R – gg plot
-
ArcGIS
-
Bespoke
- Possible to write many processes into e.g python
- Web – e.g. Google
- Remote sensing
- Databases
- CAD?
What is GIS?
Geographical Information Science
-
Processes surrounding the systems
- Algorithms
- Software design
- Application or processes
- Data storage
- Standards
- Covered in many UG courses and Masters
- Research/Development
-
Incorporates
- Geography
- Maths
- Physics
- Computer Science
- Cartography
Users
- The definitions above depend on the person/ user
- Students
- Professionals ……
- Developers
- Scientists/academics
- Where am I?
What is GIS?
Case Studies
MSc GIS: 3D buildings from LiDAR data
MSc GIS: Sea Surface Temperatures
MRes: Fuel Poverty
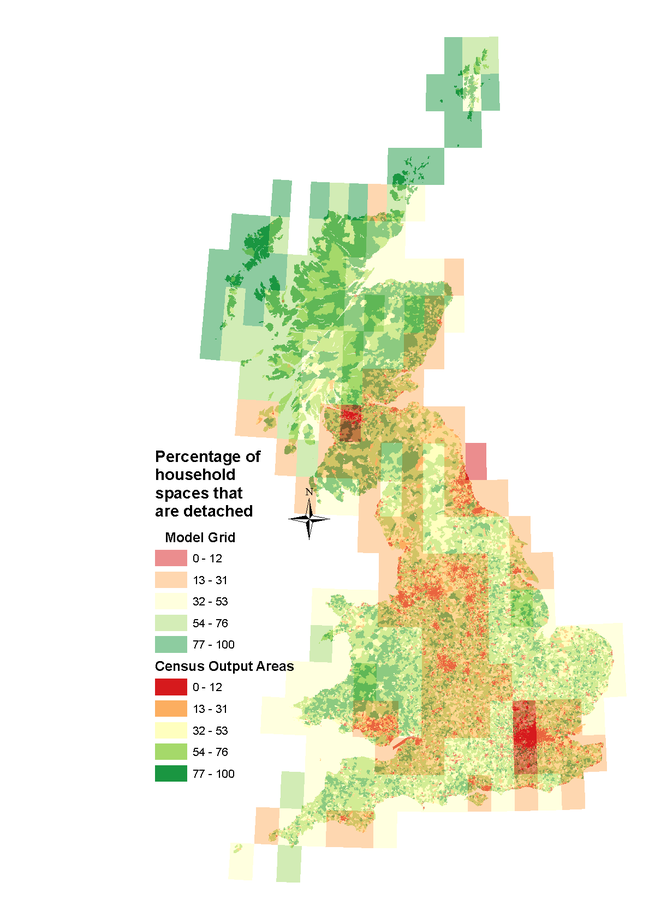
PhD: Gridded modelling of wind generation
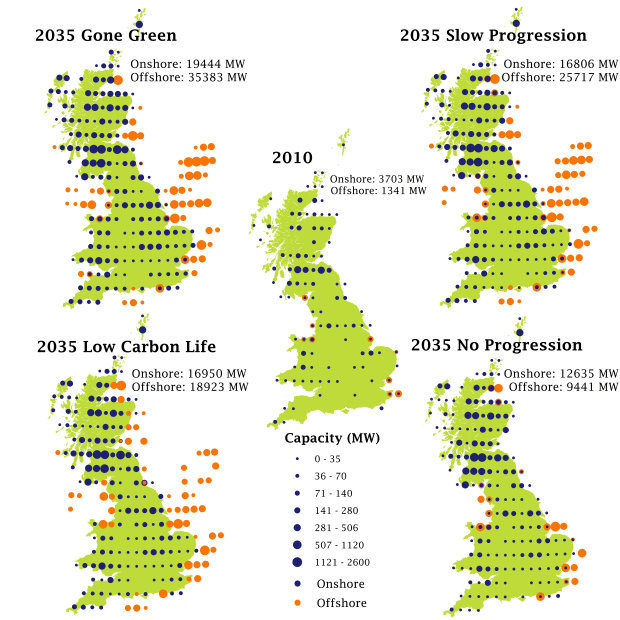

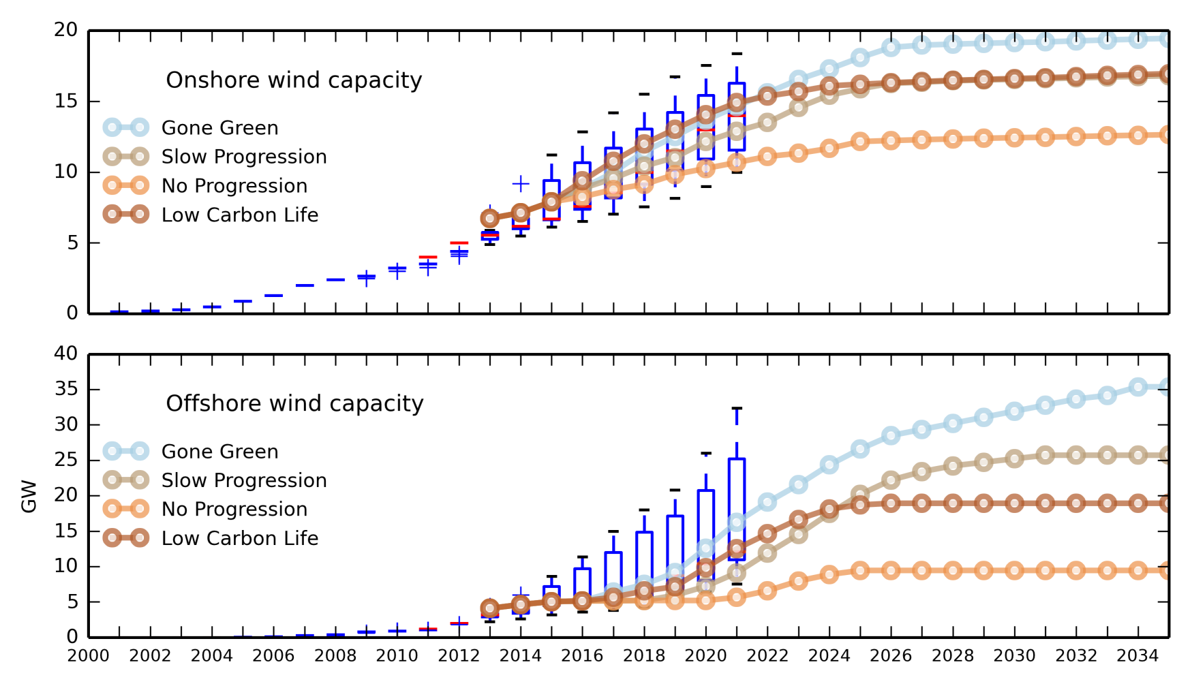
PhD: Gridded modelling of wind generation
PhD: Gridded modelling of wind generation
PhD: Gridded modelling of wind generation
PhD: Hourly variability in wind generation, electricity demand and residual demand

Increased variability in both scenarios, higher capacity factors throughout the later in years under Gone Green on the left, especially in the colder months.
Predictable variability under both scenarios for all years. Little evidence of the impact of heat pumps on the temporal patterns of electricity demand.
The Gone Green scenario experiences greater variability as a result of more wind capacity, particularly offshore.
Wind Generation
Electricity Demand
Residual Demand


PhD: Hourly variability in residual demand
PhD: Spatial analysis
Correlation between generating grid squares for each scenario, 2010 - 2035.
See Sinden (2007) for original method


Blog: Animated maps of renewable energy capacity
Blog: Animated maps of renewable energy capacity
Blog: Animated maps of renewable energy modelling
Blog/UCL: Economy seven meters in GB, cartograms
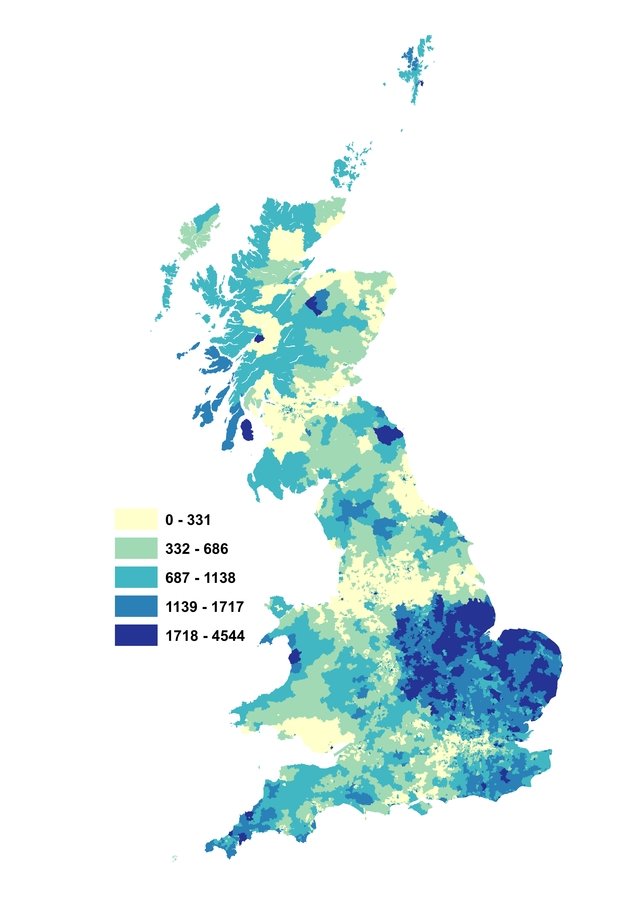

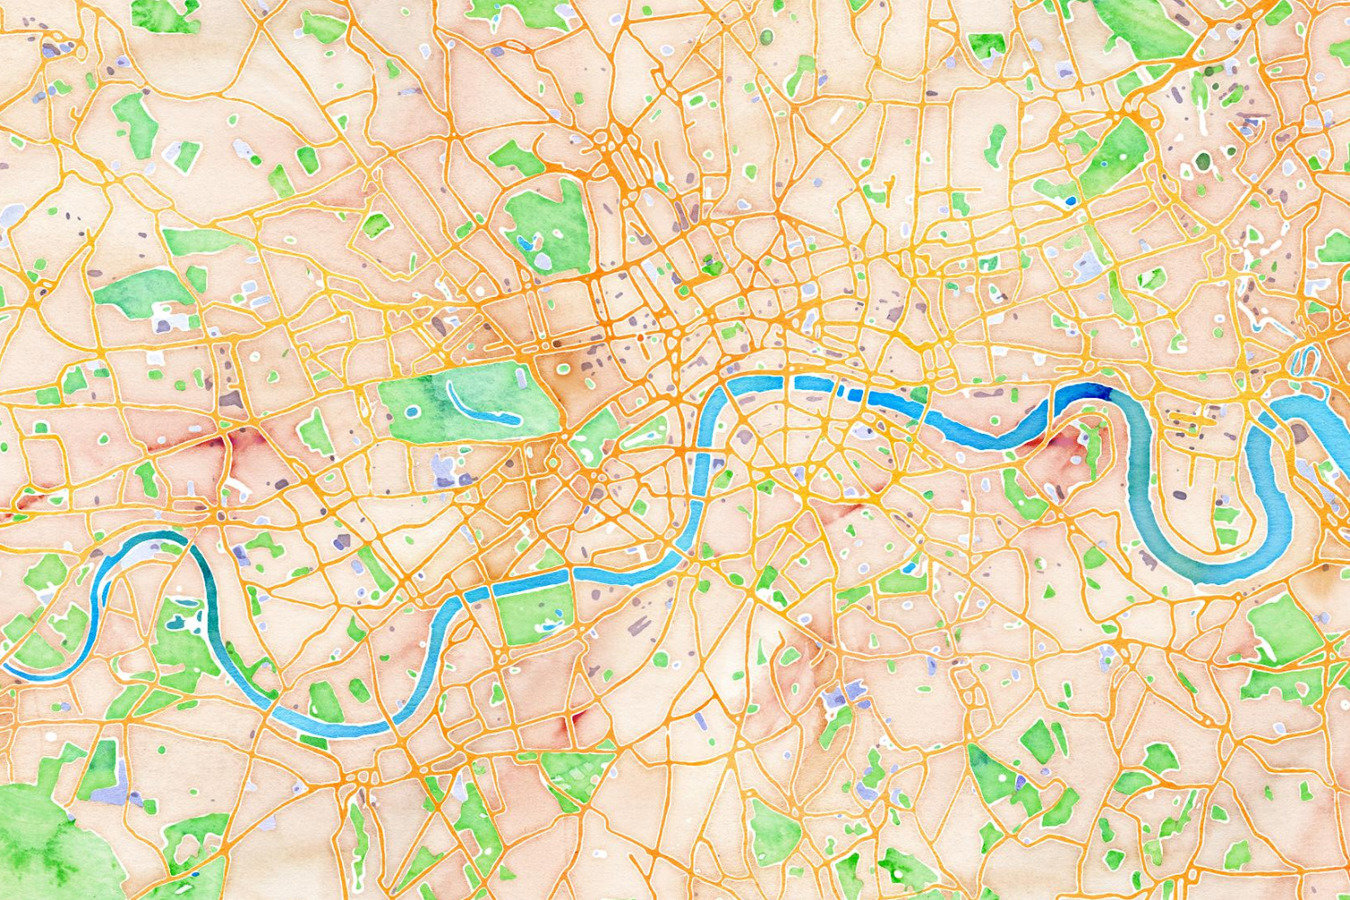
Mapping: good options exist
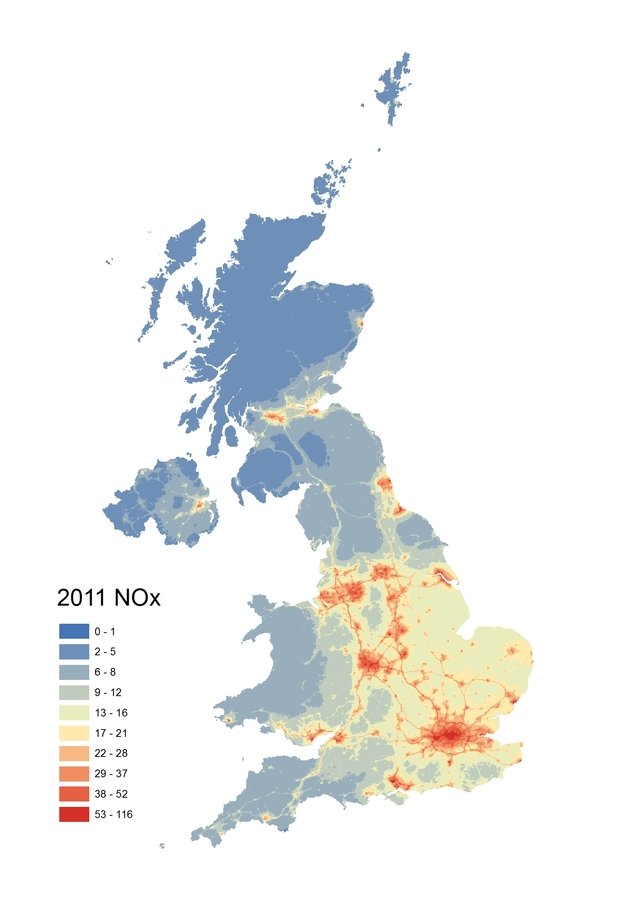
Blog/UCl: Animated maps of NOx concentration


GIS and intro with energy and buildings case studies
By Ed Sharp
GIS and intro with energy and buildings case studies
A general introduction to what a GIS is and what it can do. Case studies focus on energy buildings research and consultancy
- 576


