Modern problems in Biomedical Imaging
2026 TTREC Faculty Retreat



Jeremias Sulam
50 years ago ...
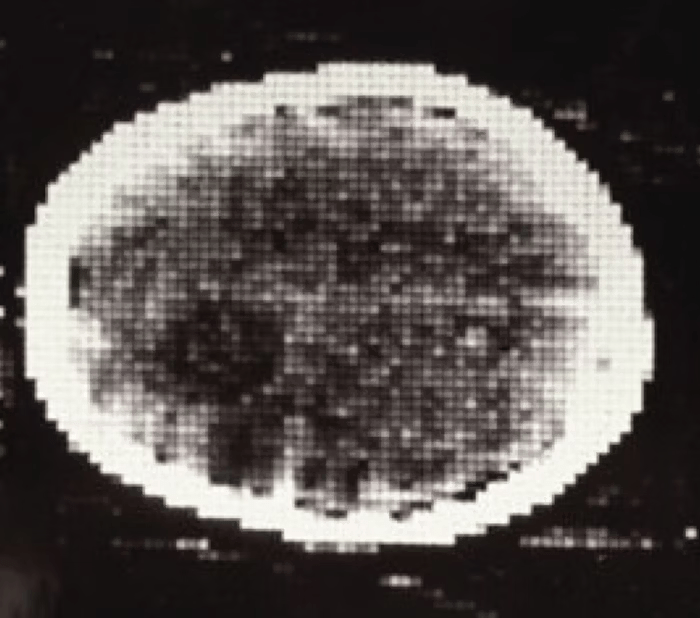
first CT scan


ELECTRIC & MUSICAL INDUSTRIES
50 years ago ...
imaging
diagnostics
complete hardware & software description
human expert diagnosis and recommendations
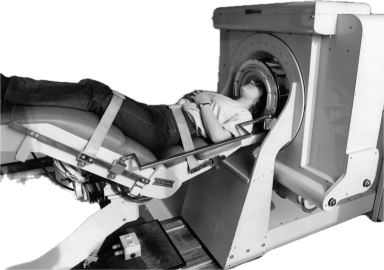
imaging was "simple"
... 50 years forward

Data

Compute & Hardware



Sensors & Connectivity







Research & Engineering
... 50 years forward
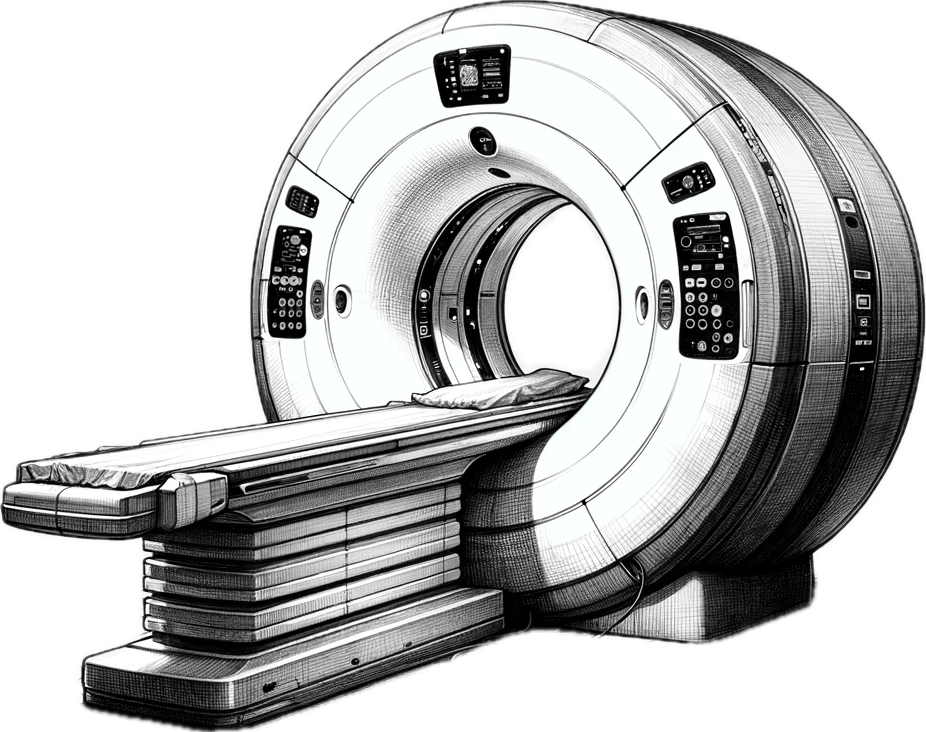
data-driven imaging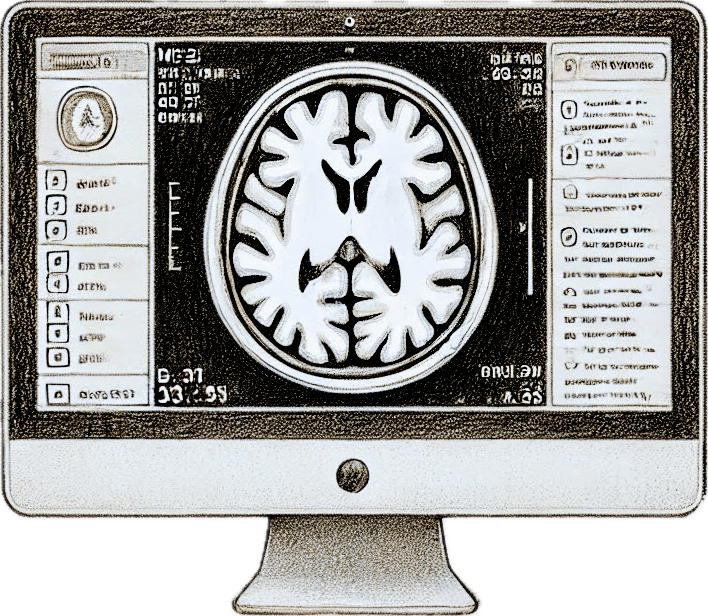
automatic analysis and rec.
societal implicationsData
Compute & Hardware
Sensors & Connectivity
Research & Engineering
data-driven imagingautomatic analysis and rec.societal implicationsProblems in trustworthy biomedical imaging
inverse problems
uncertainty quantification
robustness
biomarker discovery
demographic fairness
hardware & protocol optimization
model-agnostic interpretability
policy & regulation
monitoring & auditing
data-driven imagingautomatic analysis and rec.societal implicationsProblems in trustworthy biomedical imaging
inverse problems
uncertainty quantification
robustness
demographic fairness
hardware & protocol optimization
model-agnostic interpretability
policy & regulation
monitoring & auditing
biomarker discovery
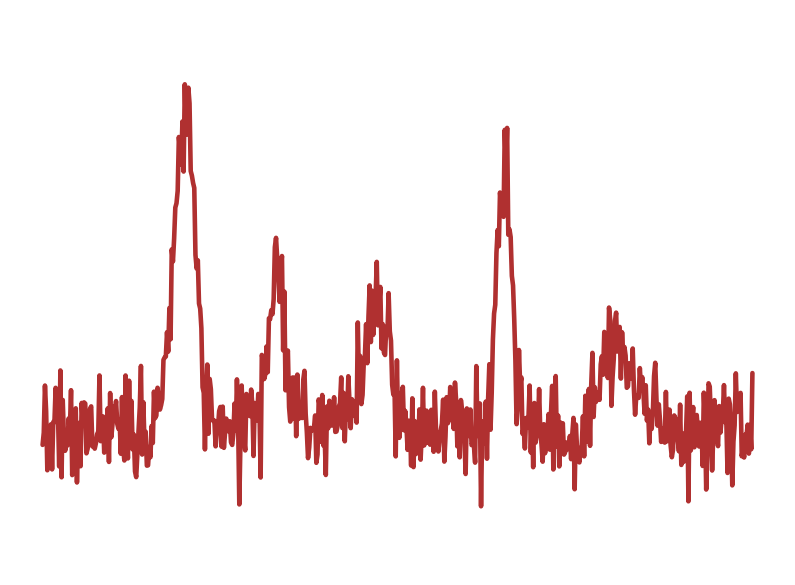
=
+

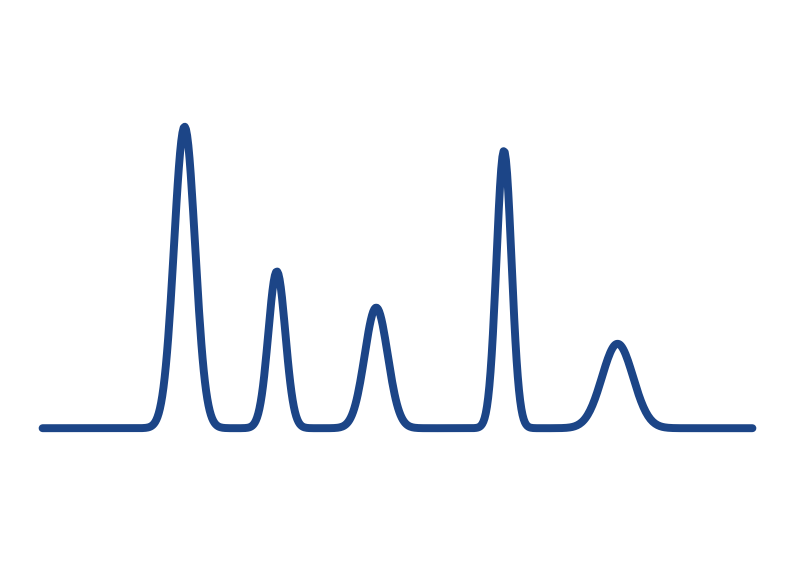
\(x\sim p_x\)
\(z\sim \mathcal N(0,\sigma^2 I)\)
\(y = x + z\)
=

\(x\sim p_x\)
+
\(z\sim \mathcal N(0,\sigma^2 I)\)
\(A~\cdot\)
\(y = Ax + z\)
estimate
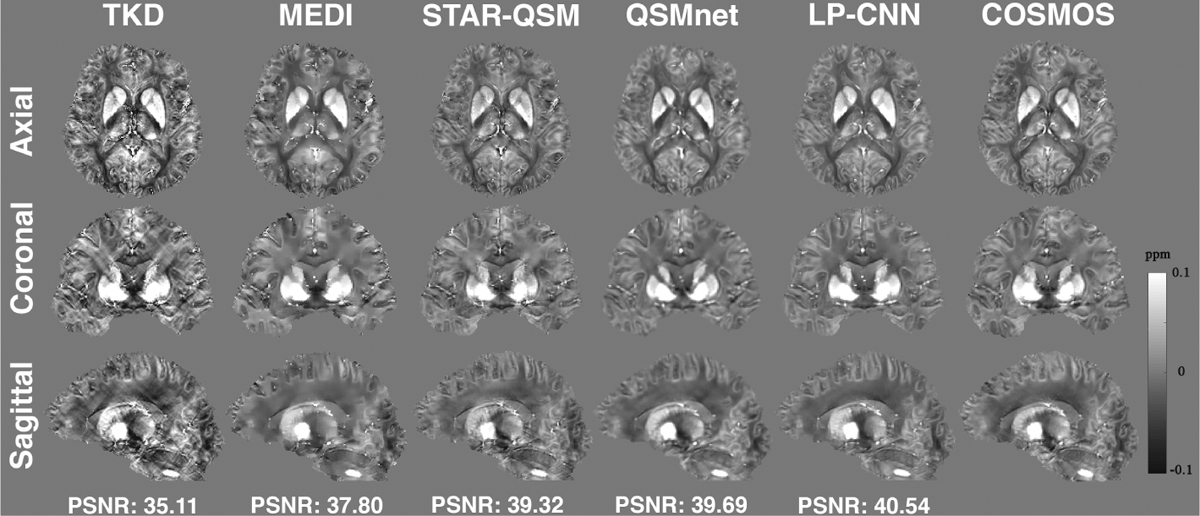
Inverse Problems
How can we use modern data-driven methods while characterizing and exploiting what they have learned?
Example 1: learning a prior for MR Spectroscopy
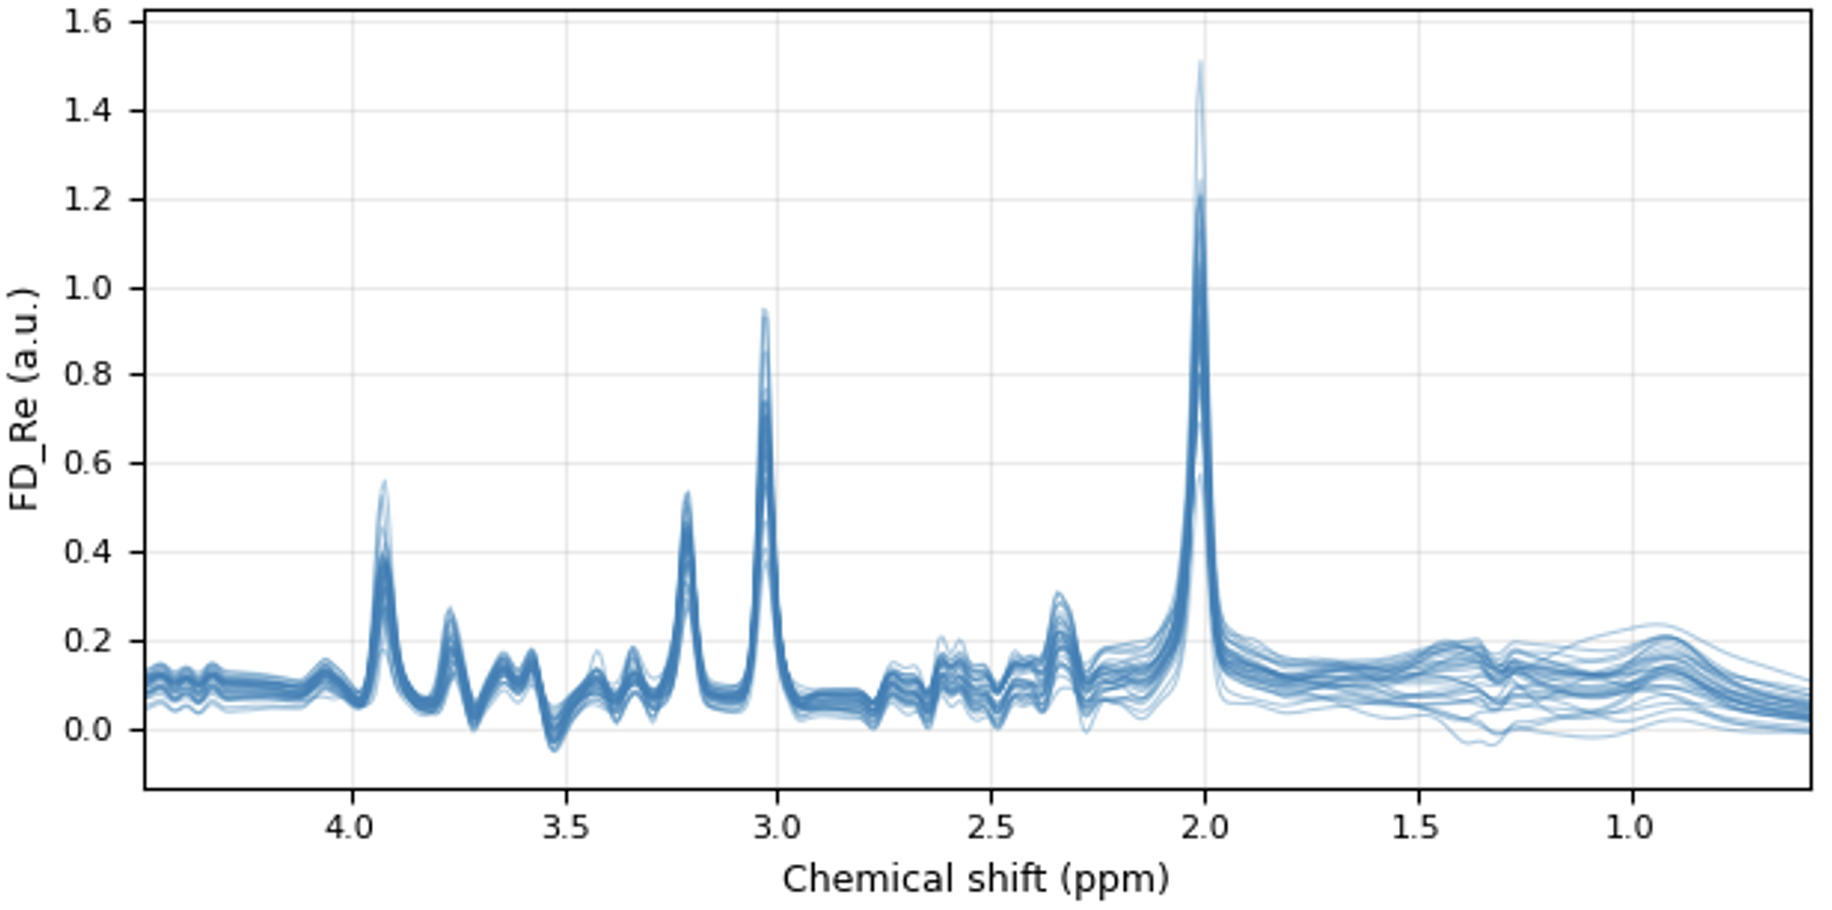
Inverse Problems
Example 1: learning a prior for MR Spectroscopy
baseline
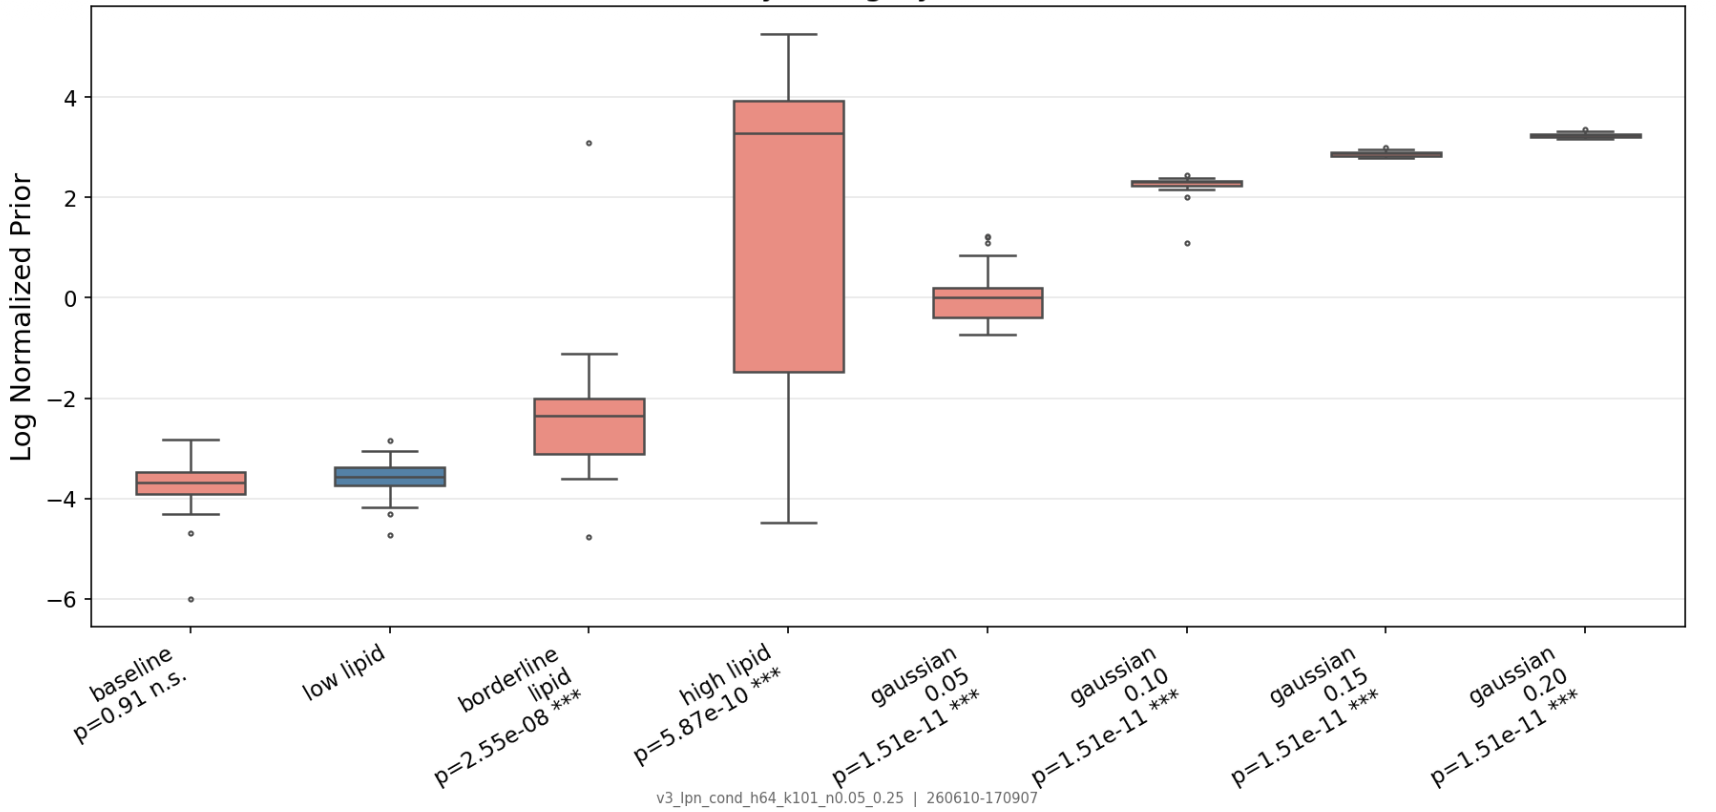
Inverse Problems
Example 1: learning a prior for MR Spectroscopy
baseline
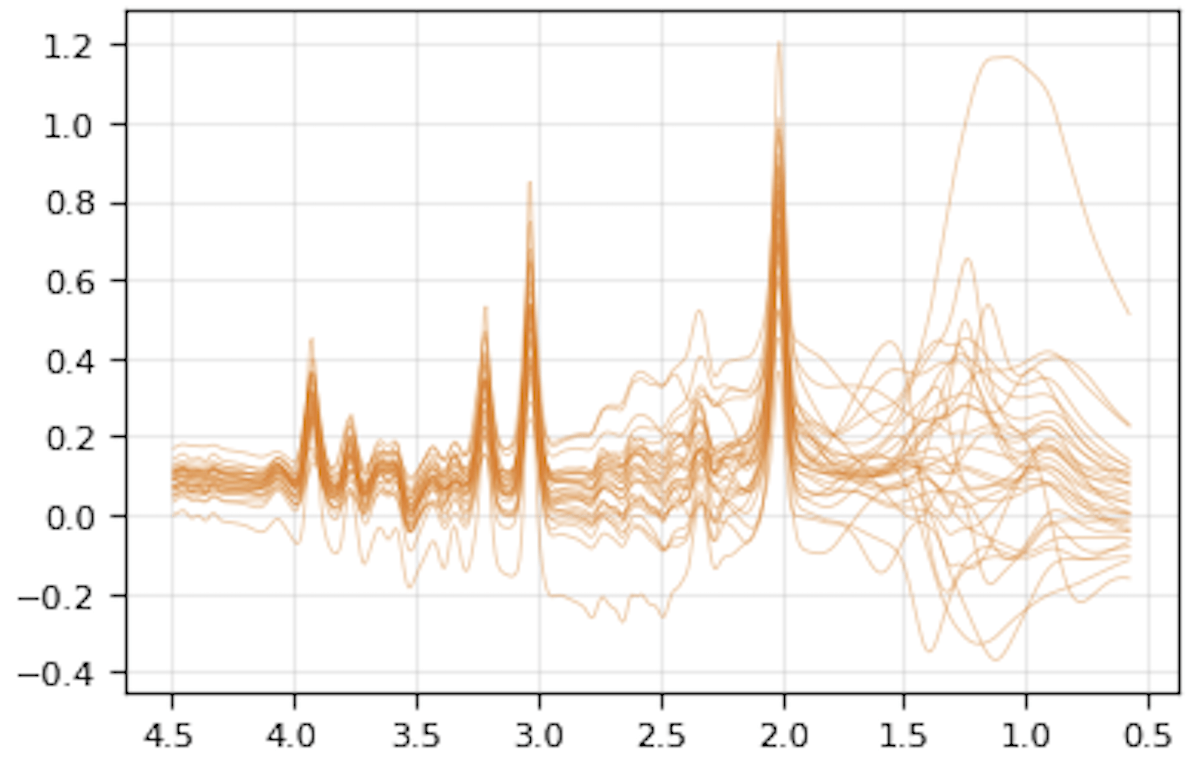
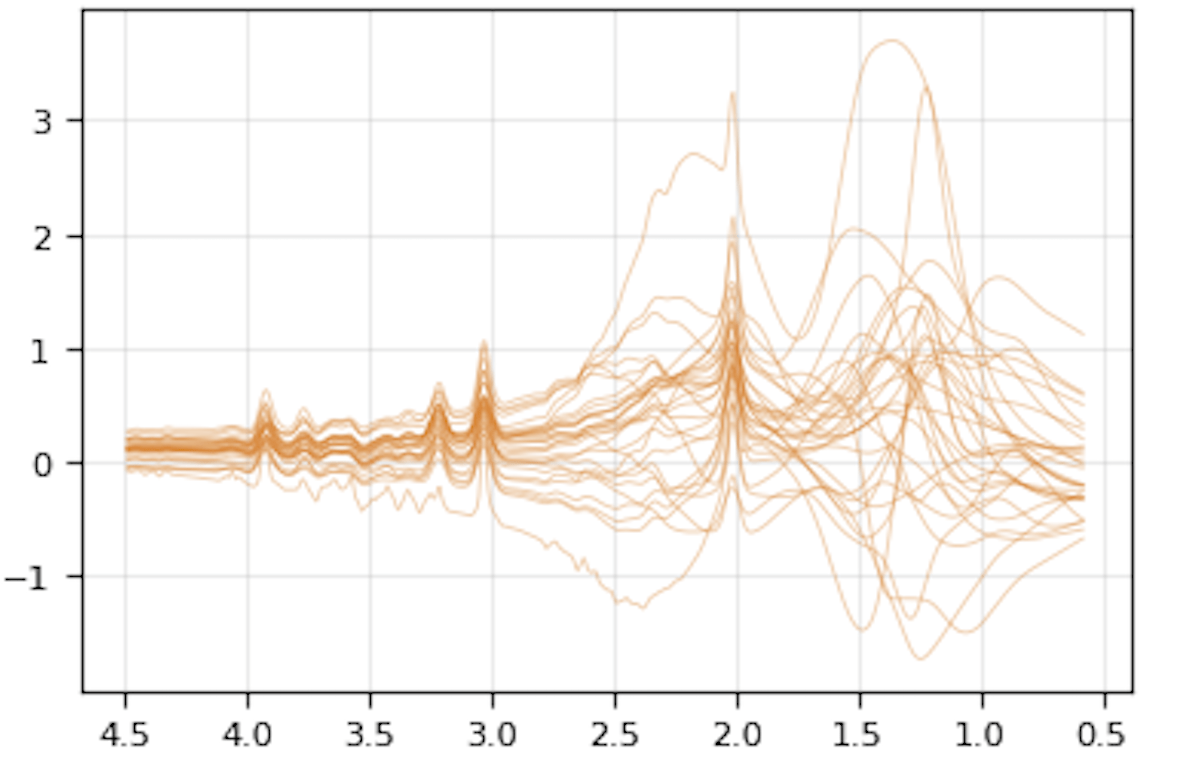
Inverse Problems
Example 1: learning a prior for MR Spectroscopy
baseline
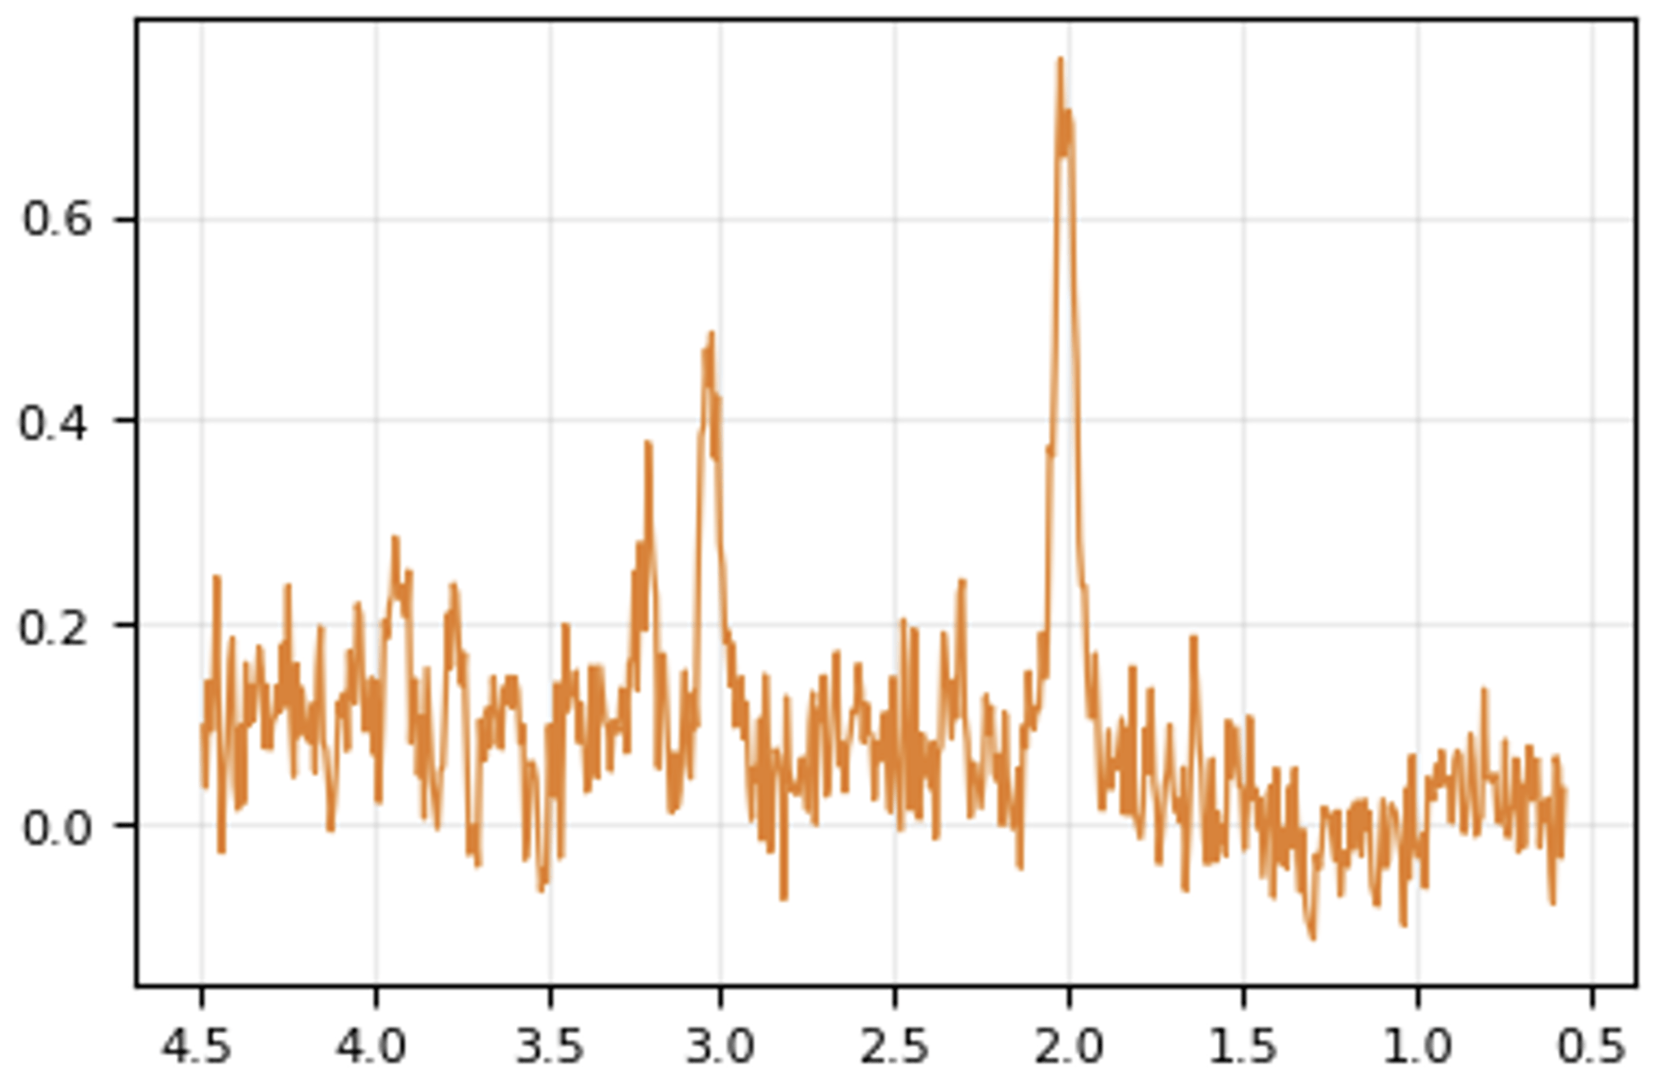
Inverse Problems
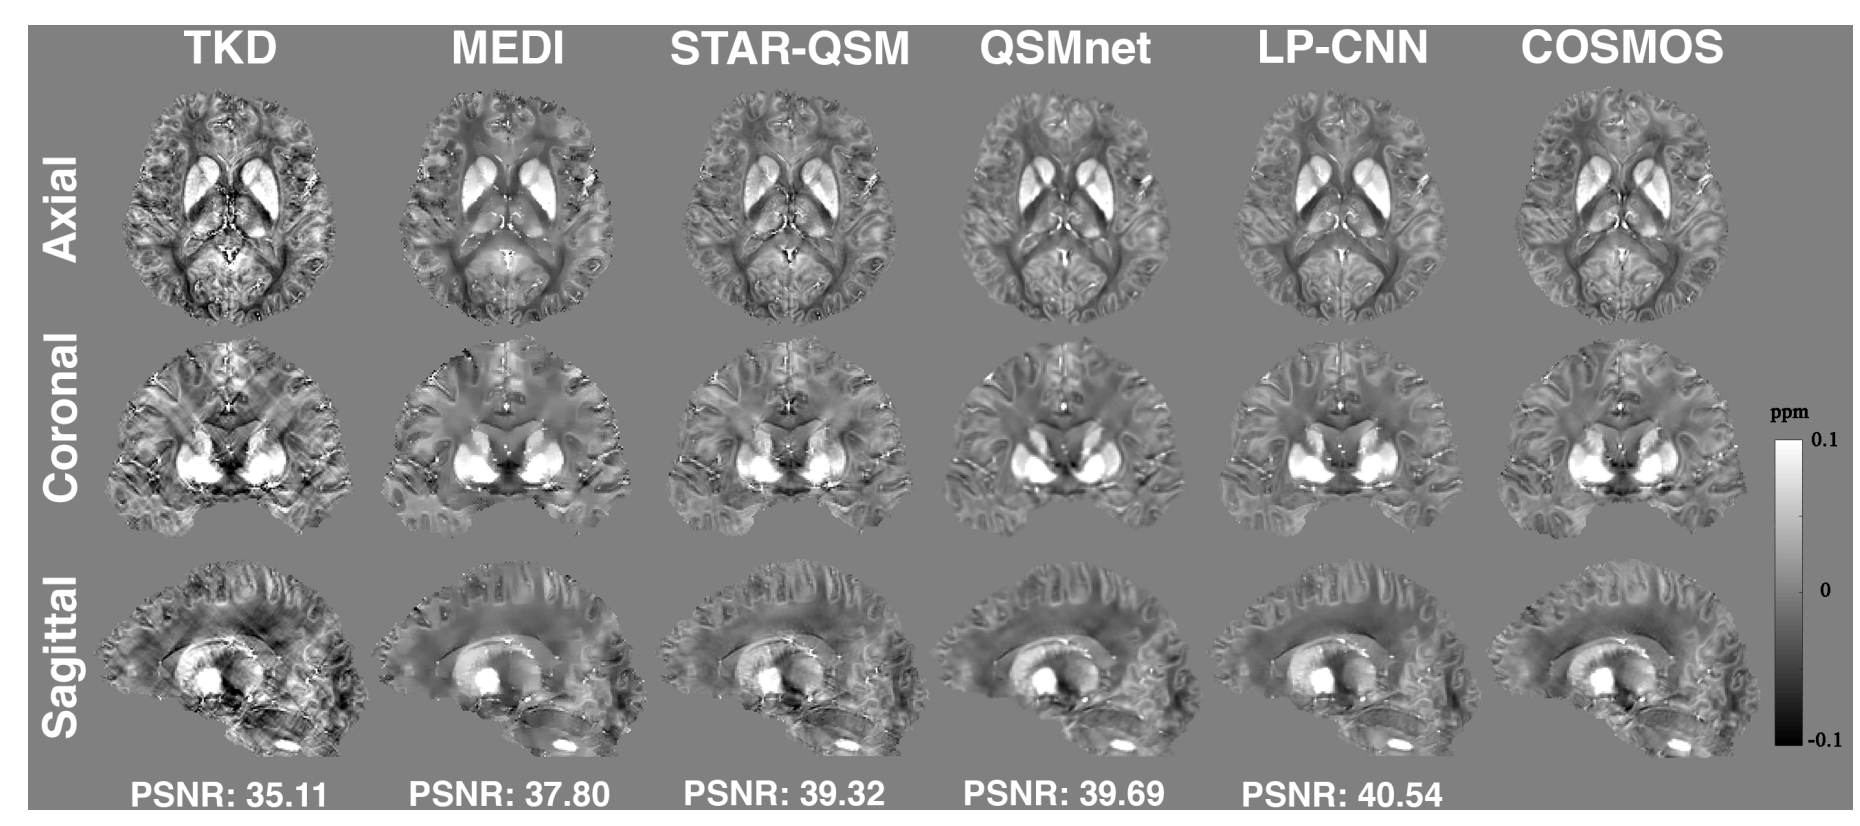
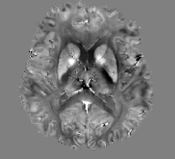
Quantitative Susceptibility Mapping
[Lai, Kuo-Wei, et al. "Learned proximal networks for quantitative susceptibility mapping." International Conference on Medical Image Computing and Computer-Assisted Intervention. Cham: Springer International Publishing, 2020.]
[Fang, Zhenghan, et al. "DeepSTI: Towards tensor reconstruction using fewer orientations in susceptibility tensor imaging." Medical image analysis 87 (2023): 102829.]
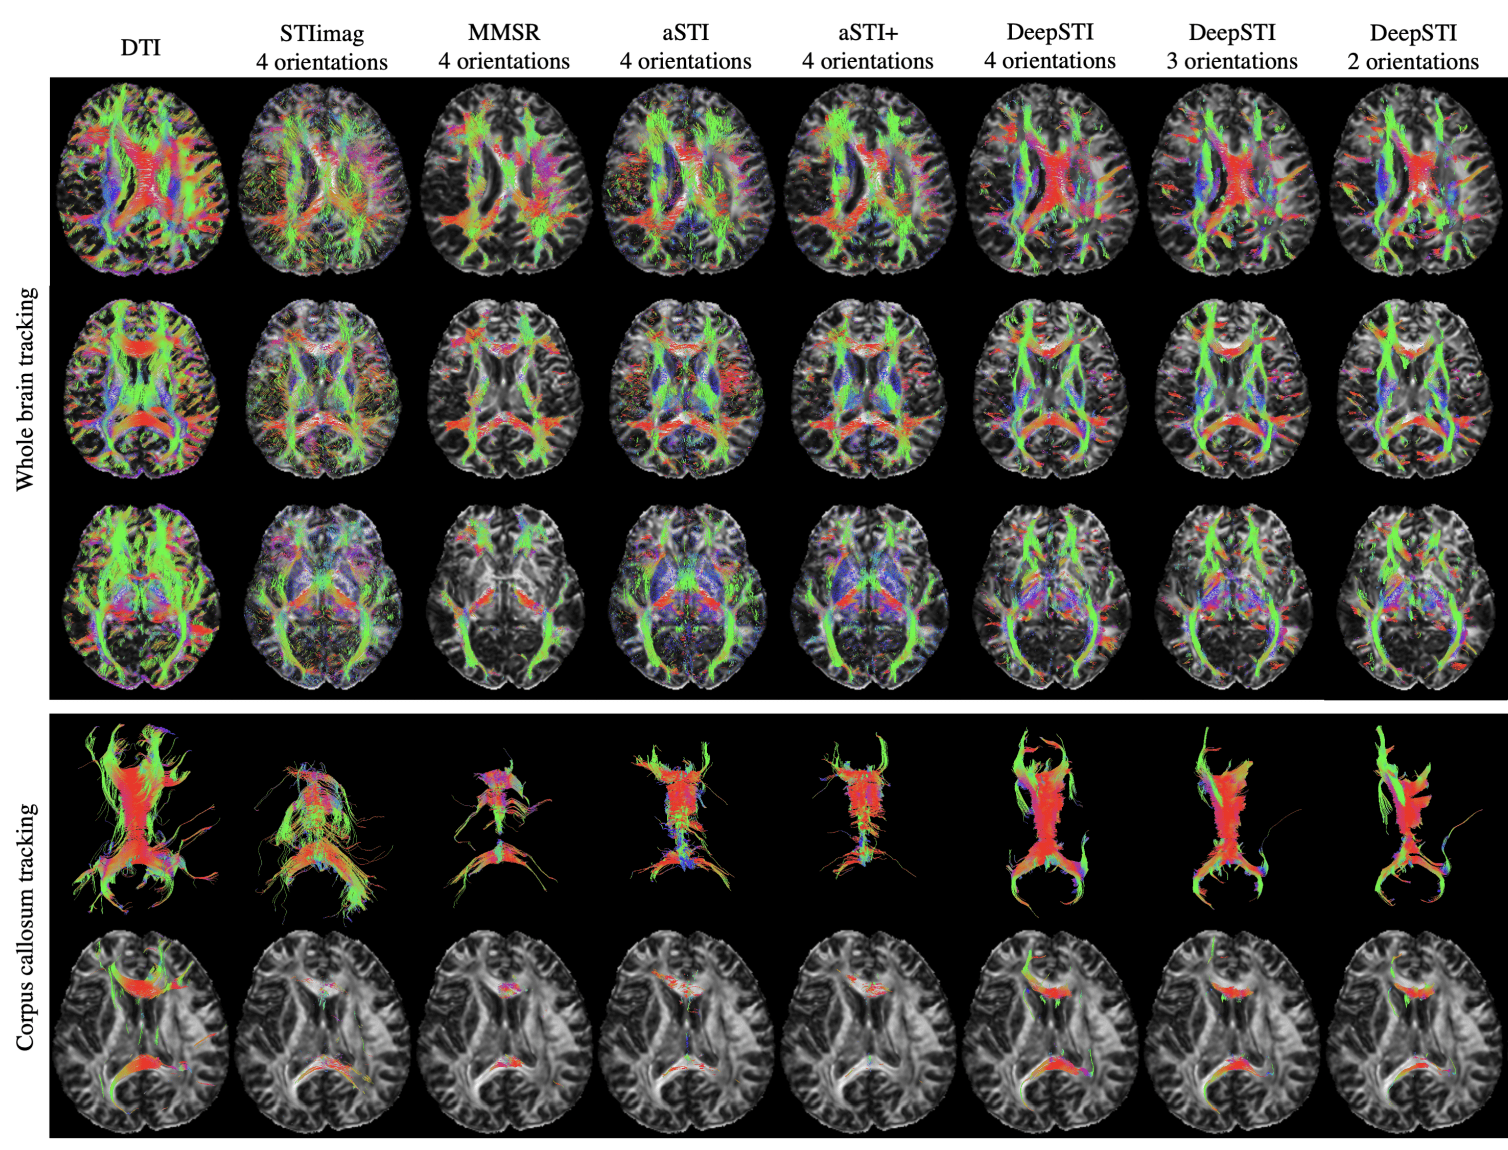
Susceptibility Tensor Imaging
data-driven imagingautomatic analysis and rec.societal implicationsProblems in trustworthy biomedical imaging
inverse problems
uncertainty quantification
robustness
biomarker discovery
demographic fairness
hardware & protocol optimization
model-agnostic interpretability
policy & regulation
monitoring & auditing
[Marilyn Bui]Cancer biology/pathology
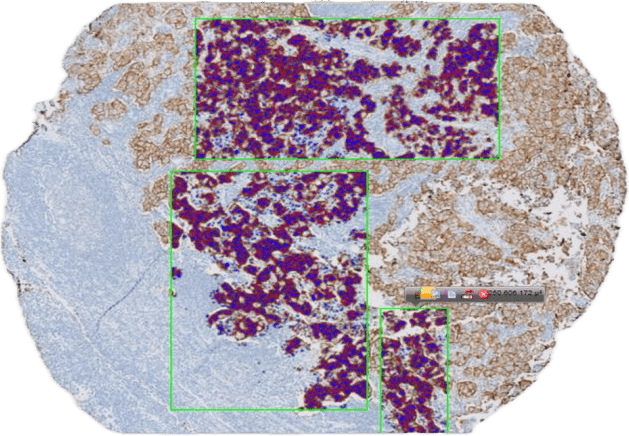
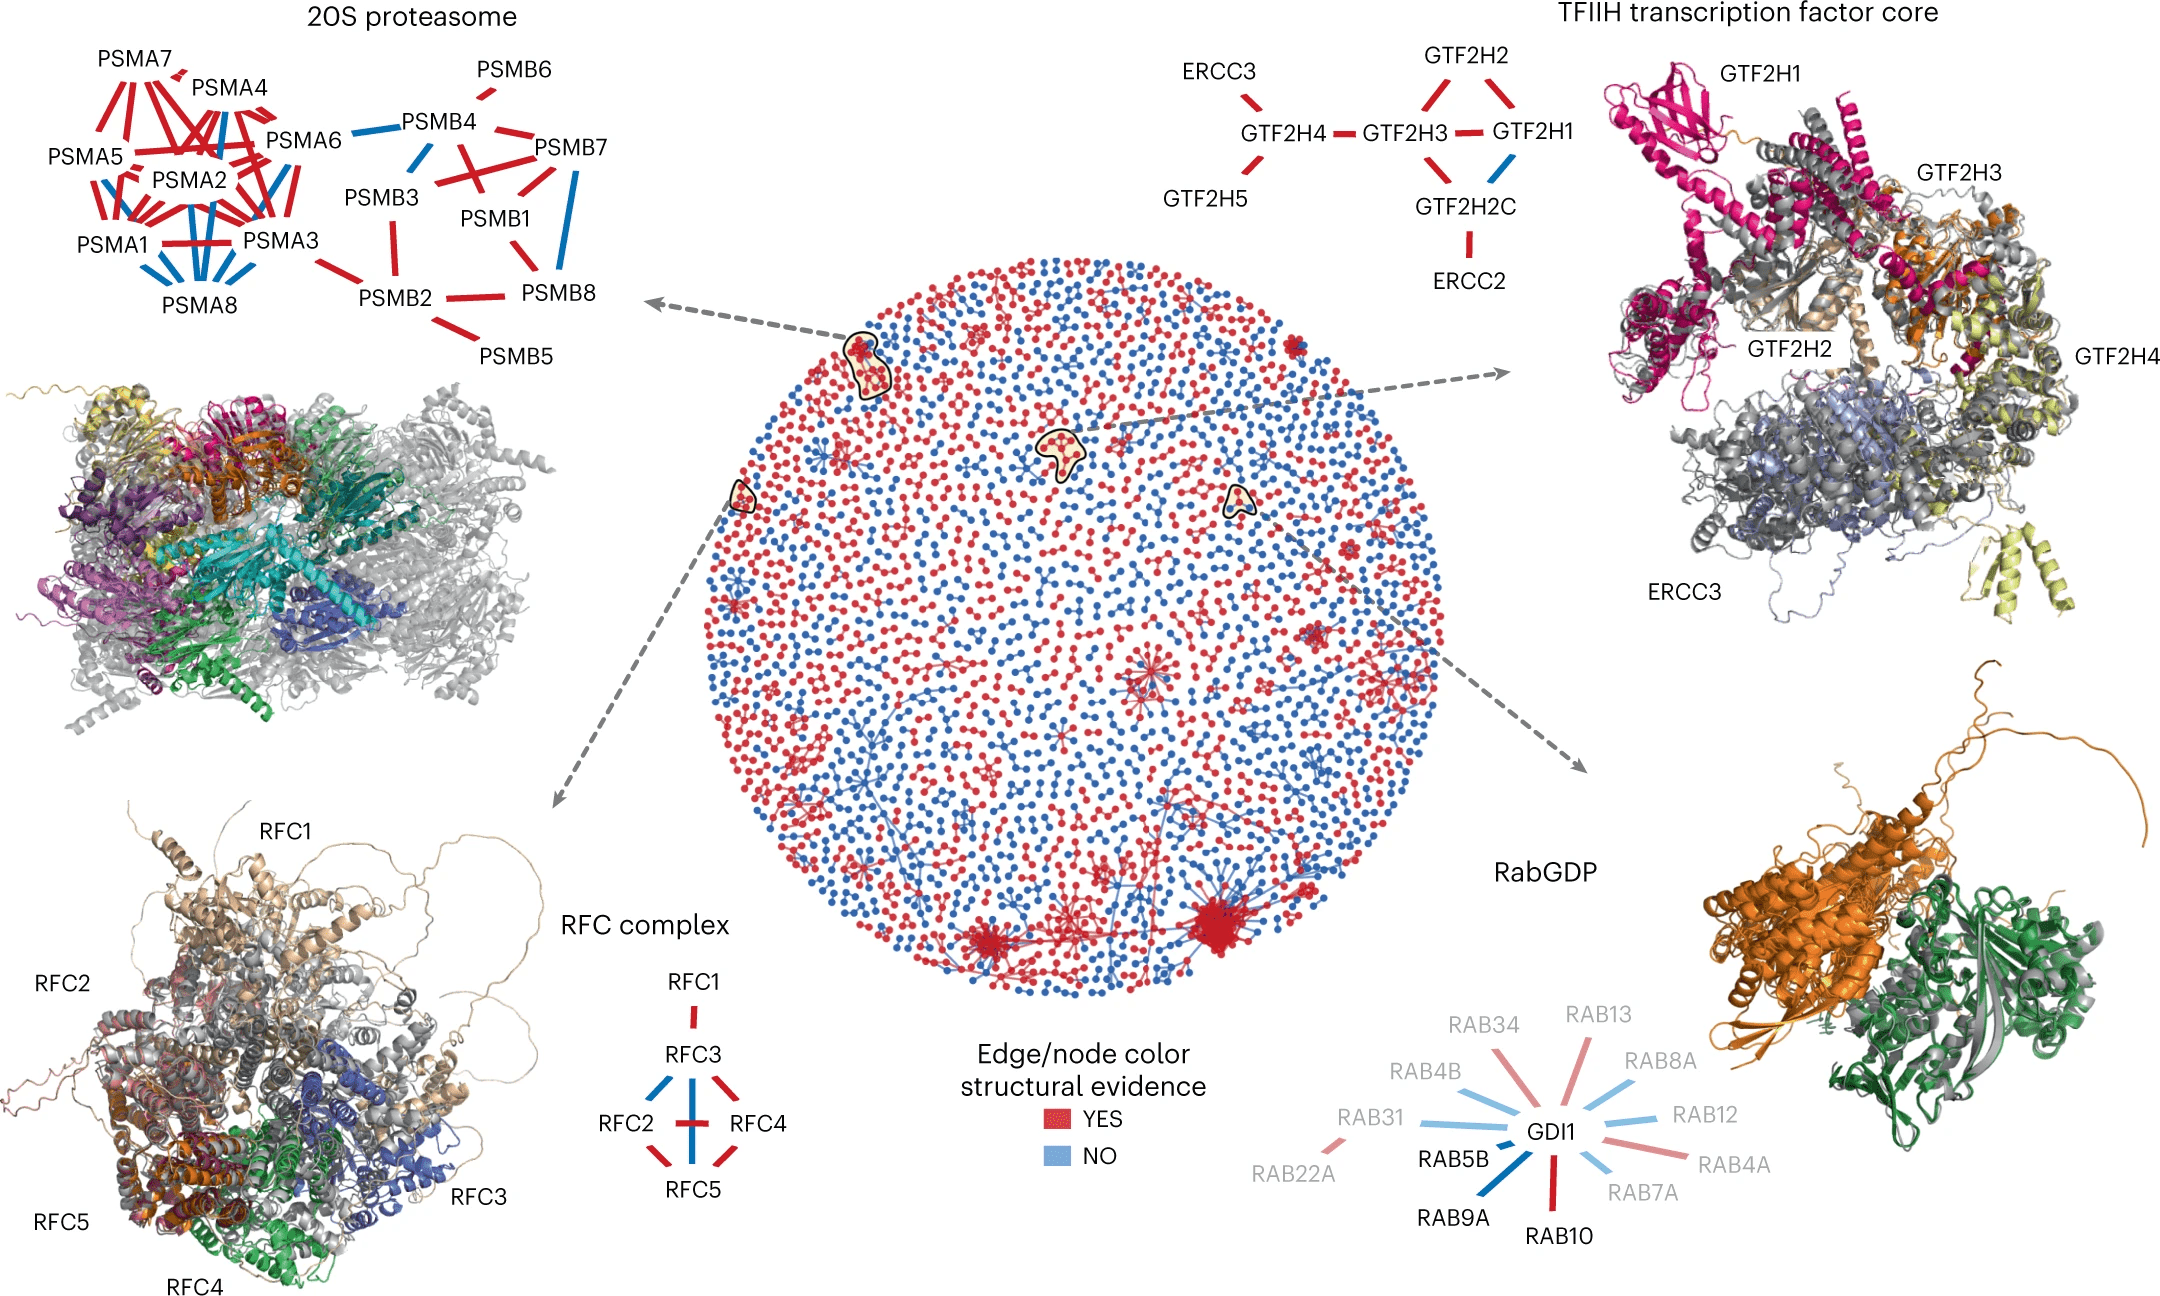
[Burke et al]
Protein-Protein interactions
[Herbst-Kralovetz Lab]
Host/microbe interactions
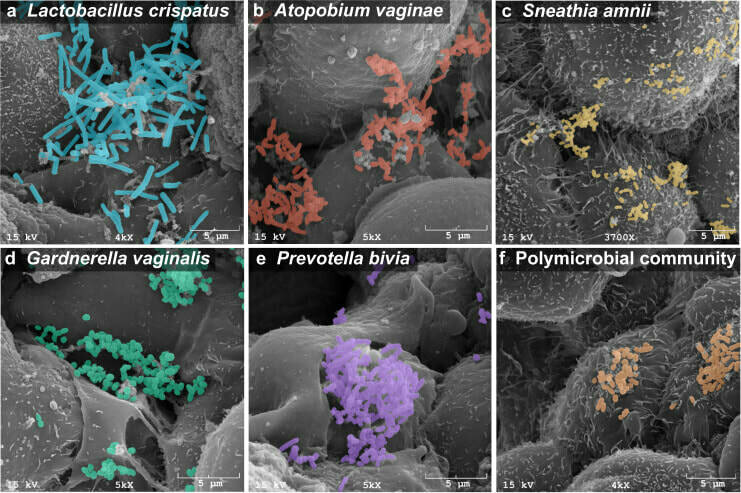
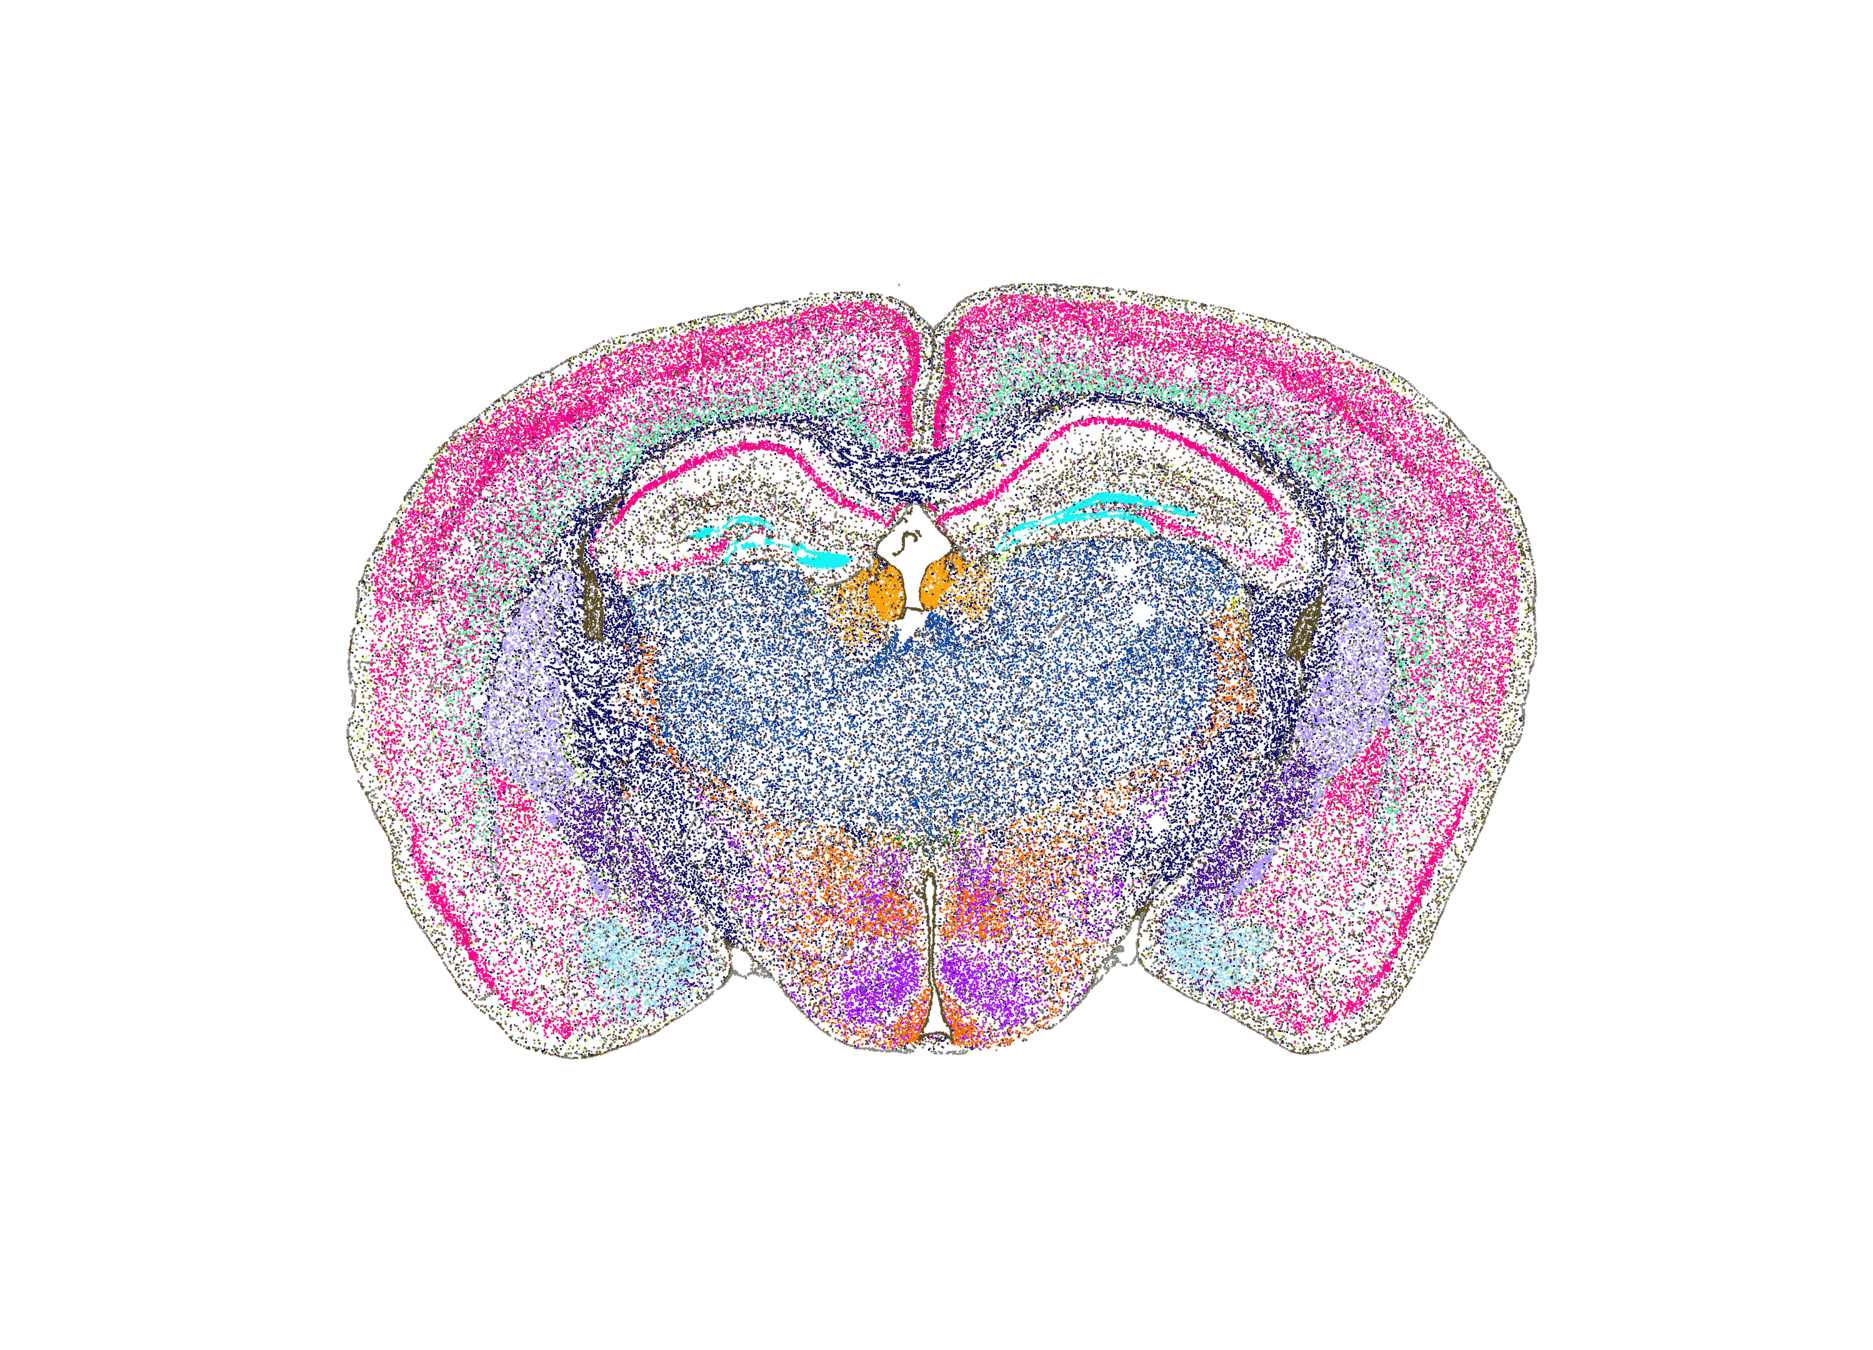
[Allen Institute]
Spatial transcriptomics
[MICrONs]Connectomics
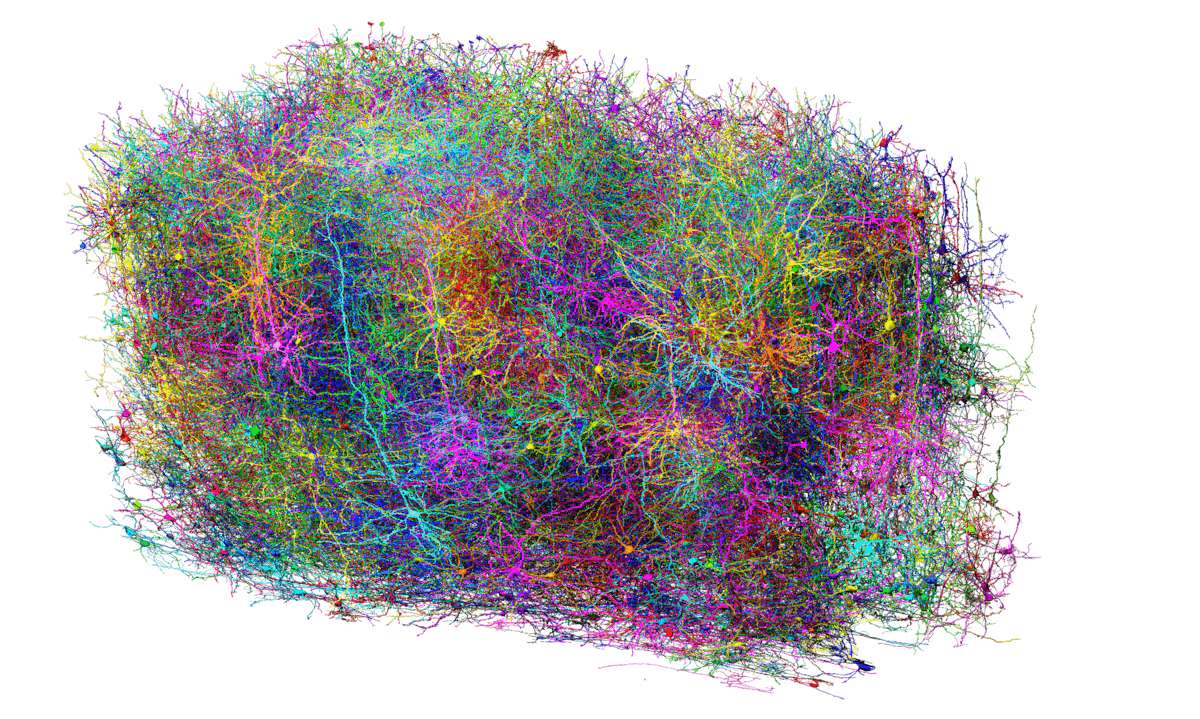
How can we learn descriptive local patterns for different phenotypes?
Biomarker Discovery
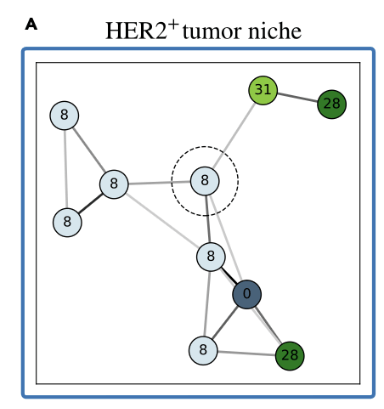
Bi-level Graphs: BiGraph
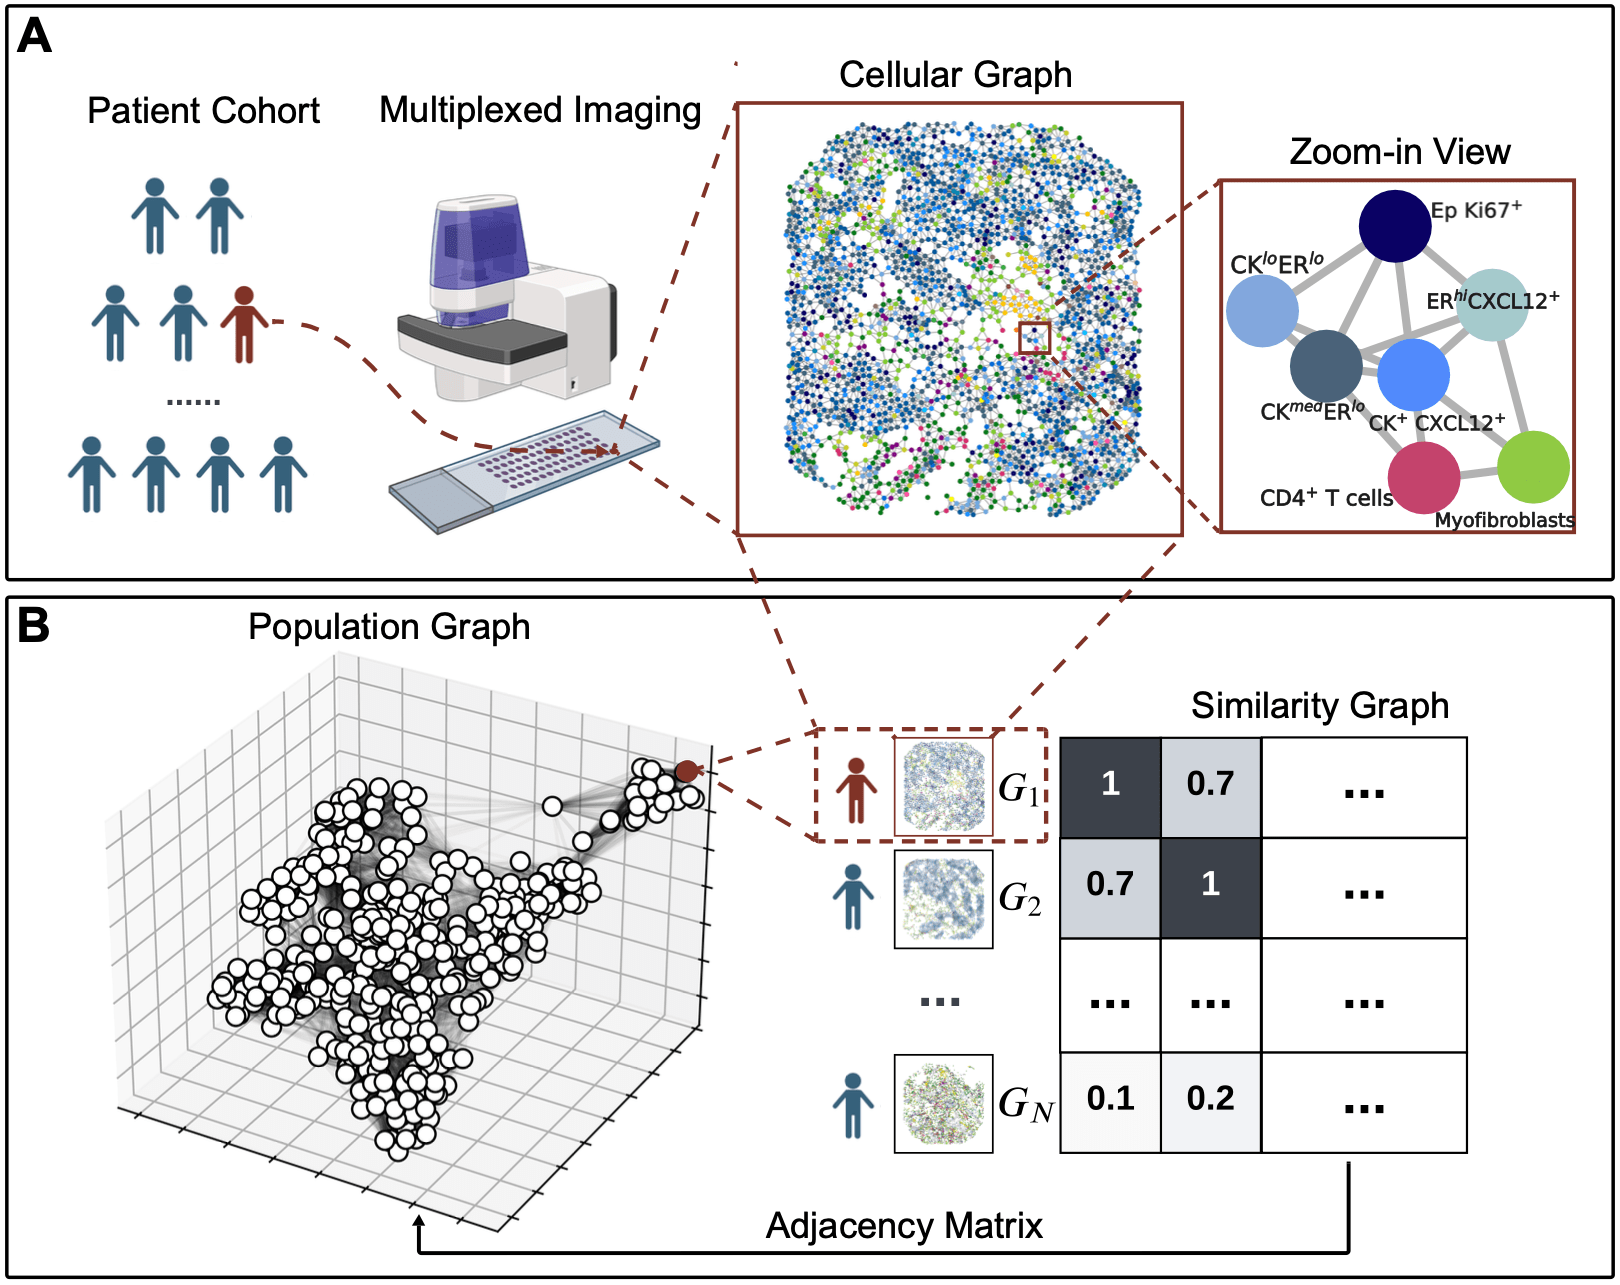
Bi-level Graphs: BiGraph
graph/patient Kernels
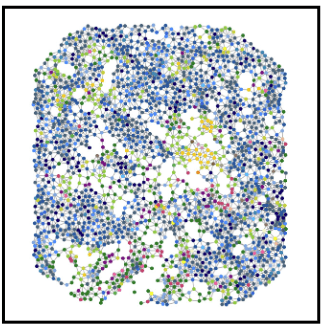



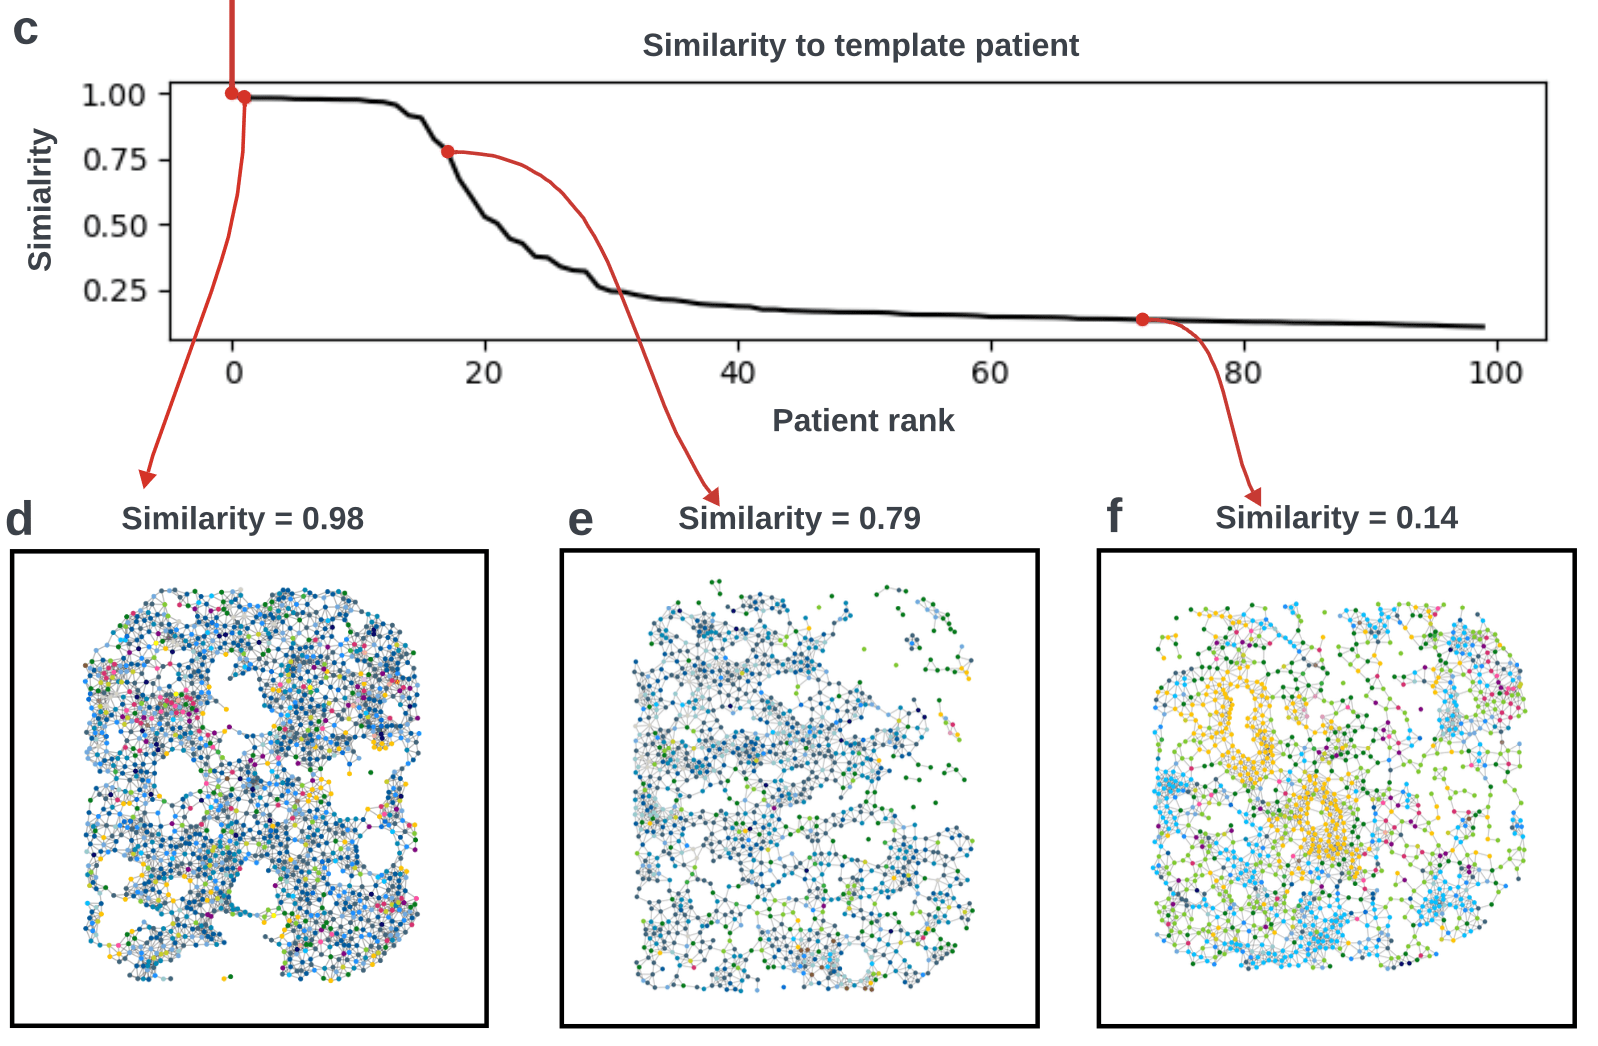
Bi-level Graphs: BiGraph
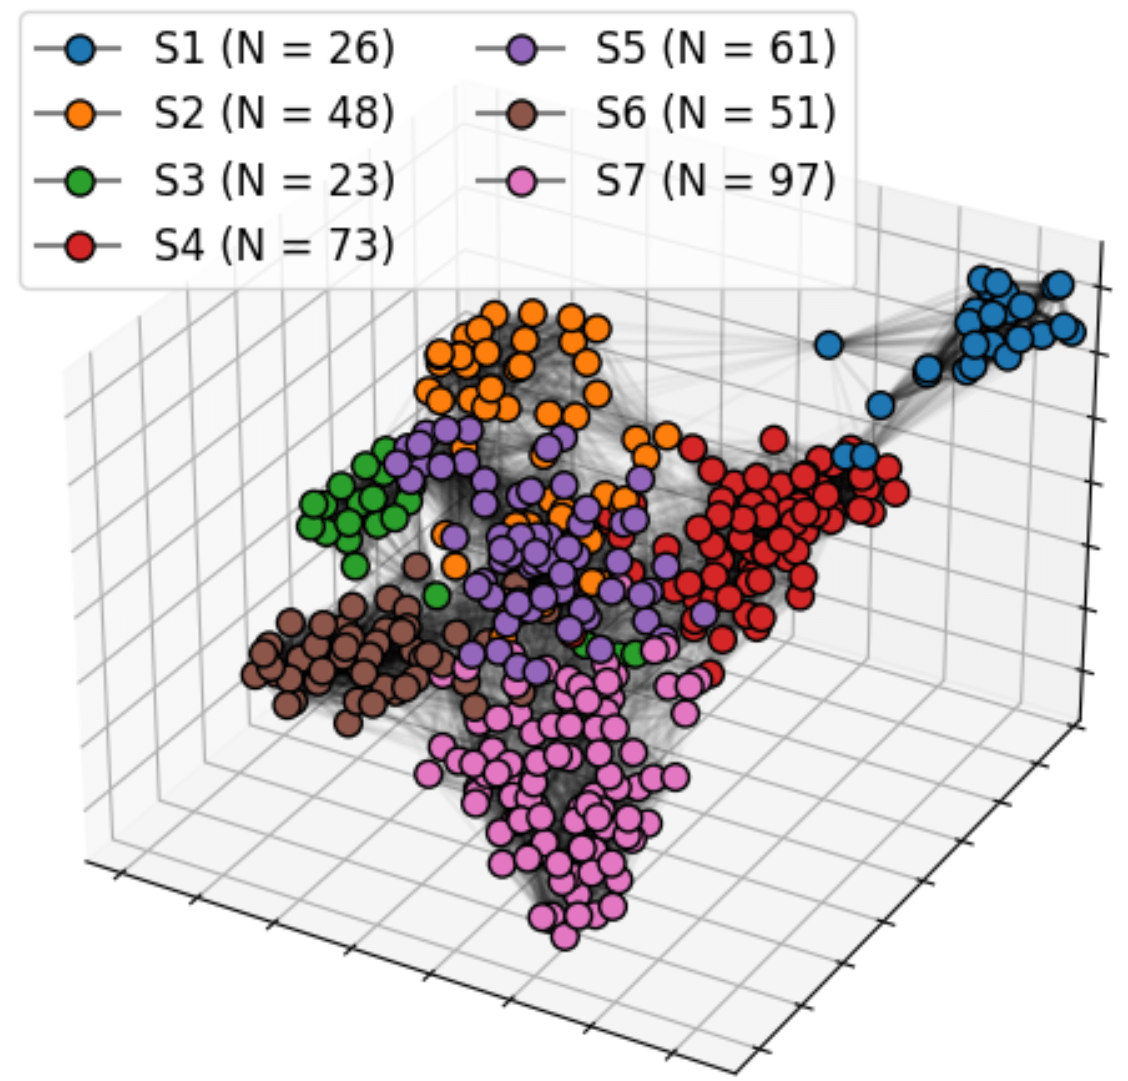
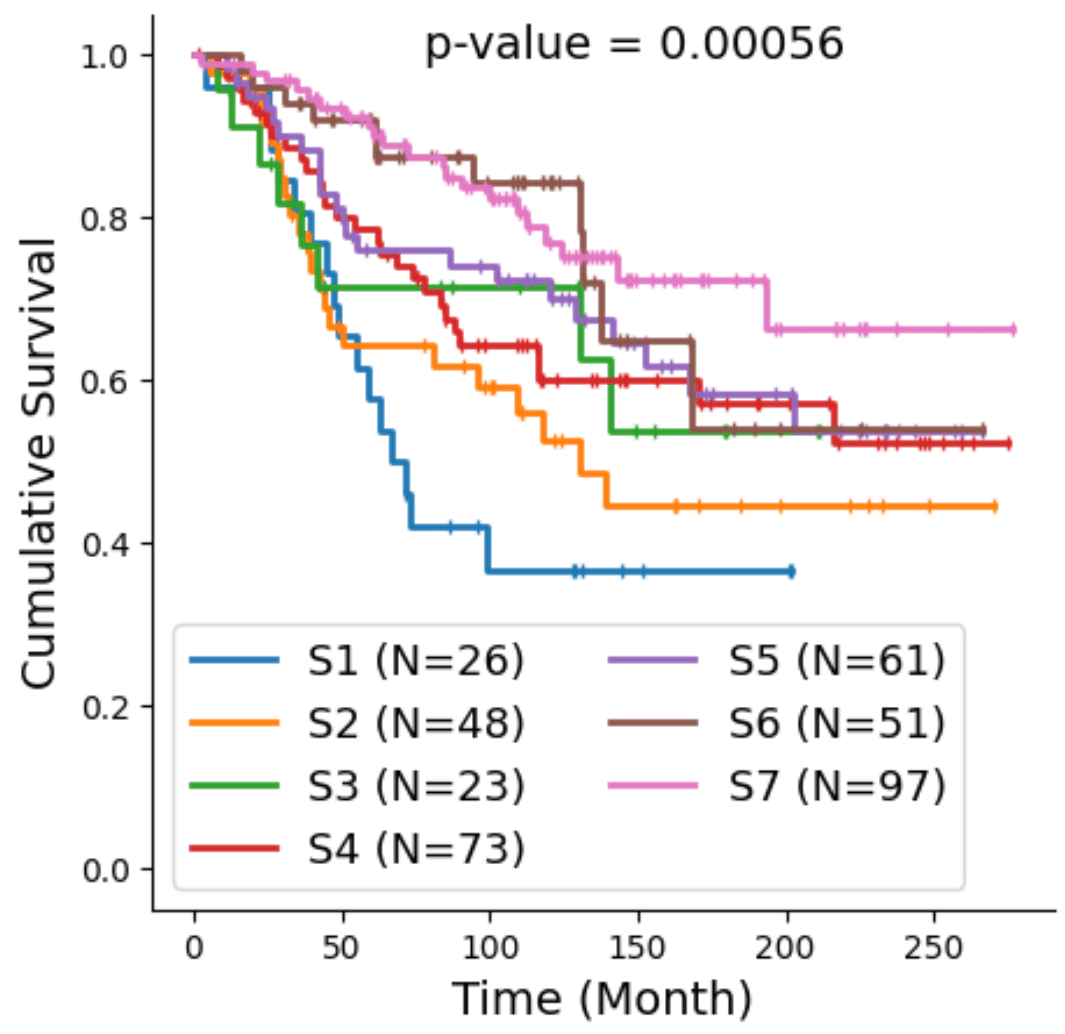
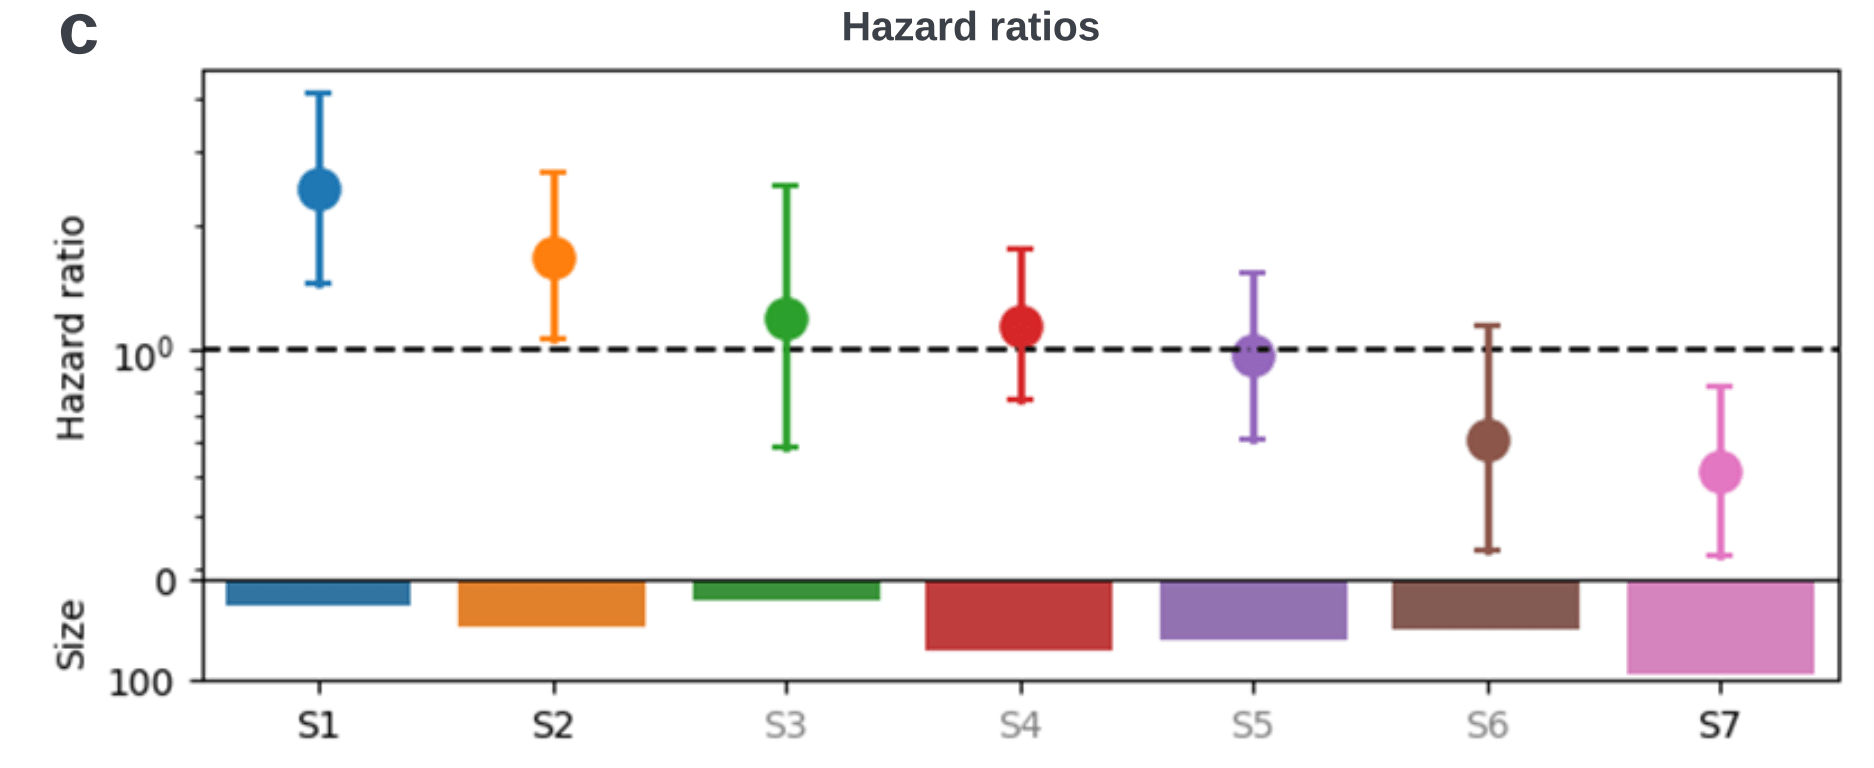
Bi-level Graphs: BiGraph
Community detection

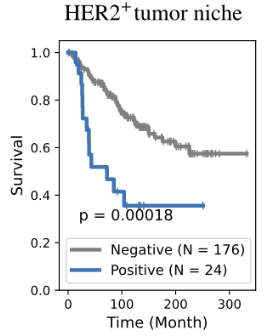
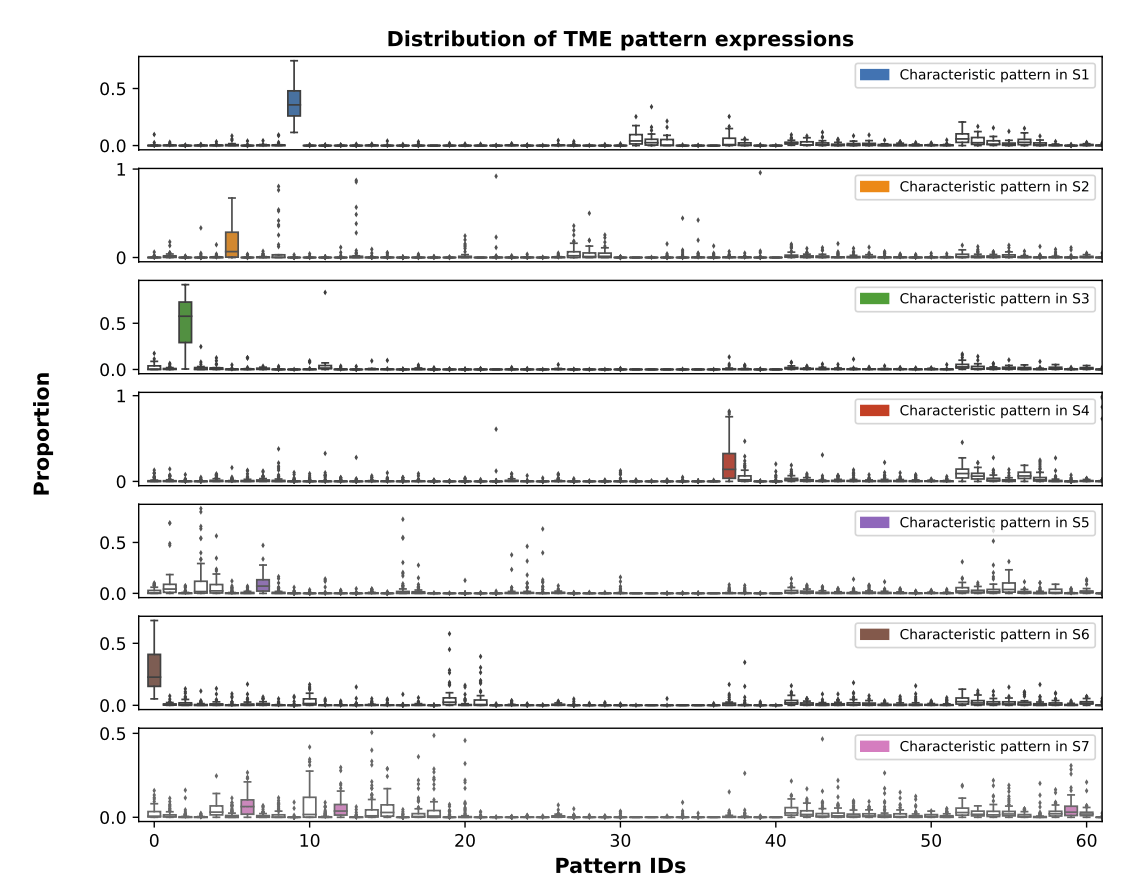
(validation)
data-driven imagingautomatic analysis and rec.societal implicationsProblems in trustworthy biomedical imaging
inverse problems
uncertainty quantification
robustness
biomarker discovery
demographic fairness
hardware & protocol optimization
model-agnostic interpretability
policy & regulation
monitoring & auditing
Problems in trustworthy biomedical imaging

in a box
Denoiser
Measurements
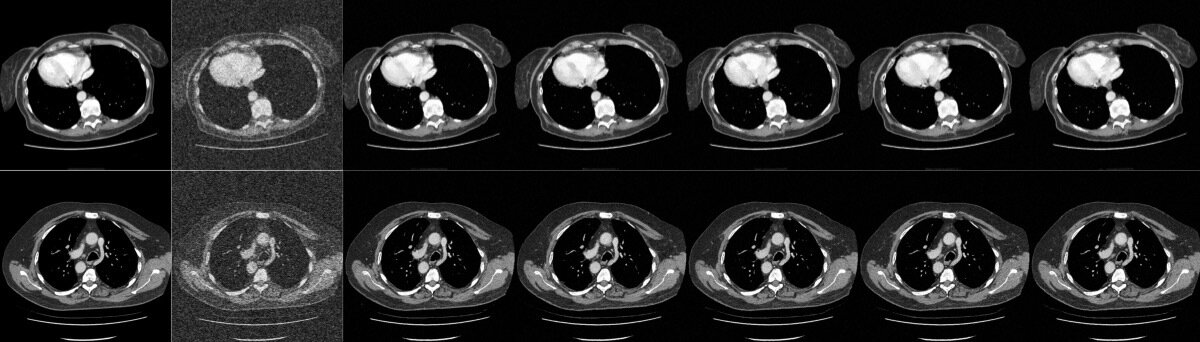
Reconstruction
Uncertainty Quantification
(point predictors)
What is the uncertainty in the guess ?
How do we report uncertainty rigorously?
\(y = Ax + z\)
Uncertainty through Prediction Sets
Miscoverage:
ground truth!
Semantic Uncertainty Quantification
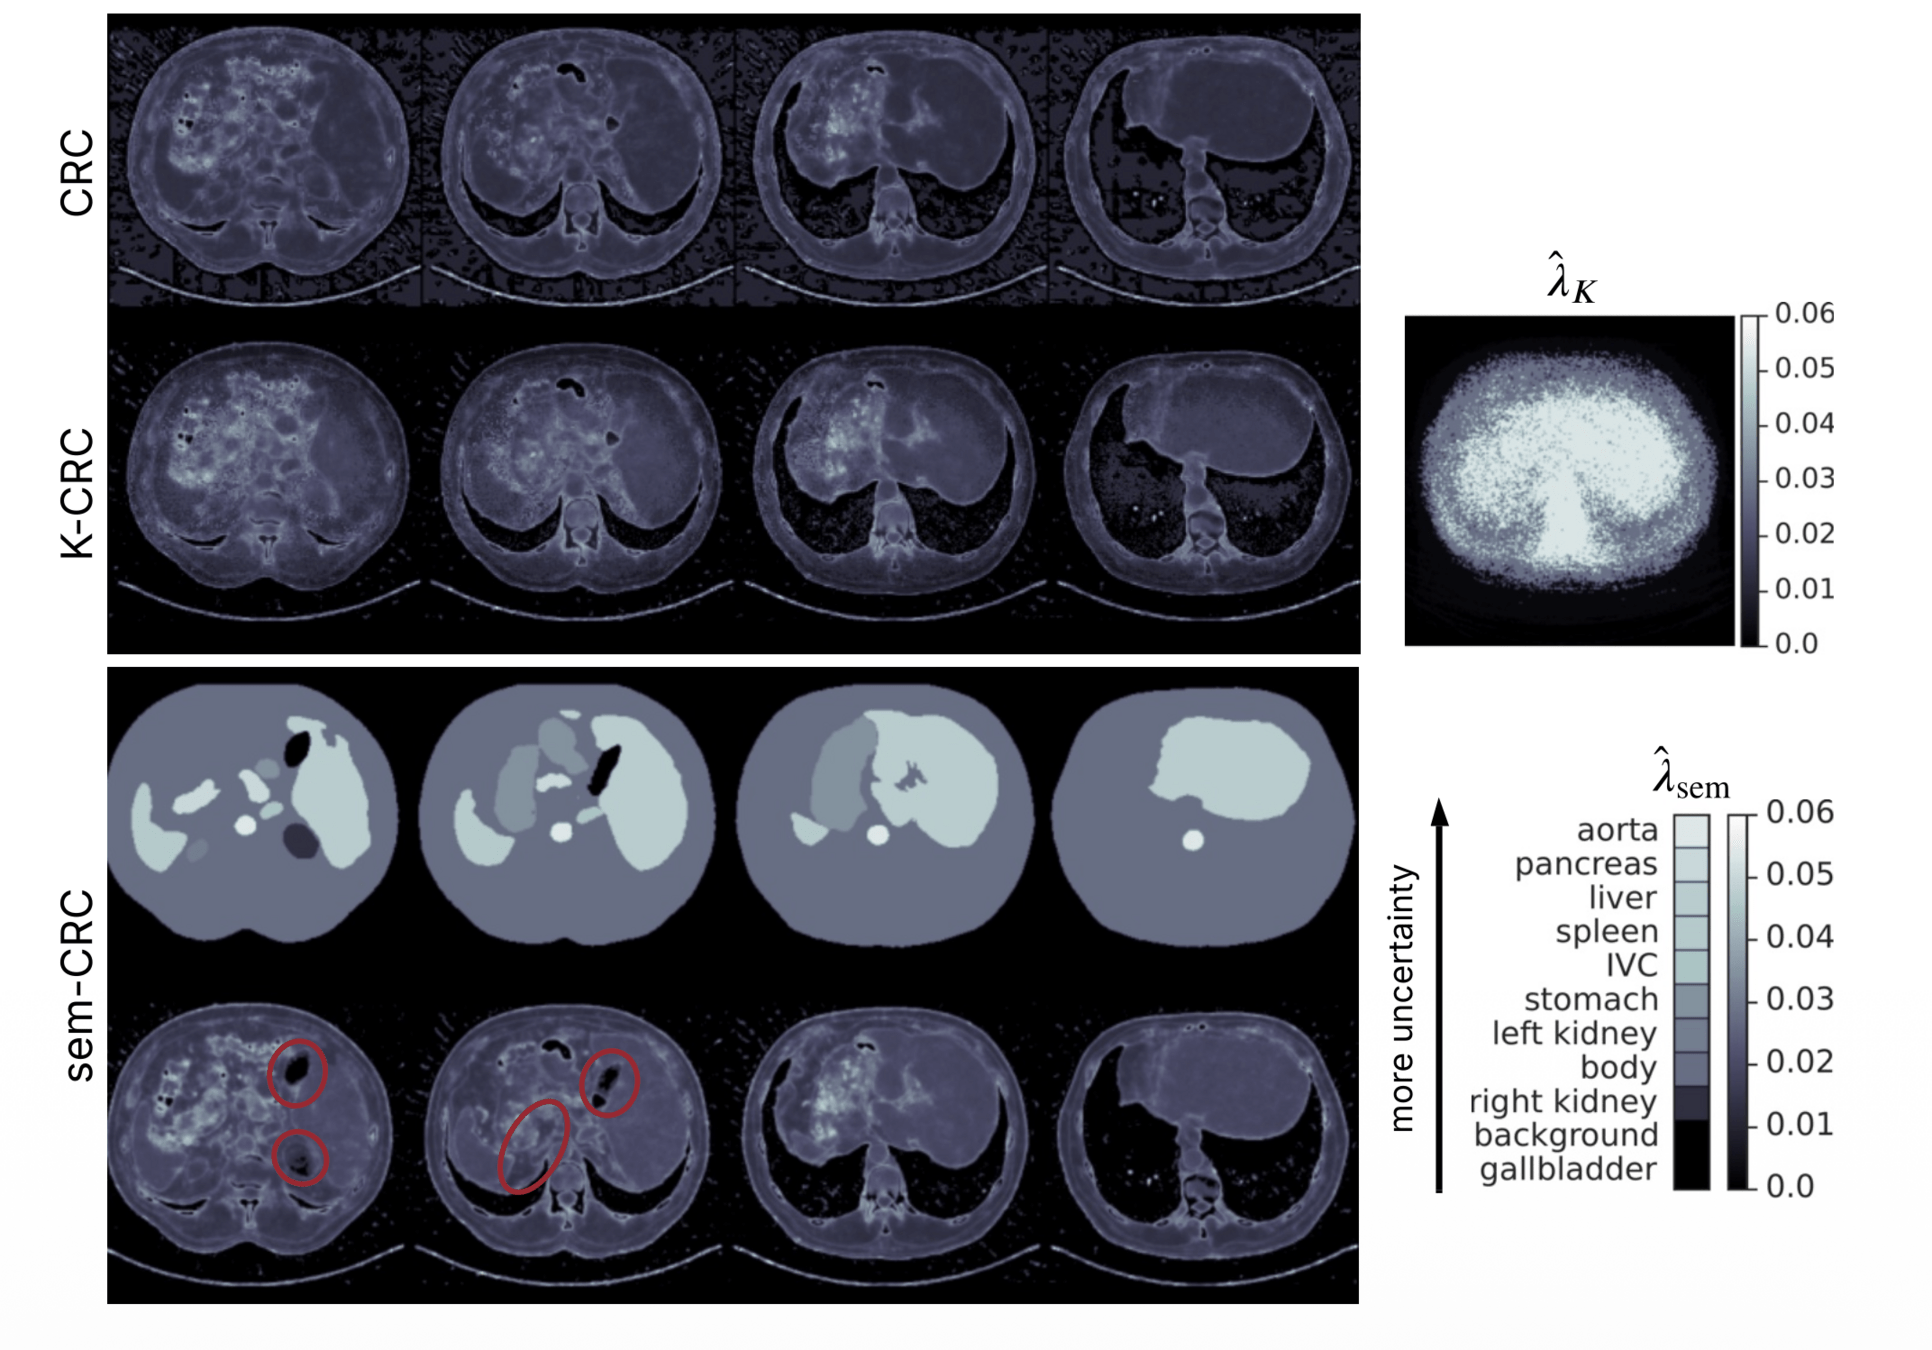
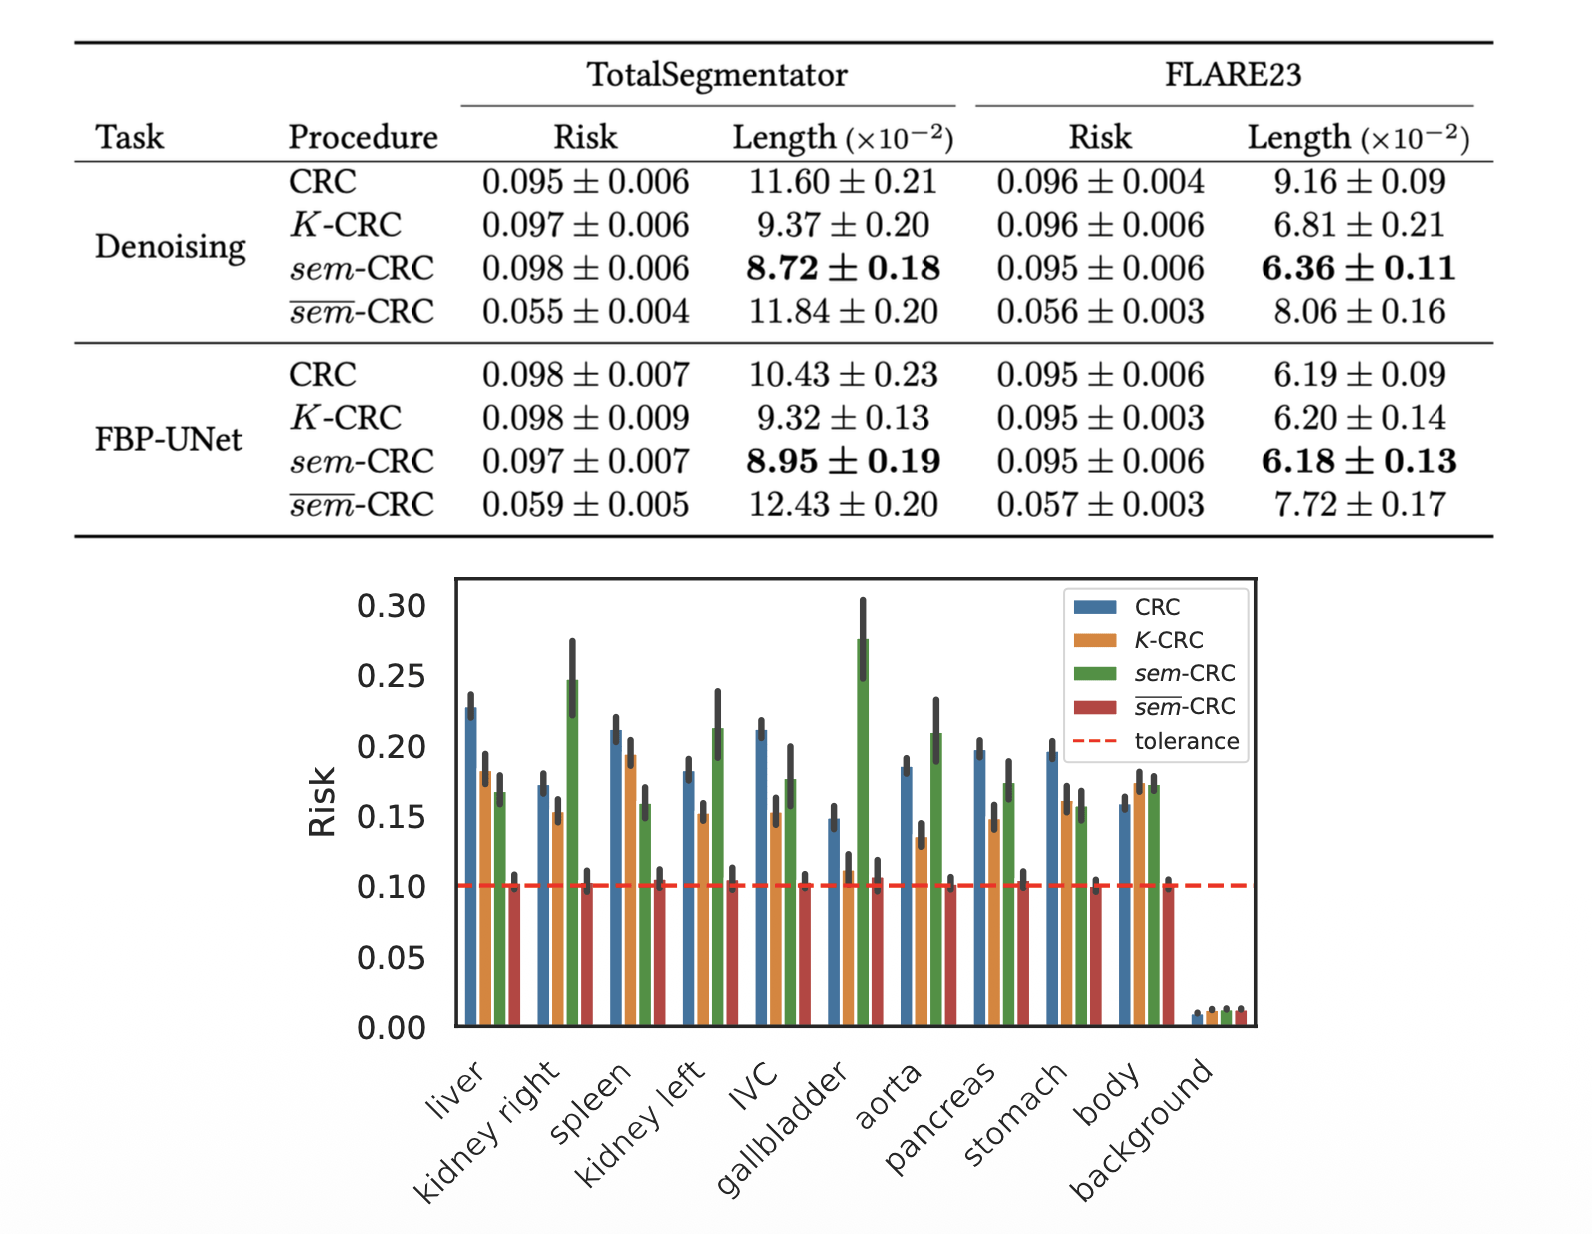
risk controlled uniformly for every organ
[Teneggi, Jacopo, J. Webster Stayman, and Jeremias Sulam. "Conformal risk control for semantic uncertainty quantification in computed tomography." MICCAI , 2025.]
provides a simple procedure so that
\(\mathbb{E} [\text{miscoverage(C(y))}]\leq \epsilon \)
policy & regulation
robustness
generalization
uncertainty quantification






An exciting time to work on biomedical data science
Observation 1: Single for all dimensions... suboptimal
Uncertainty through Prediction Sets
Observation 1: Single for all dimensions... suboptimal
Observation 2: High-dim data is heterogenous
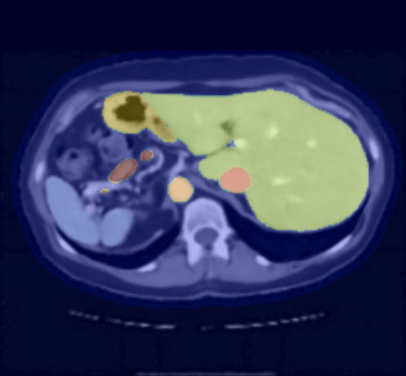
\(\lambda_j\) for each \(j^\text{th}\) organ
Uncertainty through Prediction Sets
data-driven imagingautomatic analysis and rec.societal implicationsProblems in trustworthy biomedical imaging
inverse problems
uncertainty quantification
robustness
generalization
demographic fairness
hardware & protocol optimization
model-agnostic interpretability
policy & regulation
monitoring & auditing
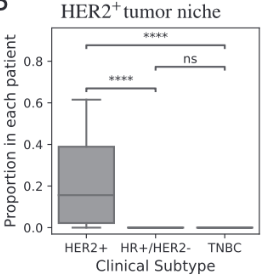
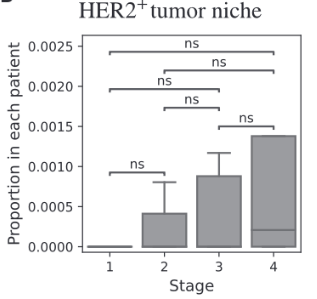
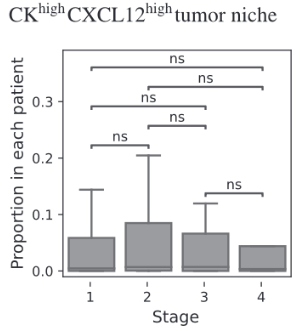
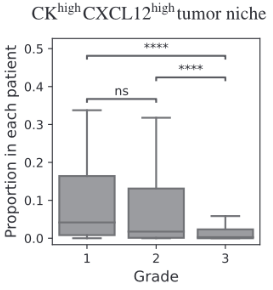
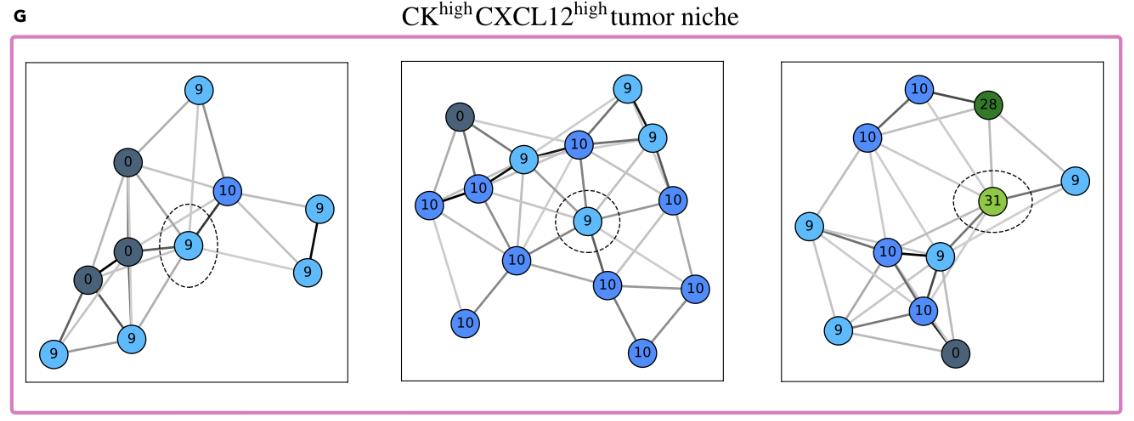
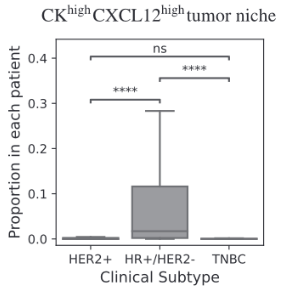
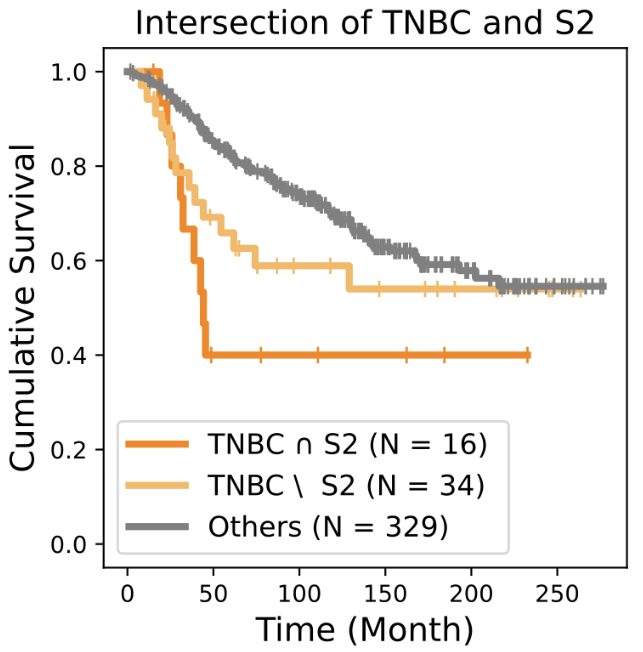
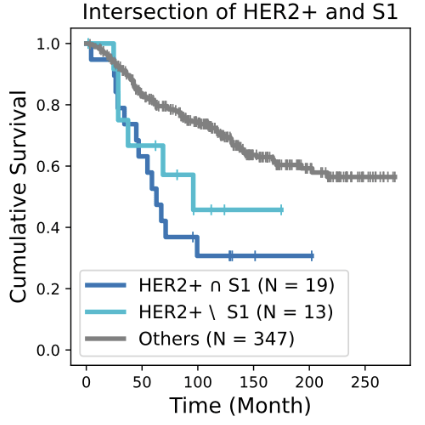
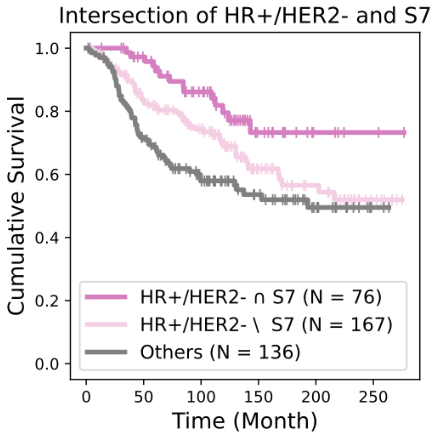
BiGraph provides complementary information to standard clinical characteristics
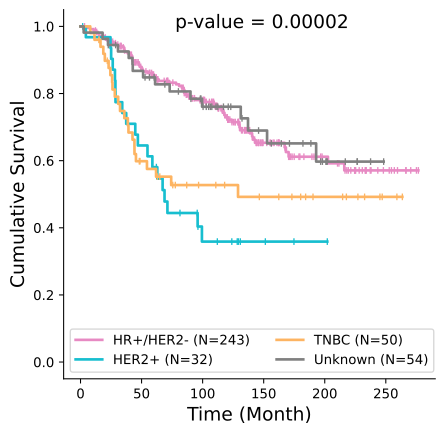
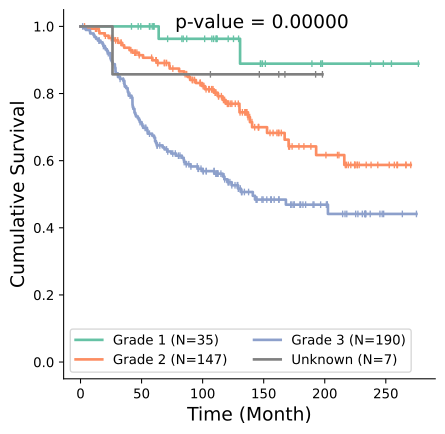
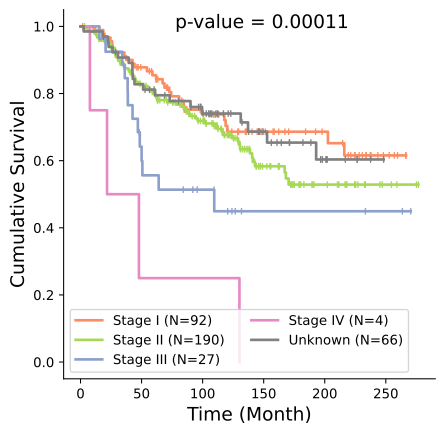
Tumor Stage
Tumor Grade
Tumor Subtype
BiGraph provides complementary information to standard clinical characteristics
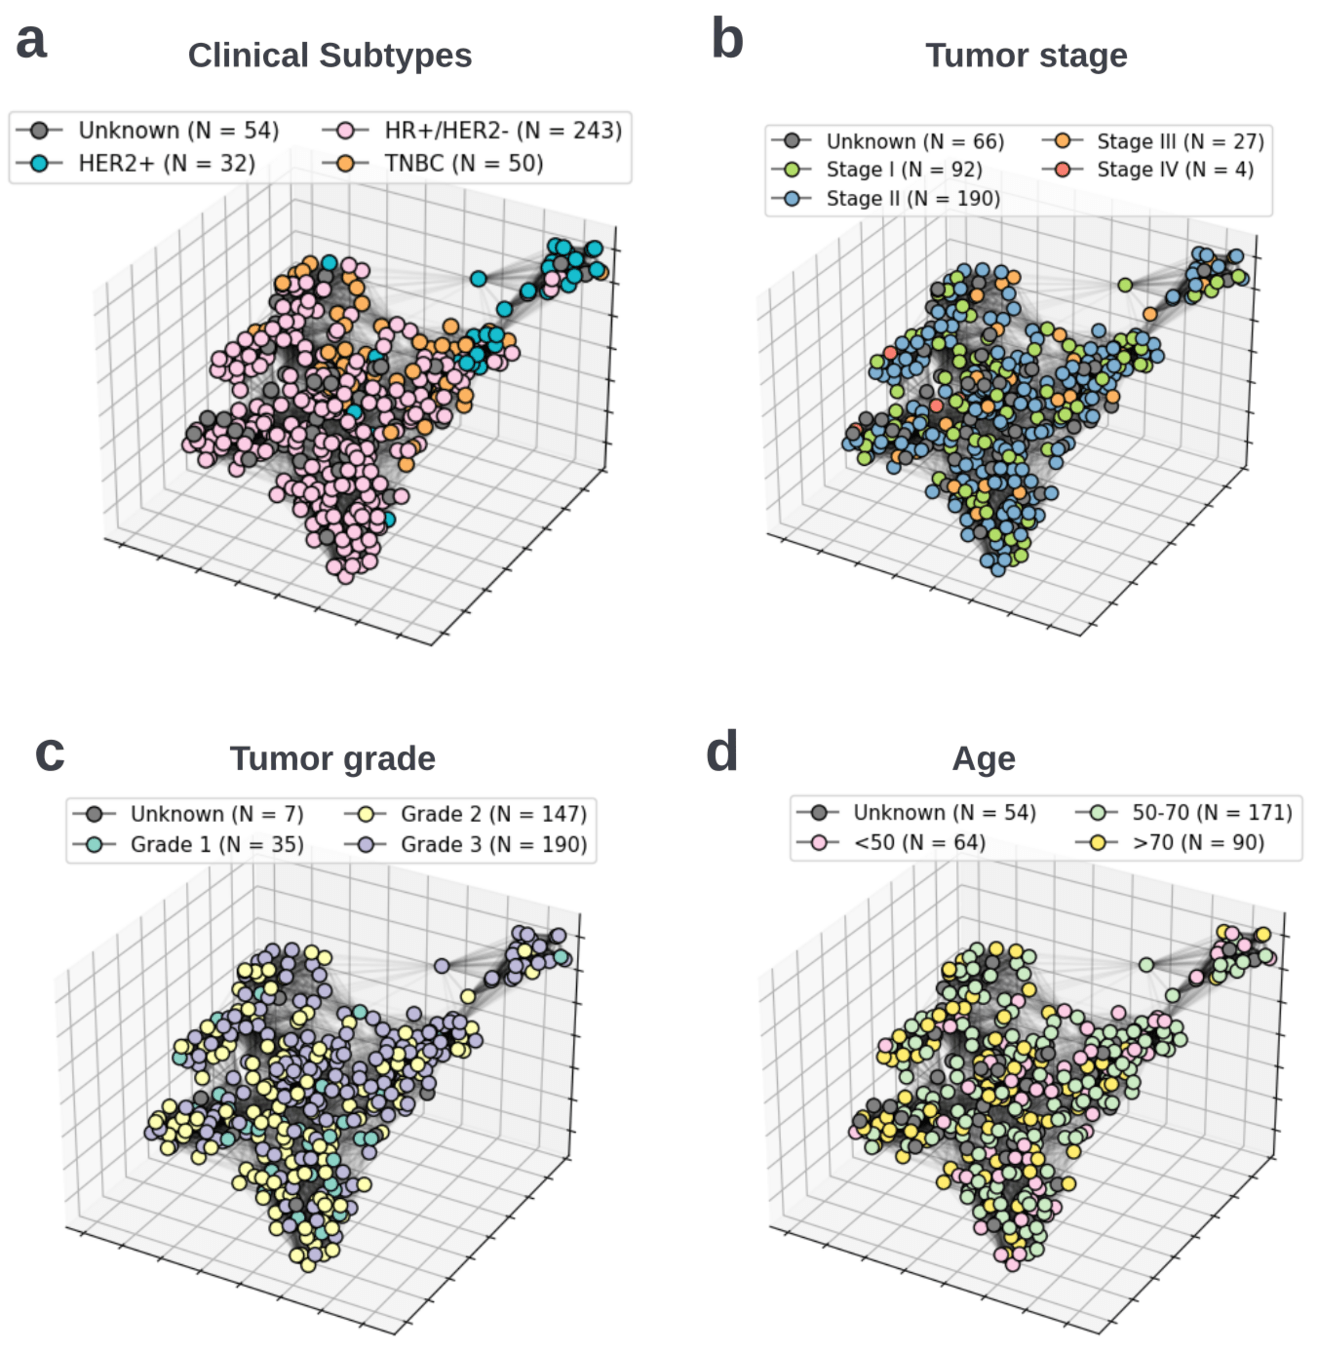
BiGraph provides complementary information to standard clinical characteristics
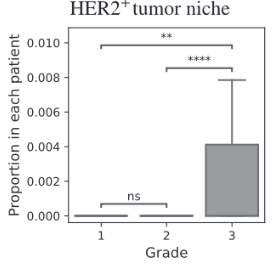
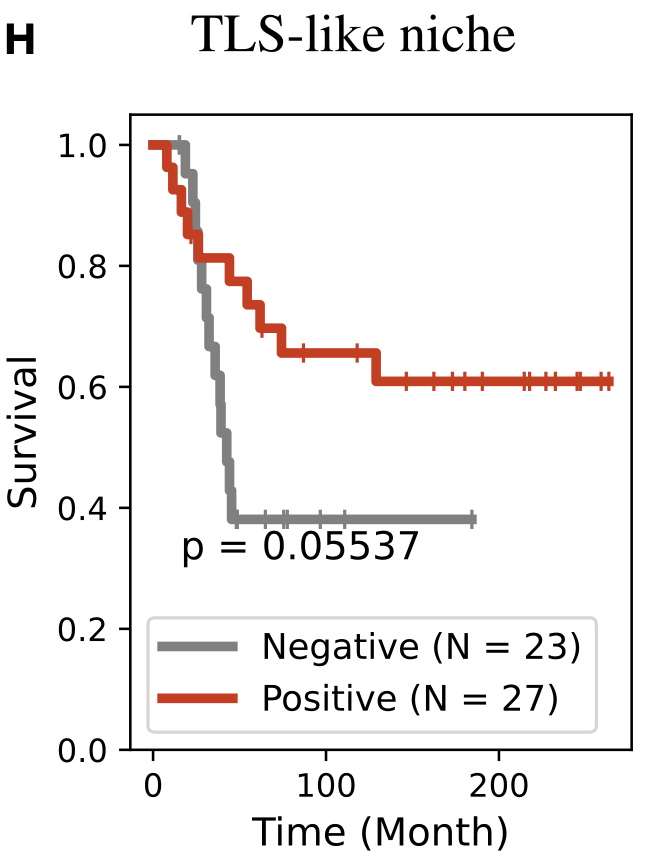
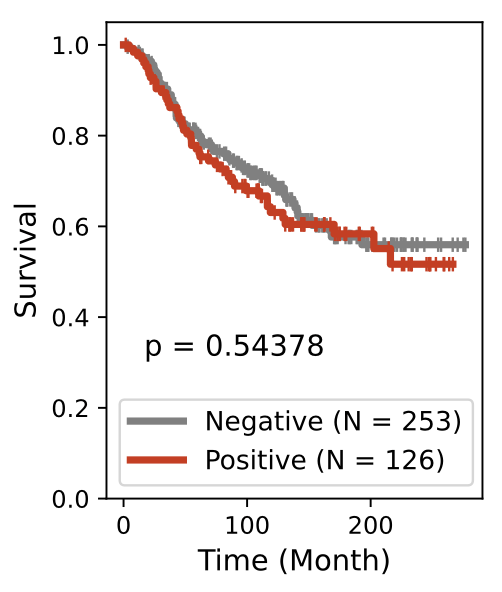
Biomarkers for TNBC
Biomarkers for TNBC
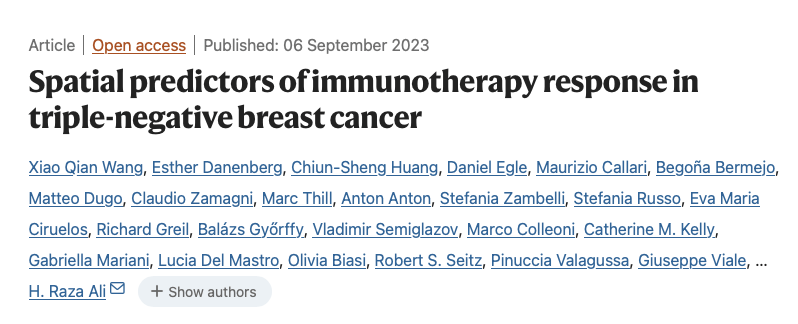
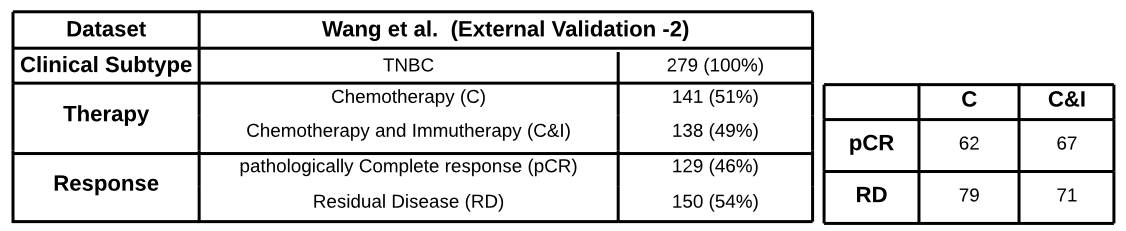
- 279 early triple-negative breast cancer (TNBC) patients in a randomized pre-surgical neoadjuvant immunotherapy clinical trial (ICB)
-
pathology Complete Response (pCR) vs
residual disease (RD)
all subtypes
TNBC
Biomarkers for TNBC
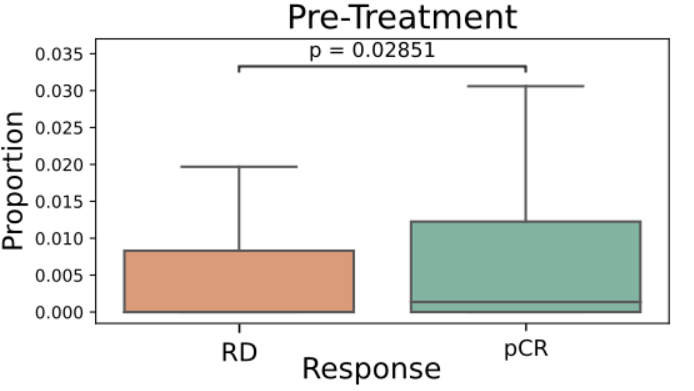
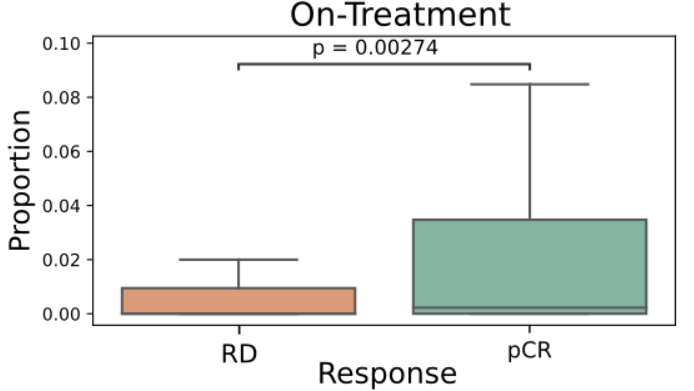
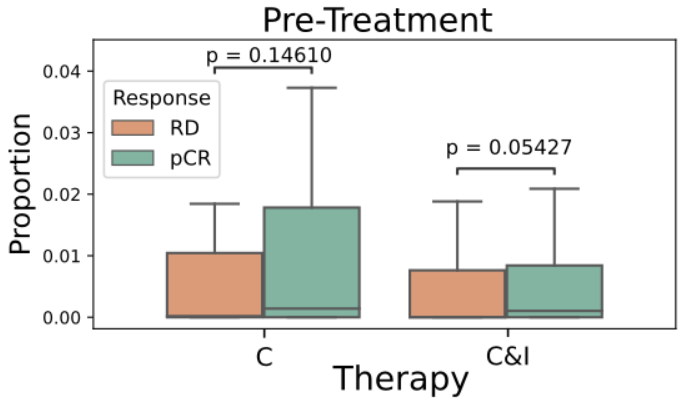
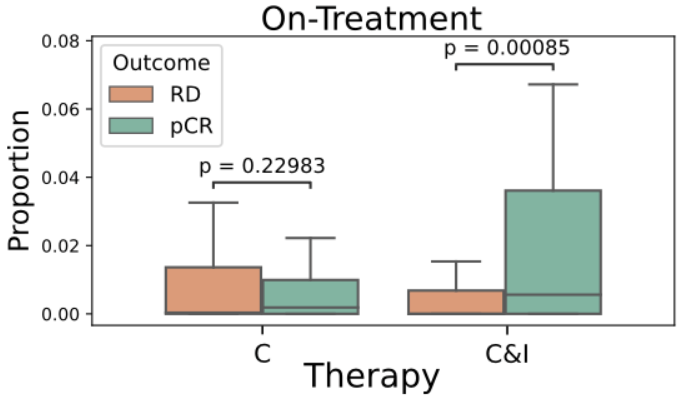
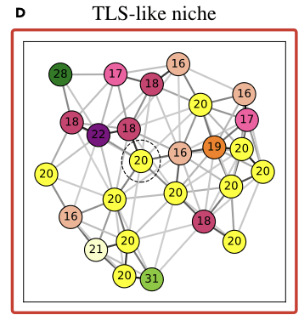
- TLS are known to promote local immune responses and are generally associated with favorable prognosis in immunologically “hot” tumors.
-
Prior studies have shown mixed results in breast cancer overall, but more consistent positive associations in TNBC.
all subtypes
TNBC
proportion of
TLS-like niche
proportion of
TLS-like niche
proportion of
TLS-like niche
proportion of
TLS-like niche

[Z Wang et al, Bi-level Graph Learning Unveils Prognosis-Relevant Tumor Microenvironment Patterns from Breast Multiplexed Digital Pathology, Patterns: Cell Press 2025]Problems in Biomedical Imaging TTREC 2026
By Jeremias Sulam