GIS in R

What is a GIS?
Software and file types
Projections and coordinate reference systems
Spatially referenced data in R
Sourcing
Manipulating
Visualizing
What is GIS?
GIS
" system designed to capture, store, manipulate, analyze, manage, and present all types of spatial or geographical data"
-- wiki
Term coined in 1968
-Roger Tomlinson, Canadian regional planner
GIS
Relational database where index field is spatiotemporal reference
Generally, baselines are from topos, enhanced with satellite imagery / aerial data
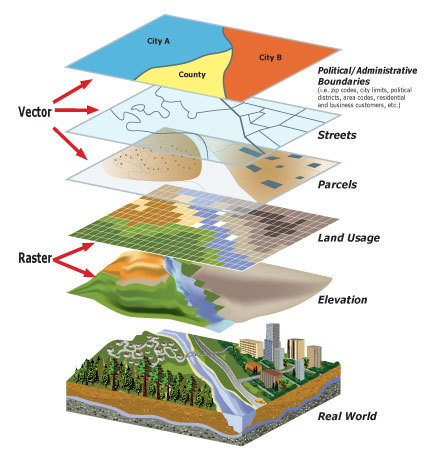
Data representation
Vector
- continuous boundary; categorical value
Raster
- continuous value; systematic boundary
3D color images
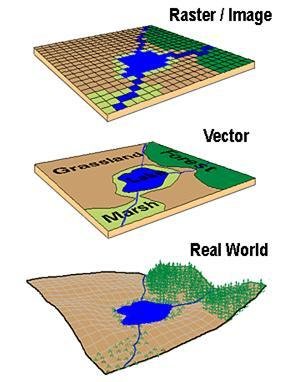
Source: bgis.sanbi.org
Shapefiles
ESRI's file format
- Vector data (shape, poly, point)
- Set of files stored together in common directory
- Projection info stored separately from boundaries
Source: bgis.sanbi.org
Existing software and file types
Front-end
ArcGIS (ESRI)
Google Maps / Earth (KML)
Back-end
GDAL/OGR (Geographic data abstraction library)
- File import/export engine
- Raster-focused
- R access through rgdal: readOGR / writeOGR
GEOS (topological projections)
Shapefile architecture
- .shp = object boundaries
- .dbf = attribute data
- .prj = projection
Google maps
Data in kml files
KML = "keynote markup language"
Spatial vsn of XML
Map Projections and Coordinate Reference Systems
Map Projections
Systematic transformation of locations on a sphere to locations on a plane
Developable surfaces
- Surface that can be unfolded/unrolled without stretching, shriking, or tearing
- Cylinder, cone, plane
For sphere, some metric always gets distorted
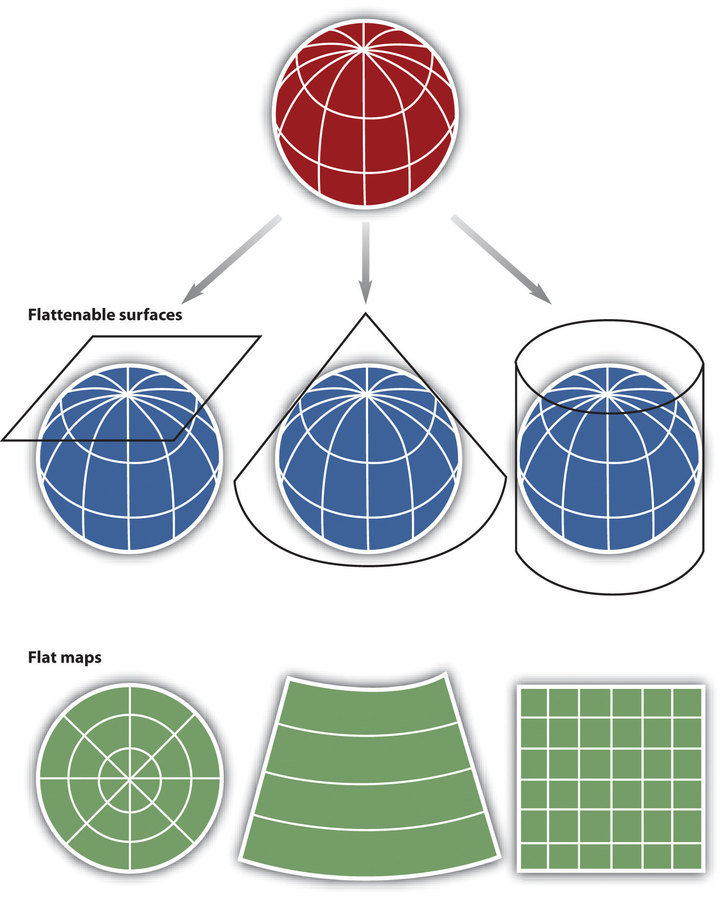
Source: Geographic Information System Basics, Schmitz (2012)
Projection Strategy
1. Project to developable surface
2. Unroll surface into plane
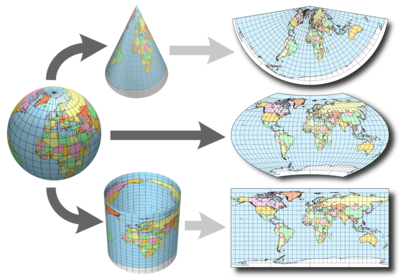
Flattened to plane
Developable surfaces
Source: http://www.progonos.com
Projection considerations
What metric to distort?
- Area
- Shape
- Direction
- Bearing
- Distance
- Scale
Check out all these projections!
Coordinate Reference System
Examples
- Lat/Long
- Universal Transverse Mercator (UTM)
Elements
- Measurement framework (spherical coordinates or planimetric)
- Units
- Map Projection used
Spatially Referenced data in R
Package
rgdal ------------------------ brings GDAL/OGR functionality to R
spatial ---------------------- defines key spatial object classes
sp ---------------------------- transformation and drilling functionality
maptools ------------------ gets a lot of use, especially readShapePoly
rgeos ----------------------- interface engine connecting R with GEOS
(C API with lots of nice topological functionality)
Functionality
SPDFs
(Spatial Points (Polys, Etc) Data Frames)
- defined in spatial
- S4 objects
- SPDFObject@data gets you regular dataframe
- Heading slots to specify coordinate reference system
Convert dataframe into SPDF
1. Read in csv with coordinates stored in "Long" and "Lat"
MyData <- read.csv("<Path to data.csv>", header = T)
class(MyData) == data.frame
2. Use coordinates() function to specify coordinates
coordinates(MyData) = ~ Long + Lat
class(MyData) == SPDF
3. Specify coordinate reference system
latlong <- "+init=epsg:4326"
proj4string(MyData) <- CRS(latlong)
Sourcing spatial data into R
Basic layers
Political boundaries
- US Census TIGER products
- http://www.census.gov/geo/maps-data/data/tiger.html
- Census tracts, Urban/Rural, Tribal
Topography
- DEM (= "digital elevation map")
- http://earthexplorer.usgs.gov/
Lots of map tiles available through leaflet
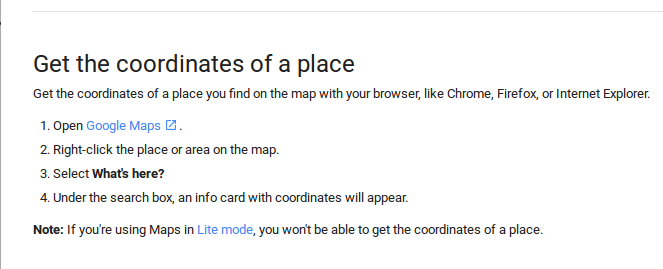
Import map tiles from google
Enter google maps
Navigate to location of interest
Get coordinates:
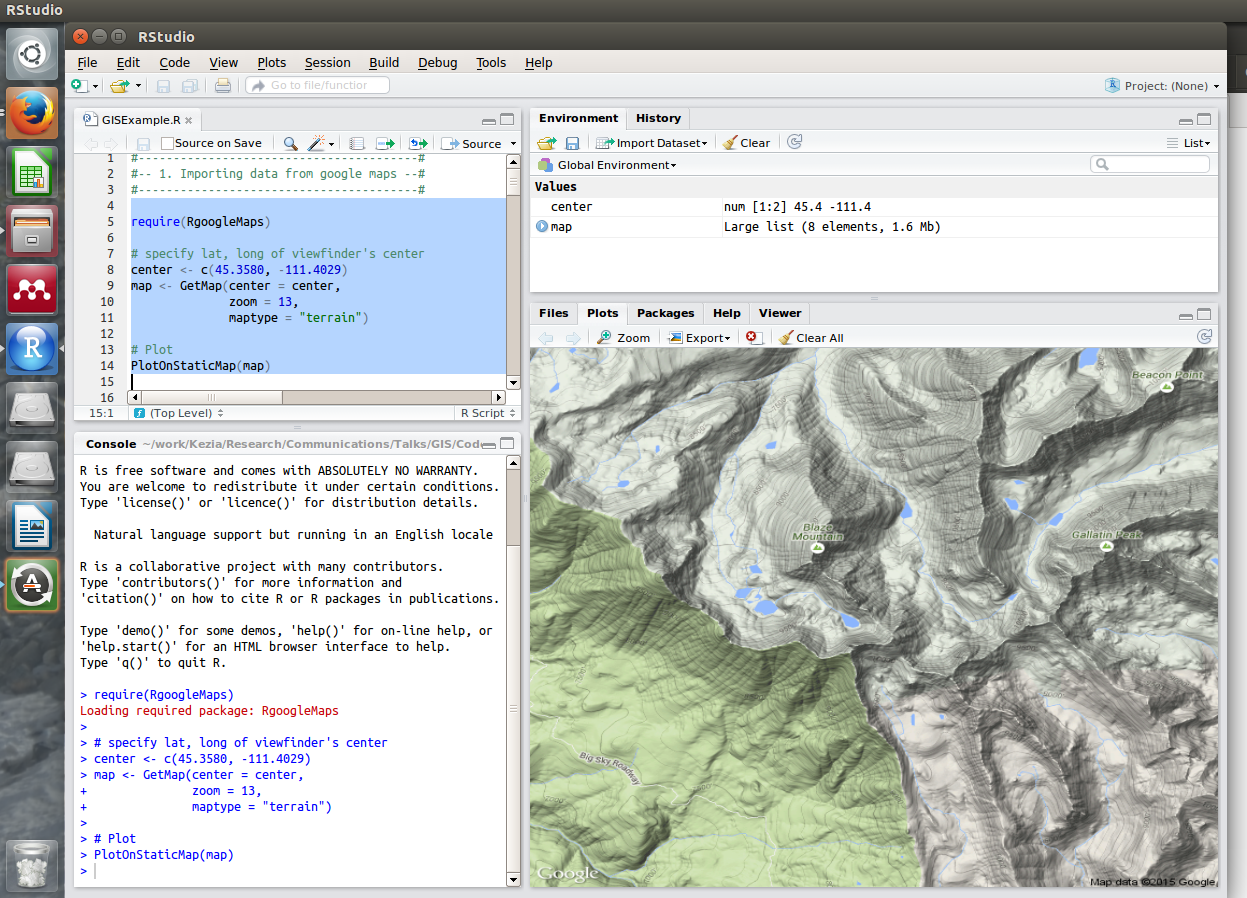
Import data from Google Maps
require(RgoogleMaps)
center.in <- c(45.358, -111.403)
map <- GetMap(center = center.in, zoom = 13, maptype = "terrain")
Read ESRI shapefiles
maptools
-
readShapeSpatial("<Path to .shp>.shp")
- Does NOT manage projection info
- You have to do this by hand!!
rgdal
- readOGR(dsn = "<Path to layer's directory>", layer = "<Layer name no extension")
- imports projection information
Read KML files from google Earth
with maptools
GoogleEarthData <- getKMLcoordinates(kmlfile = "./Data/MyPoints.kml")
Points come in a list, so
GoogleEarthData <- do.call("rbind", GoogleEarthData)
Manipulating
spatial data with R
Reprojecting
(Changing to another CRS)
Check current projection with
proj4string(MySPDF)
spTransform() in sp to switch to a new projection
MySPDFReprojected <- spTransform(MySPDF, CRS(latlong))
(recall: we defined latlong earlier to be an object specifying a particular CRS)
Reprojecting
(to work with a google map tile)
Load RgoogleMaps
require(RgoogleMaps)
Project data to decimal-degrees if it's not already there
MySPDFLatLong <- spTransform(MySPDF, CRS(latlong))
Recenter lat/longs relative to google map tile
MySPDFGoogle <- LatLon2XY.centered(MyMapTile,
MySPDFLatLong$Latitude,
MySPDFLatLong$Longitude,
zoom = GoogleZoom)
Aggregating over layers
("Drilling down")
Goal:
Align two layers & extracts values from one layer that occur at spatial locations specified in the other
over() in sp
MyPoints <- readOGR(dsn = "./PathToPoints", layer = "MyPointsLayer")
MyPolys <- readOGR(dsn = "./PathToPolys", layer = "MyPolysLayer")
PolyValsAtPoints <- (MyPoints %over% MyPolys)$Value
Extracting overlap areas
Scenario:
Shapefile of polygons; extract overlap area for each pair
gIntersection() in rgeos
MyPolys <- readOGR(dsn = "./PathToPolys", layer = "MyPolysLayer")
# Extract geometries of the two focal polygons
Poly1 <- MyPolys$Polygons[[1]] # gets 1st polygon from MyPolys
Poly2 <- MyPolys$Polygons[[2]] # gets 2nd polygon from MyPolys
require(rgeos)
Poly1Poly2Overlap <- gIntersection(Poly1, Poly2, byid = F)
Data visualization
Building static maps
1. Import map tile from google maps
require(RgoogleMaps)
center.in <- c(45.358, -111.403)
MyMap <- GetMap(center = center.in,
zoom = googlezoom,
maptype = "terrain")
2. Project points and store in dataframe
MyPoints <- readOGR("./PathToPoints", layer = "MyPoints")
MyPointsGoogle <- LatLon2XY.centered(MyMap,
MyPoints$Lat, MyPoints$Long, zoom = googlezoom)
MyPointsGoogleData <- data.frame(MyPointsGoogle)
3. Assemble plot
PlotOnStaticMap(MyMap)
points(MyPointsGoogleData$newX, MyPointsGoogleData$newY,
pch = 16, col = "blue")
Building dynamic maps
RStudio's interface with leaflet
GISinR
By Kezia Manlove
GISinR
UseR-Bozeman presentation on using R for GIS functionalities


