Change of Phase and Thermodynamics
M. Rocha
Physics 1 - Chapters 17 and 18
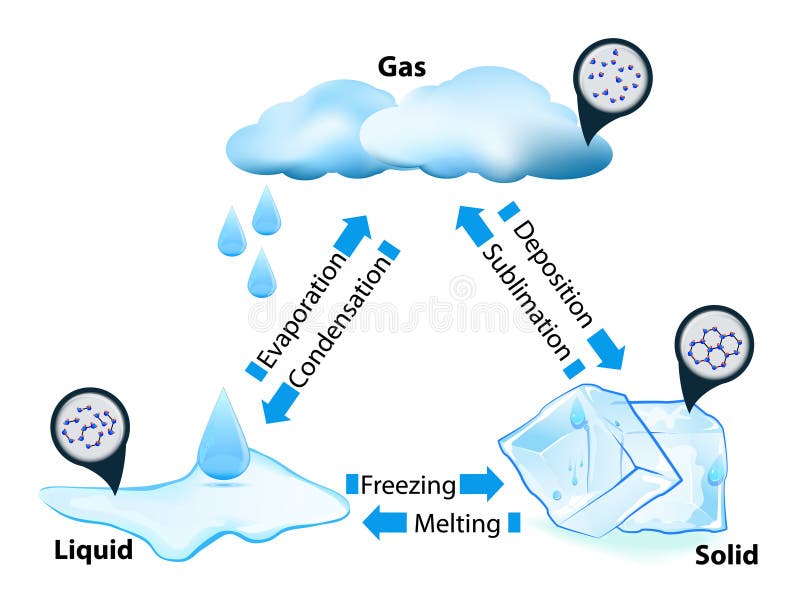
Phase Transitions
Inter Molecular Forces in Play
Van der Waals (Atraction)
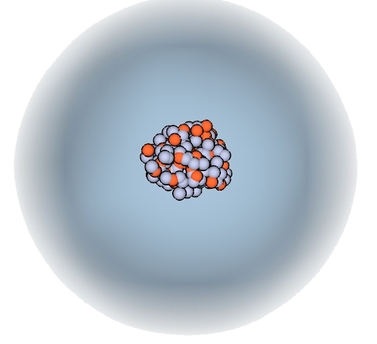
Electron Overlap (Repulsion)


Inter Molecular Forces in Play
Temperature and pressure make molecules be either too far, at the optimal distance for attraction, or too close
Potential Energy
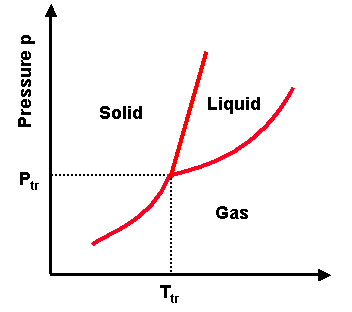
Phase transitions depend on the molecular properties of the material, temperature and pressure

Evaporation
Evaporation is the change of phase from liquid to gas
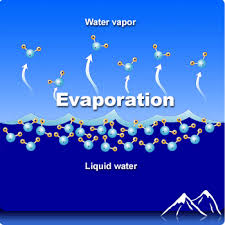
Evaporation
Evaporation is the change of phase from liquid to gas
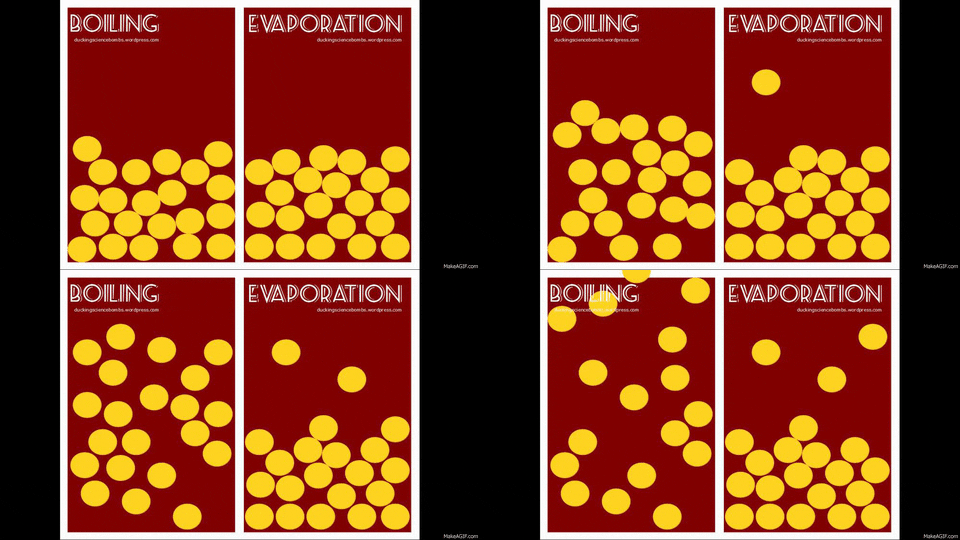
Evaporation can happen below the surface when boiling
Evaporative Cooling
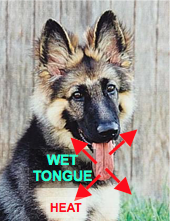
Because only the most energetic molecules can escape the surface, evaporation removes internal energy from the liquid, thus evaporation cools



Condesation
Condensation is the reverse of evaporation, a change of phase from gas to liquid


Condesation
Condensation is the reverse of evaporation, a change of phase from gas to liquid
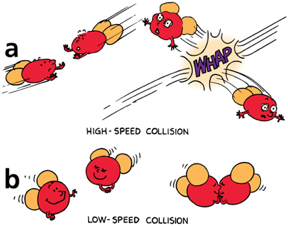
a) At high speeds, molecules of water vapor bounce apart and remain a gas.
b) At lower speeds, molecules of water vapor are more likely to stick together and form a liquid
Checkpoint
Why is it that a 90 degree day in a dry climate feels more comfortable than a 90 degree day in a humid place?
In a dry climate you’re cooled by evaporation, in a wet climate you’re heated by condensation
Melting
Melting is the change of phase from solid to liquid.
While melting, the solid absorbs heat from the environment


Freezing
Freezing is the change of phase from liquid to solid.
While freezing, the solid releases heat into the environment

Sublimation
Sublimation is the change of phase from solid to gas without passing through the liquid phase.

Solid carbon dioxide (dry ice) sublimates at -109 °F.

Energy and Changes of Phase

Energy and Change of Phase

1 Calorie = 4.2 Joules
Phase transitions require energy
Heating 1 gram of water
Water Heat Capacity in calories = 1 cal/g °C
\Delta T = \frac{\mathrm{Heat \ Transferred}}{\mathrm{Heat \ Capacity} \times \mathrm{mass}} = 1 \degree C / cal
Checkpoint
It takes 80 Calories for 1 gram of water to change phase from solid to liquid, and the specific heat capacity of water is 1 Calorie/(g °C). How much energy do you need to melt 1 gram of ice and end up with water at 20 °C ?
100 Calories
\Delta T = \frac{\mathrm{Heat \ Transferred}}{\mathrm{Heat \ Capacity} \times \mathrm{mass}}
Thermodynamics
Connecting heat to mechanical energy
Remember
Heat (Q) : Energy transfer due to temperature differences
Work (W): Energy transfer due to acting forces
\Delta T = \frac{Q}{c \ m} \Rightarrow Q = \Delta T \ c \ m
W = F \ d
First Law of Thermodynamics
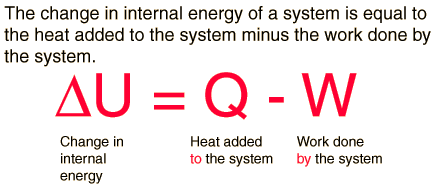
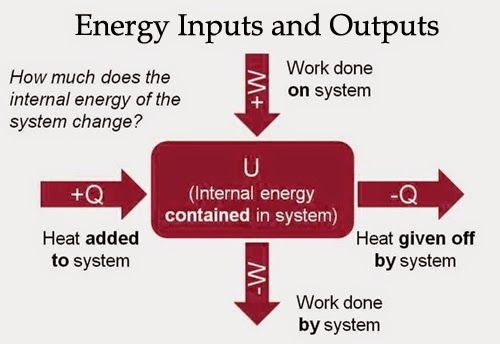
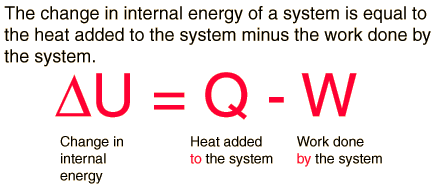
Whenever heat is added to a system, it transforms to an equal amount of some other form of energy
Energy is conserved!
First Law of Thermodynamics
Whenever heat is added to a system, it transforms to an equal amount of some other form of energy
Energy is conserved!
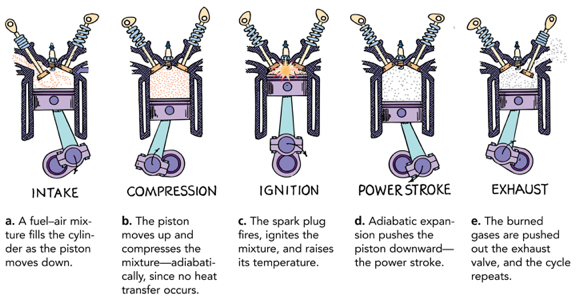
Adiabatic Process
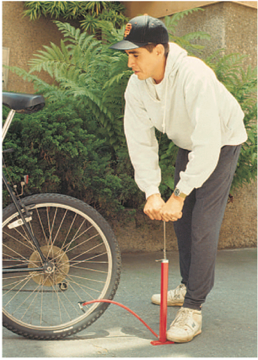
Compressing or expanding a gas while no heat enters or leaves the system is said to be an adiabatic process
Adiabatic Process
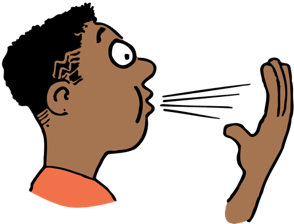
When a gas adiabatically expands, it does work on its surroundings and gives up internal energy, and thus becomes cooler.
Second Law of Thermodynamics
Heat of itself never flows from a cold object to a hot object
The second law of thermodynamics describes the direction of heat flow in natural processes
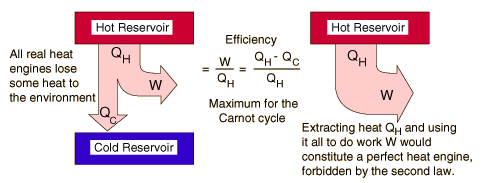
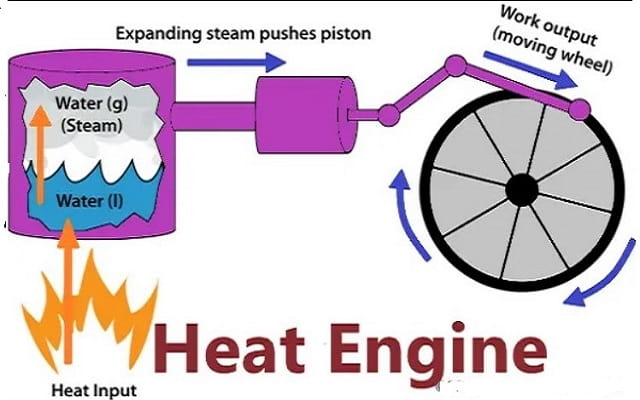
Heat Engine and Second Law
A heat engine is any device that changes internal energy into mechanical work
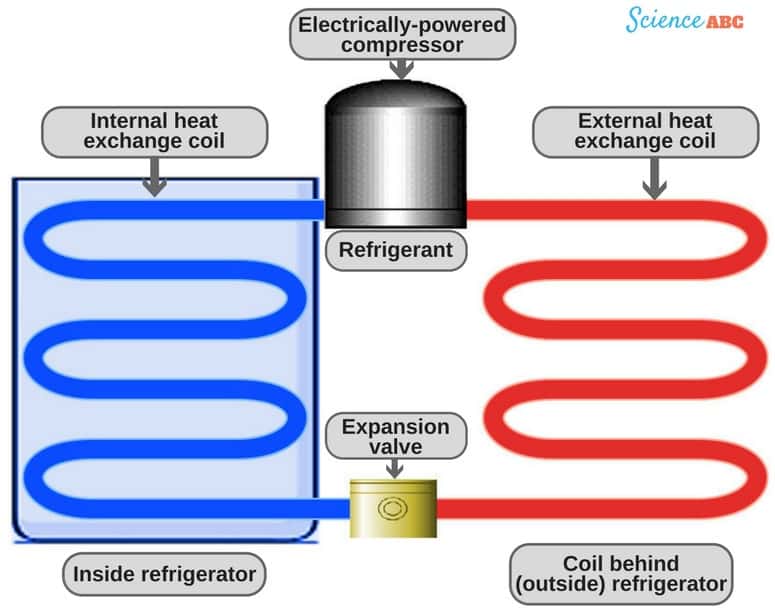
How a Refrigerator Works?
The End
Adiabatic Process
Copy of Change of Phase and Thermodynamics
By Miguel Rocha
Copy of Change of Phase and Thermodynamics
Physics 1 - Week 7 - Chapters 17-18


