


Danielle Navarro
I am a computational cognitive scientist at the University of New South Wales. My research focuses on human concept learning, reasoning and decision making.
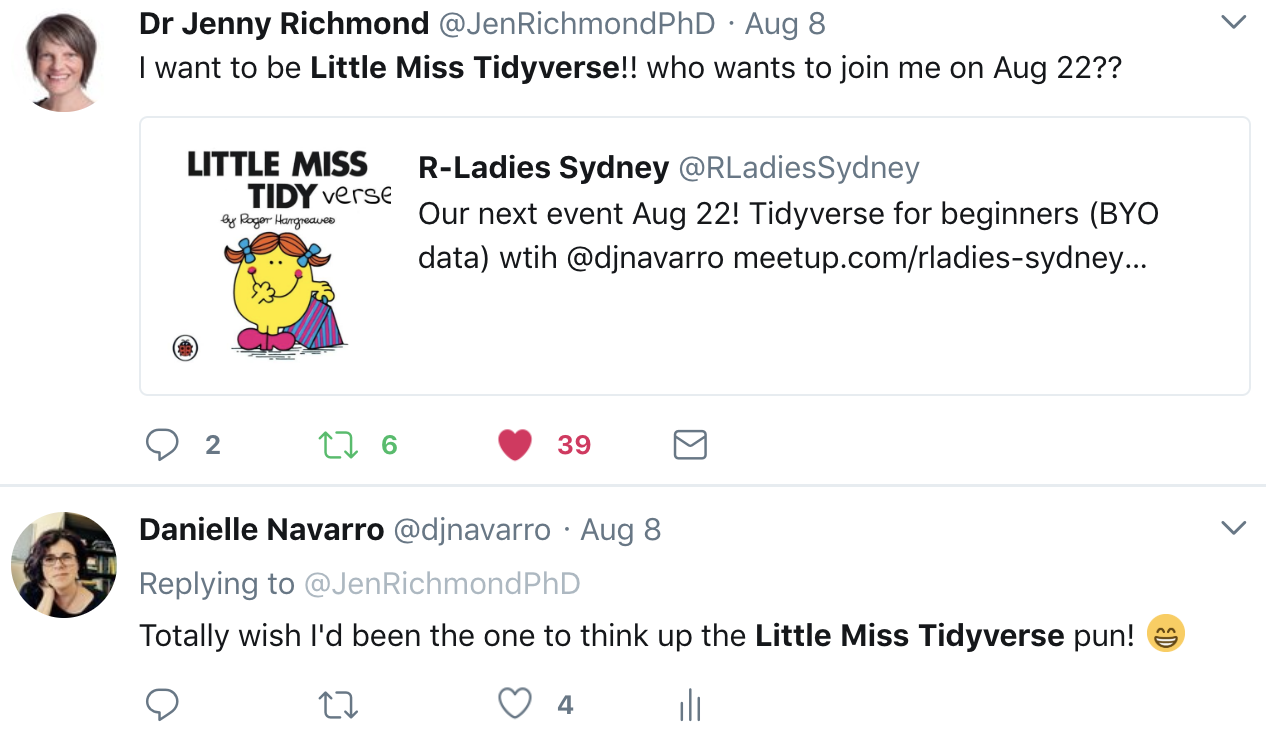
rladiessydney.org/littlemisstidyverse
Danielle Navarro (@djnavarro)
github.com/rladiessydney/littlemisstidyverse
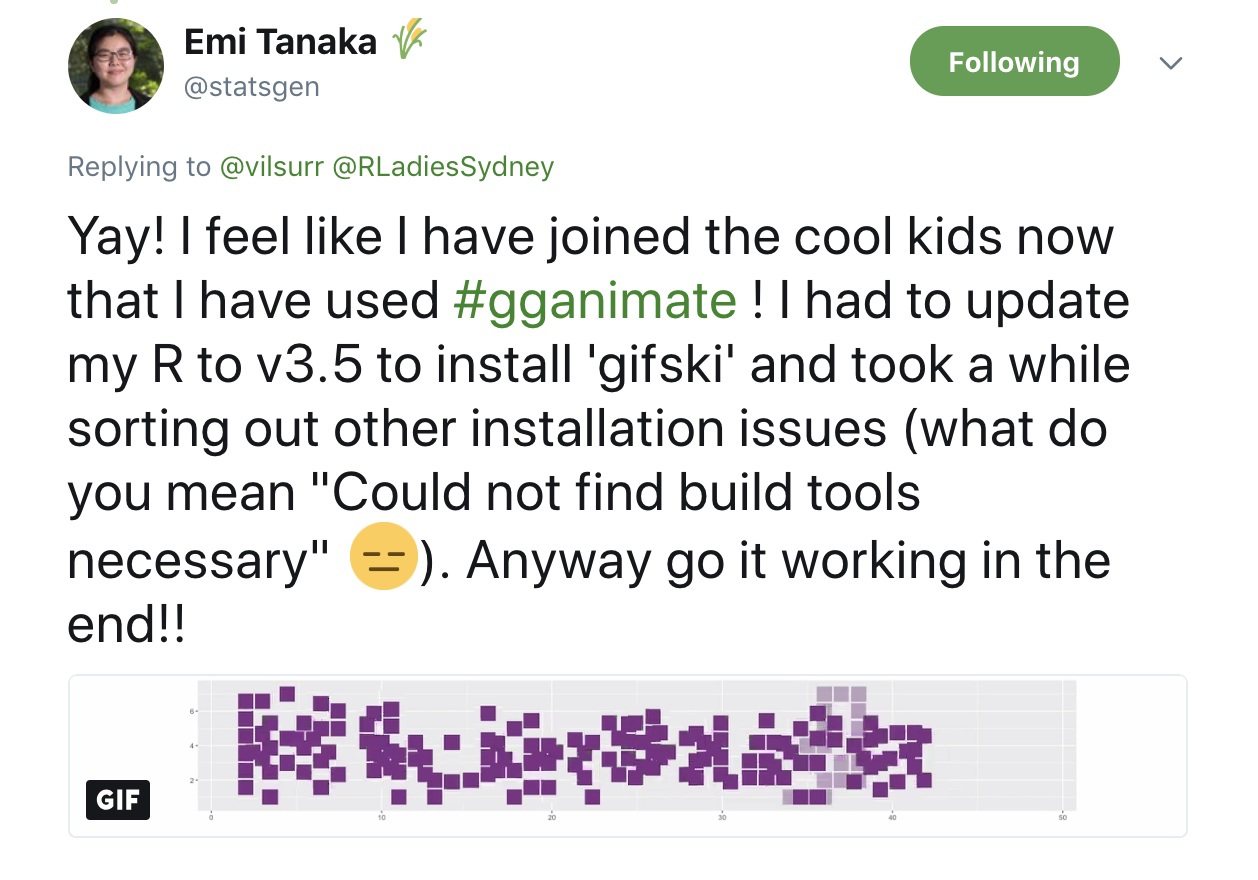
https://gist.github.com/emitanaka/ef1d1b6ade5e57acc4734bc4bfbcc0cd
https://github.com/djnavarro/skyliner/blame/master/skyliner.R
www.bigblocksingsong.com
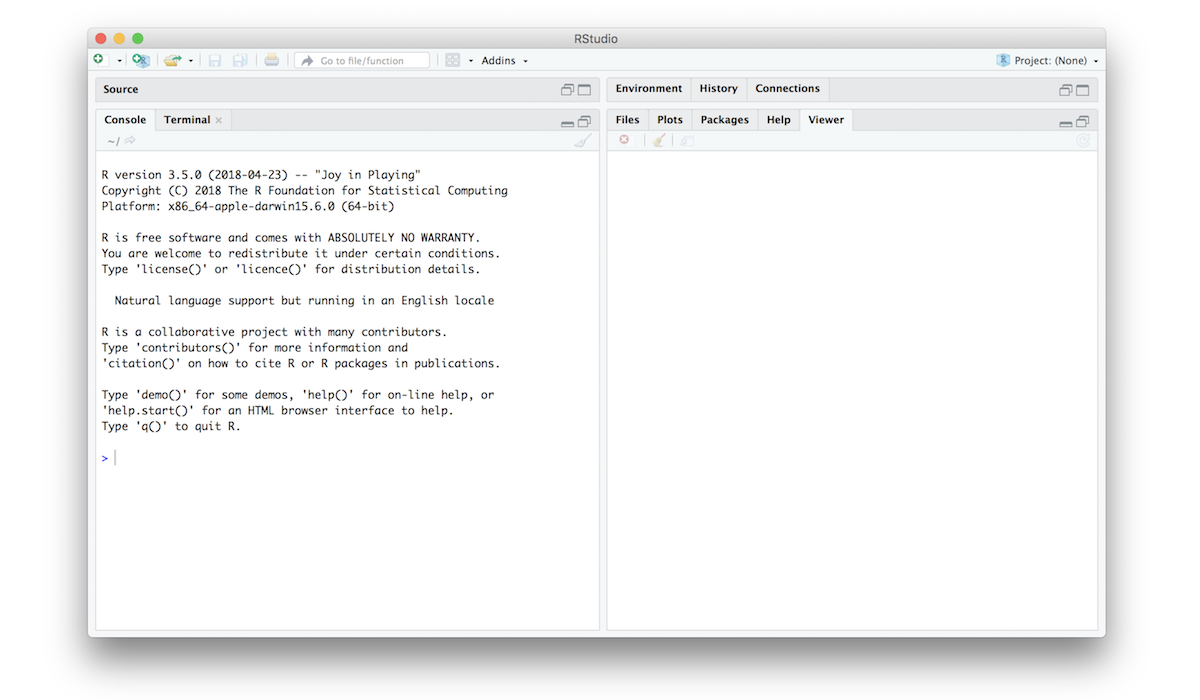
R & RStudio
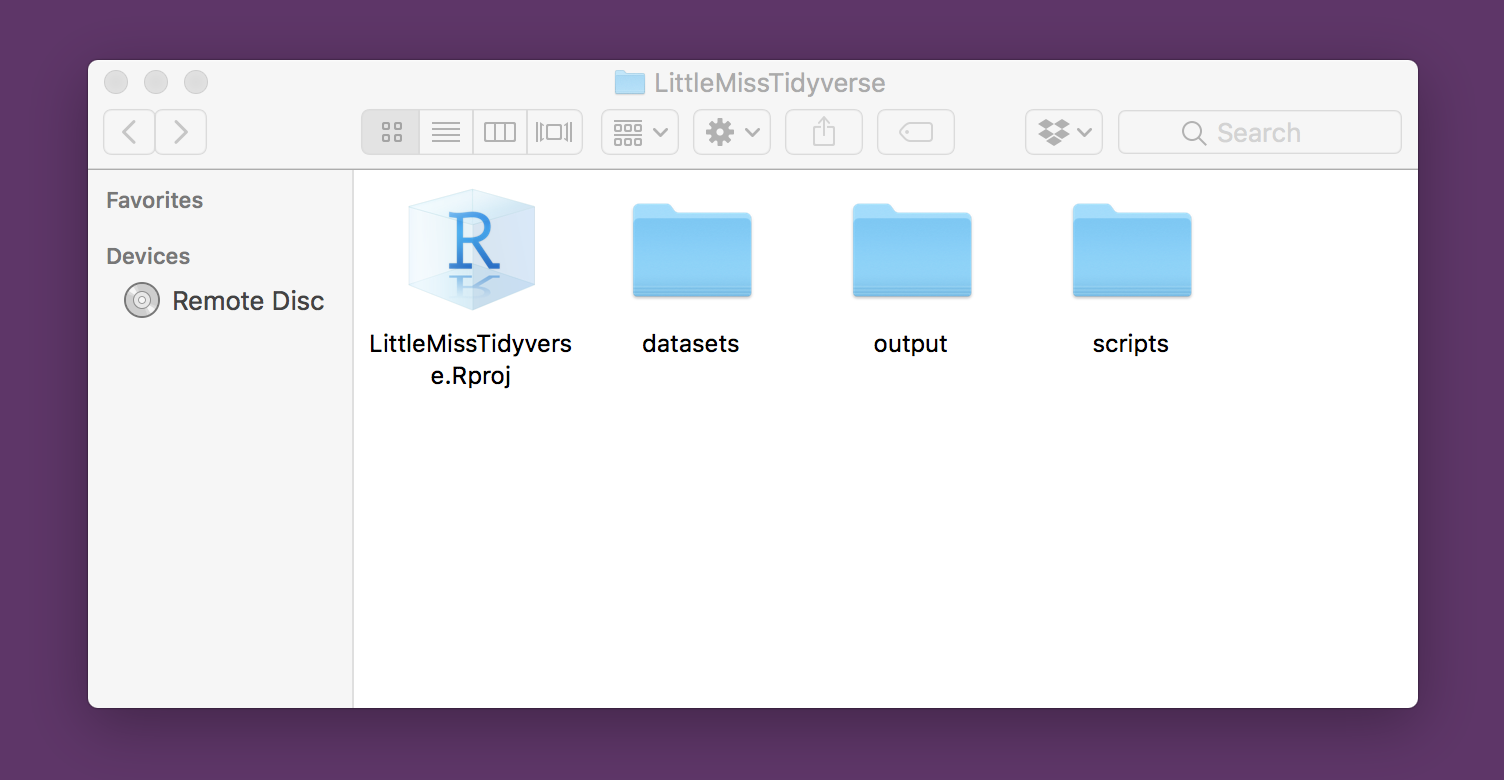
Starting the tutorial
Get tidyverse
Load & inspect data
Simple visualisation
The pipe
Group & summarise
Arrange, filter, select
Mutate data
More visualisation
Gather & spread
R Markdown
Other topics?
r-project.org
www.rstudio.com
R & RStudio
Starting the tutorial
Get tidyverse
Load & inspect data
Simple visualisation
The pipe
Group & summarise
Arrange, filter, select
Mutate data
More visualisation
Gather & spread
R Markdown
Other topics?
R & RStudio
Starting the tutorial
Get tidyverse
Load & inspect data
Simple visualisation
The pipe
Group & summarise
Arrange, filter, select
Mutate data
More visualisation
Gather & spread
R Markdown
Other topics?
script1.R
R & RStudio
Starting the tutorial
Get tidyverse
Load & inspect data
Simple visualisation
The pipe
Group & summarise
Arrange, filter, select
Mutate data
More visualisation
Gather & spread
R Markdown
Other topics?
# Script1.R has a quick orientation for
# complete newcomers:
#
#   - Comment symbol is #, R skips comments
#   - Variables are created using <-

my_age <- 40

#   - When you "source" the script the
#     command above executes invisibly
#   - To get results to "print" to the
#     console, do this:

print(my_age / 10)
R & RStudio
Starting the tutorial
Get tidyverse
Load & inspect data
Simple visualisation
The pipe
Group & summarise
Arrange, filter, select
Mutate data
More visualisation
Gather & spread
R Markdown
Other topics?
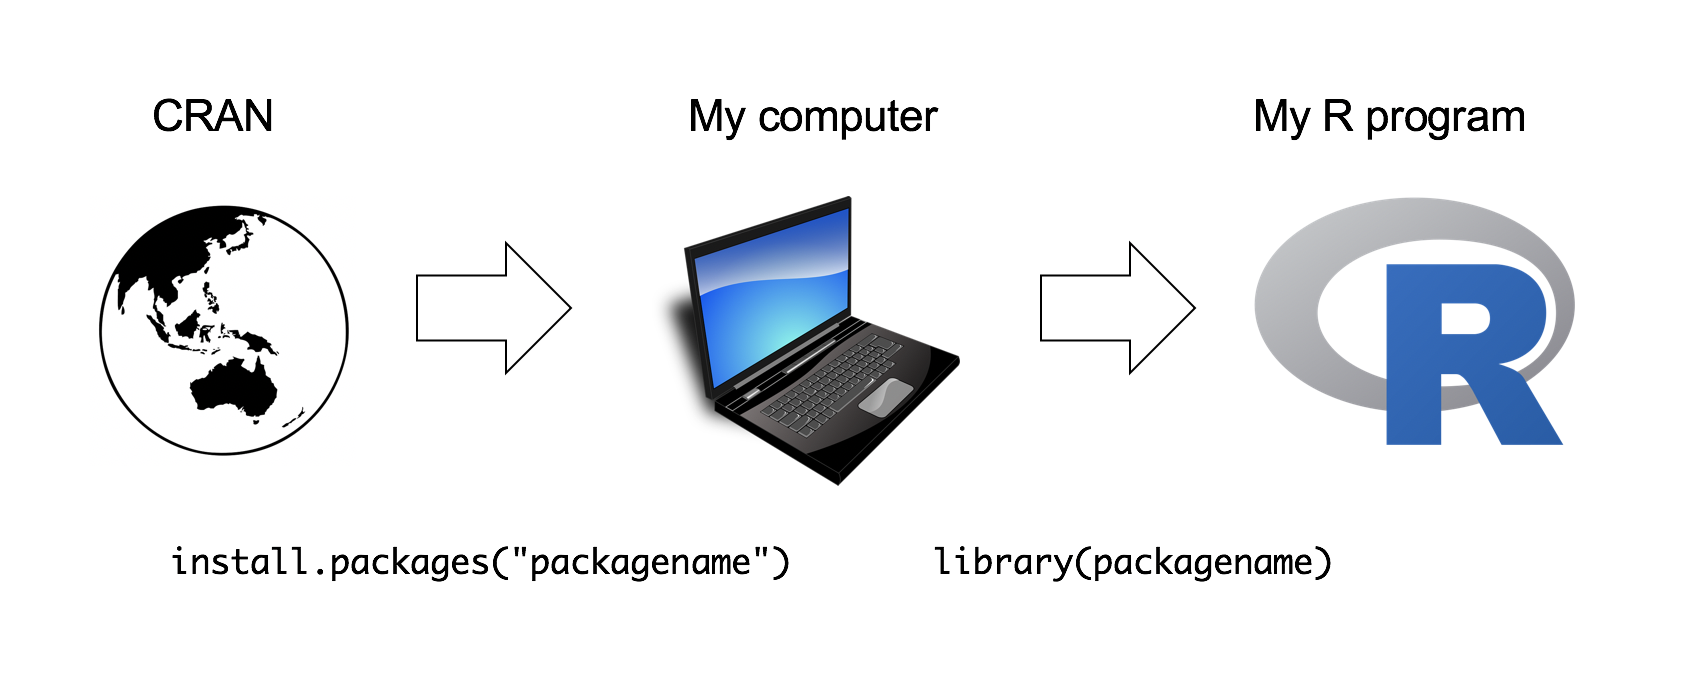
install.packages("tidyverse")script2.R
library(tidyverse)R & RStudio
Starting the tutorial
Get tidyverse
Load & inspect data
Simple visualisation
The pipe
Group & summarise
Arrange, filter, select
Mutate data
More visualisation
Gather & spread
R Markdown
Other topics?
# Script2.R installs & loads tidyverse.
# Just to check... it draws a picture!
R & RStudio
Starting the tutorial
Get tidyverse
Load & inspect data
Simple visualisation
The pipe
Group & summarise
Arrange, filter, select
Mutate data
More visualisation
Gather & spread
R Markdown
Other topics?
script2.R
# If you see this, it is working!script3.R
R & RStudio
Starting the tutorial
Get tidyverse
Load & inspect data
Simple visualisation
The pipe
Group & summarise
Arrange, filter, select
Mutate data
More visualisation
Gather & spread
R Markdown
Other topics?
my_data %>%
   do_this_thing() %>%
   now_do_that_thing() %>%
and_one_more()R & RStudio
Starting the tutorial
Get tidyverse
Load & inspect data
Simple visualisation
The pipe
Group & summarise
Arrange, filter, select
Mutate data
More visualisation
Gather & spread
R Markdown
Other topics?
the_result <- my_data %>%
   do_this_thing() %>%
   now_do_that_thing() %>%
and_one_more()R & RStudio
Starting the tutorial
Get tidyverse
Load & inspect data
Simple visualisation
The pipe
Group & summarise
Arrange, filter, select
Mutate data
More visualisation
Gather & spread
R Markdown
Other topics?
the_summary <- my_data %>%
   group_by(GROUP) %>%
   summarise(
    mean_var = mean(OUTCOME)
   )

print(the_summary)
R & RStudio
Starting the tutorial
Get tidyverse
Load & inspect data
Simple visualisation
The pipe
Group & summarise
Arrange, filter, select
Mutate data
More visualisation
Gather & spread
R Markdown
Other topics?
script4.R
script5.R
R & RStudio
Starting the tutorial
Get tidyverse
Load & inspect data
Simple visualisation
The pipe
Group & summarise
Arrange, filter, select
Mutate data
More visualisation
Gather & spread
R Markdown
Other topics?
Additional columns?
R & RStudio
Starting the tutorial
Get tidyverse
Load & inspect data
Simple visualisation
The pipe
Group & summarise
Arrange, filter, select
Mutate data
More visualisation
Gather & spread
R Markdown
Other topics?
the_summary <- my_data %>%
   group_by(GROUP) %>%
   summarise(
    median = median(VARIABLE),
    mean = mean(VARIABLE),
    std_dev = sd(VARIABLE)
   )

print(the_summary)(just FYI)
the_summary <- my_data %>%
   group_by(GROUP) %>%
   summarise(
    median = median(VARIABLE, na.rm = TRUE),
    mean = mean(VARIABLE, na.rm = TRUE),
    std_dev = sd(VARIABLE, na.rm = TRUE)
   )

print(the_summary)Handling missing data?
R & RStudio
Starting the tutorial
Get tidyverse
Load & inspect data
Simple visualisation
The pipe
Group & summarise
Arrange, filter, select
Mutate data
More visualisation
Gather & spread
R Markdown
Other topics?
(just FYI)
my_data %>%
  group_by(variable) %>%
  summarise(count = n())
my_data %>%
group_by(variable1, variable2) %>%
summarise(count = n())Frequency tables?
R & RStudio
Starting the tutorial
Get tidyverse
Load & inspect data
Simple visualisation
The pipe
Group & summarise
Arrange, filter, select
Mutate data
More visualisation
Gather & spread
R Markdown
Other topics?
(just FYI)
result <- data %>%
   group_by(GROUP) %>%
   summarise(mean_var = mean(OUTCOME))
data <- read_csv(PATH_TO_FILE)
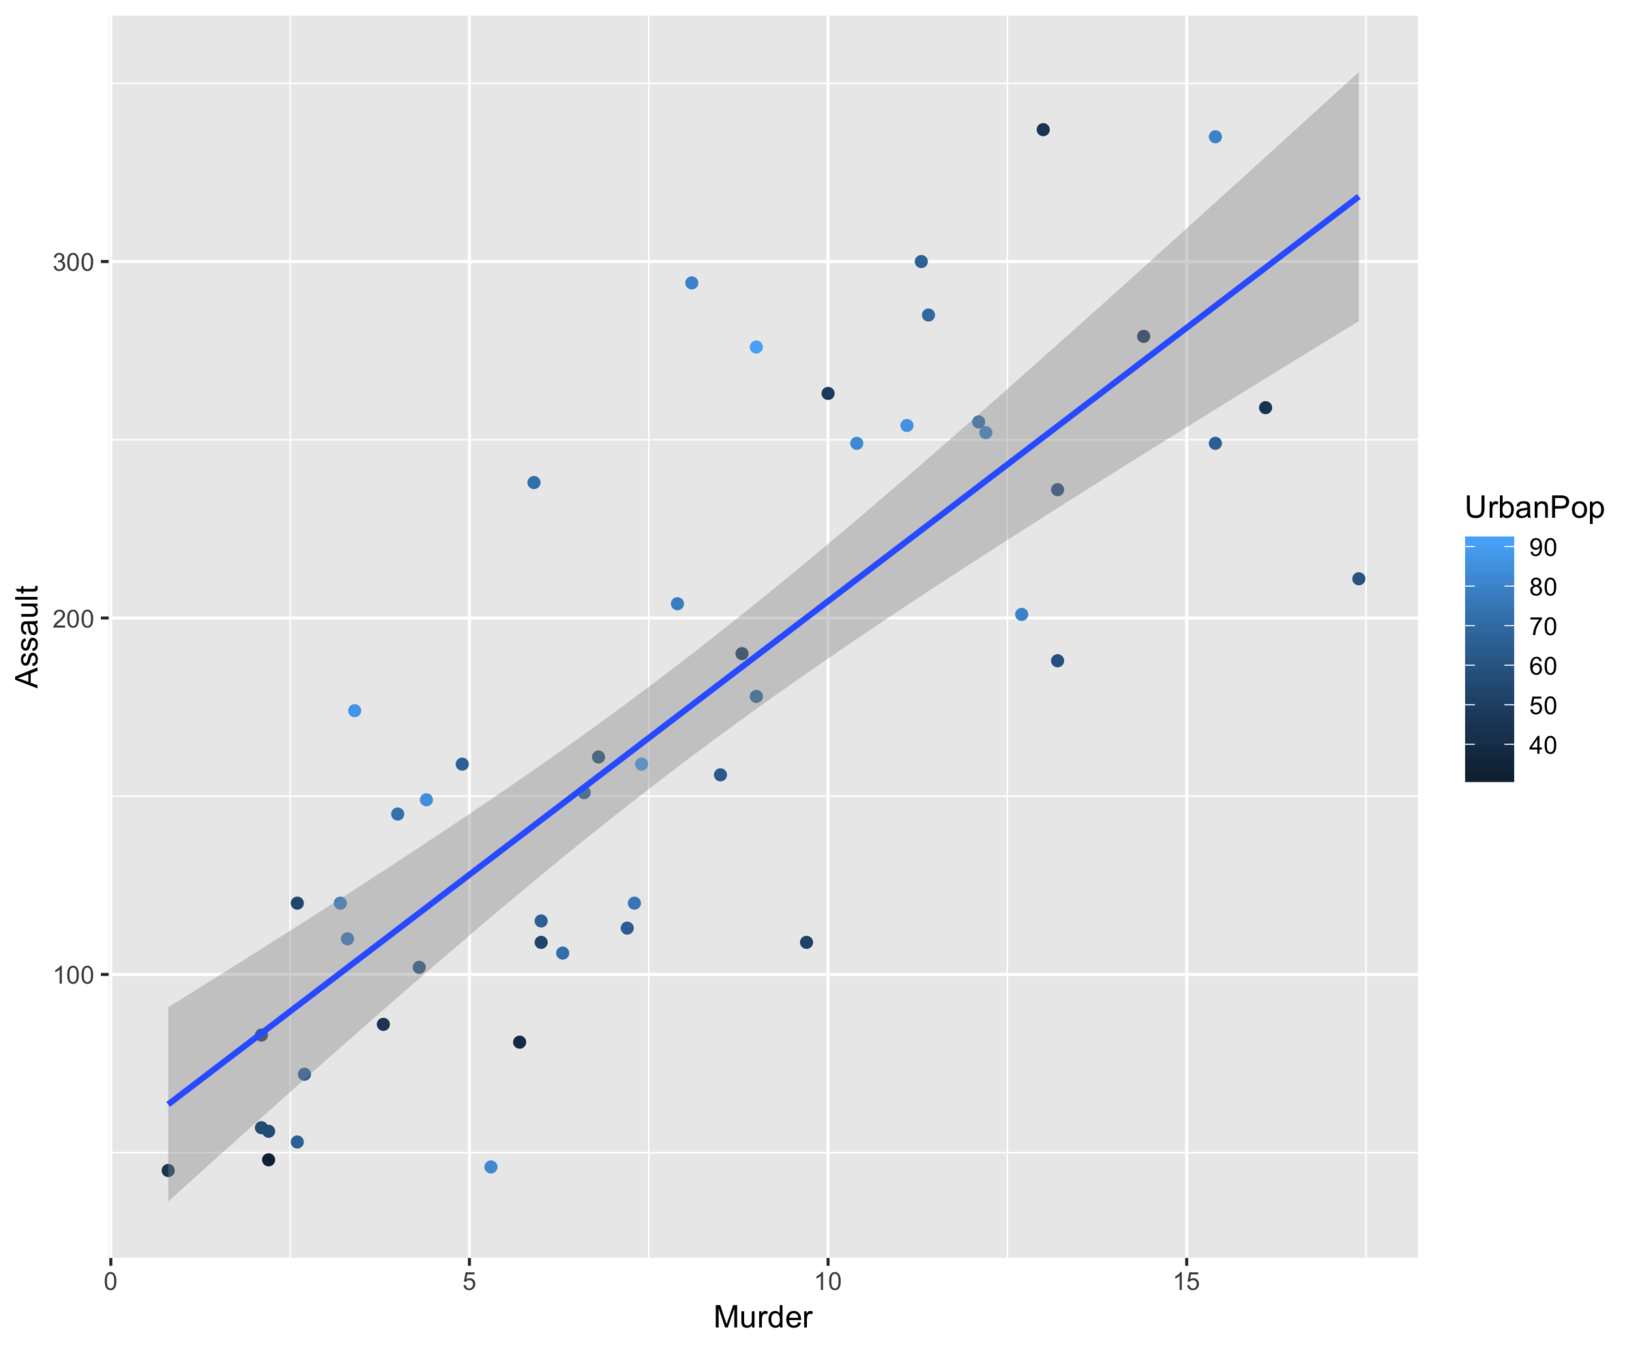
library(tidyverse)picture <- my_data %>%
ggplot(aes(x=XVAR, y=YVAR)) +
geom_point() +
geom_smooth()(1)
(2)
(3)
(4)
R & RStudio
Starting the tutorial
Get tidyverse
Load & inspect data
Simple visualisation
The pipe
Group & summarise
Arrange, filter, select
Mutate data
More visualisation
Gather & spread
R Markdown
Other topics?
# for ascending order
my_data %>% arrange(VARIABLE)
R & RStudio
Starting the tutorial
Get tidyverse
Load & inspect data
Simple visualisation
The pipe
Group & summarise
Arrange, filter, select
Mutate data
More visualisation
Gather & spread
R Markdown
Other topics?
# for descending order:
my_data %>% arrange(-VARIABLE)
my_data %>% arrange(desc(VARIABLE))

# to sort by one variable then another
my_data %>% arrange(VARIABLE1, VARIABLE2)
my_data %>%
filter(a_logical_expression)# data from the women
my_data %>%
filter(gender == "female")
R & RStudio
Starting the tutorial
Get tidyverse
Load & inspect data
Simple visualisation
The pipe
Group & summarise
Arrange, filter, select
Mutate data
More visualisation
Gather & spread
R Markdown
Other topics?
# data from women over 50
my_data %>%
    filter(gender == "female" & age >= 50)
# keeps all rows, but only retain the
# columns for VARIABLE1 and VARIABLE2
my_data %>%
select(VARIABLE1, VARIABLE2)R & RStudio
Starting the tutorial
Get tidyverse
Load & inspect data
Simple visualisation
The pipe
Group & summarise
Arrange, filter, select
Mutate data
More visualisation
Gather & spread
R Markdown
Other topics?
# reminder: arrange, filter, select DON'T
# change the original data set (my_data).
# instead they return a new one, which you
# can assign to a variable

new_data <- old_data %>%
    filter( SOME ROWS ) %>%
    select( SOME VARIABLES ) %>%
    arrange( BY VARIABLE )
R & RStudio
Starting the tutorial
Get tidyverse
Load & inspect data
Simple visualisation
The pipe
Group & summarise
Arrange, filter, select
Mutate data
More visualisation
Gather & spread
R Markdown
Other topics?
# reminder: arrange, filter, select DON'T
# change the original data set (my_data).
# instead they return a new one, which you
# can assign to a variable

new_data <- old_data %>%
    filter( SOME ROWS ) %>%
    select( SOME VARIABLES ) %>%
    arrange( BY VARIABLE )
# here's how you alter the original:
my_data <- my_data %>%
filter( SOME ROWS ) %>%
select( SOME VARIABLES ) %>%
arrange( BY VARIABLE )script6.R
script7.R
R & RStudio
Starting the tutorial
Get tidyverse
Load & inspect data
Simple visualisation
The pipe
Group & summarise
Arrange, filter, select
Mutate data
More visualisation
Gather & spread
R Markdown
Other topics?
# typical use case: create new variables
# within the ORIGINAL data set:

my_data <- my_data %>%
    mutate(variable = expression)
# e.g.: create a log-transformed variable
my_data <- my_data %>%
mutate(log_RT = log(rt))
R & RStudio
Starting the tutorial
Get tidyverse
Load & inspect data
Simple visualisation
The pipe
Group & summarise
Arrange, filter, select
Mutate data
More visualisation
Gather & spread
R Markdown
Other topics?
script8.R
R & RStudio
Starting the tutorial
Get tidyverse
Load & inspect data
Simple visualisation
The pipe
Group & summarise
Arrange, filter, select
Mutate data
More visualisation
Gather & spread
R Markdown
Other topics?
R & RStudio
Starting the tutorial
Get tidyverse
Load & inspect data
Simple visualisation
The pipe
Group & summarise
Arrange, filter, select
Mutate data
More visualisation
Gather & spread
R Markdown
Other topics?
pic <- my_data %>%
    ggplot(aes(AESTHETICS)) +
    geom_something()

plot(pic)
R & RStudio
Starting the tutorial
Get tidyverse
Load & inspect data
Simple visualisation
The pipe
Group & summarise
Arrange, filter, select
Mutate data
More visualisation
Gather & spread
R Markdown
Other topics?
R & RStudio
Starting the tutorial
Get tidyverse
Load & inspect data
Simple visualisation
The pipe
Group & summarise
Arrange, filter, select
Mutate data
More visualisation
Gather & spread
R Markdown
Other topics?
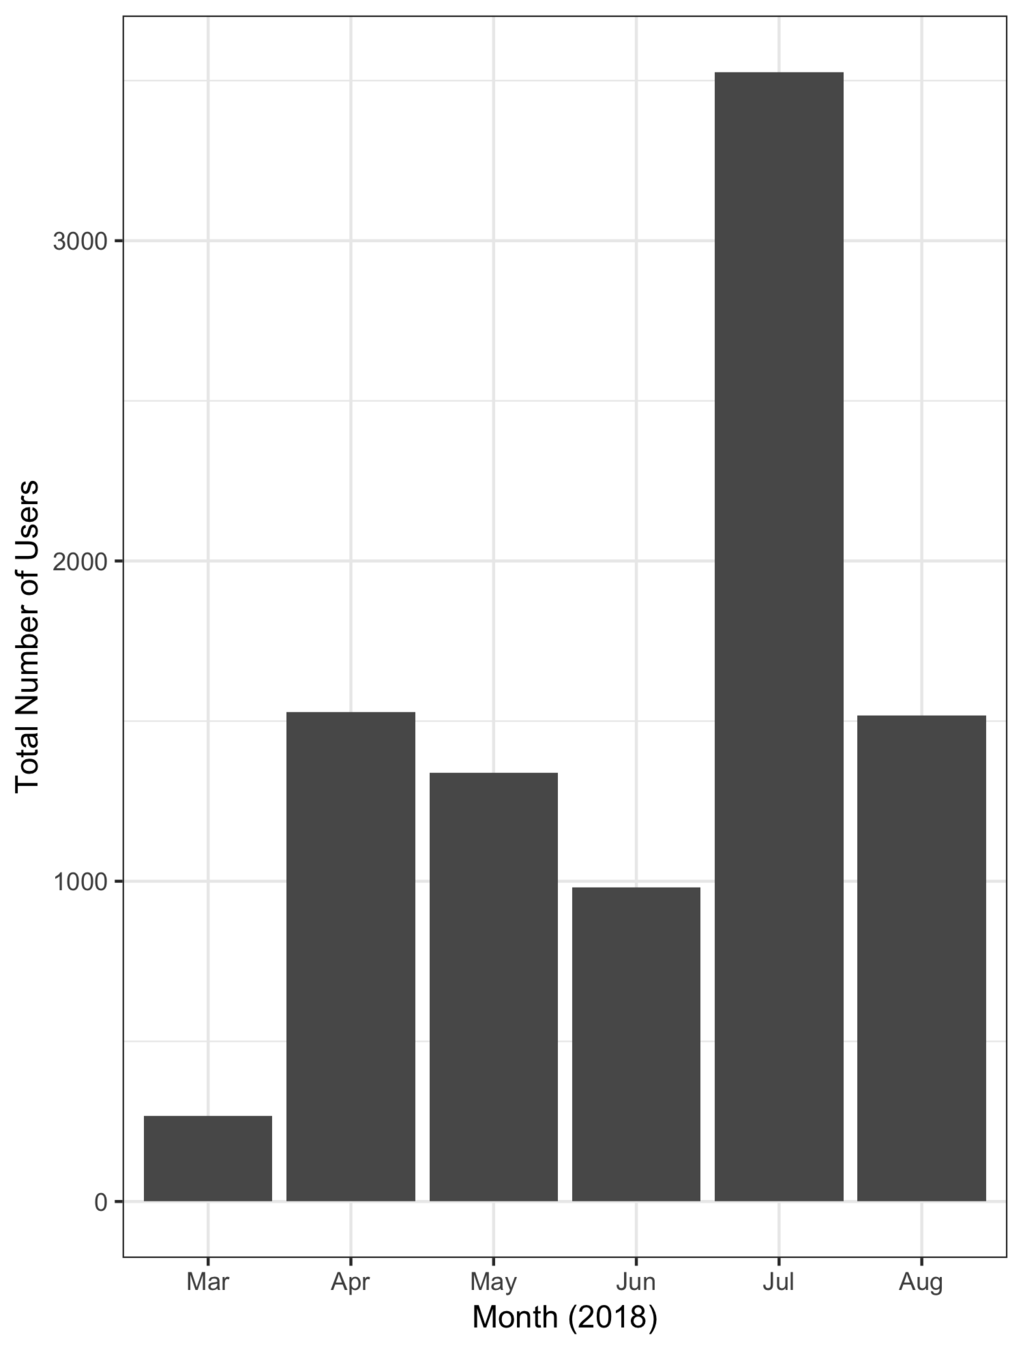
data %>%
  ggplot(aes(  # set up the plot & aesthetics
     x = named_month,
     y = total_users)) +
  geom_col() +                    # add bars
  xlab("Month (2018)") +          # x-axis label
  ylab("Total Number of Users") + # y-axis label
  theme_bw()   # black & white theme
R & RStudio
Starting the tutorial
Get tidyverse
Load & inspect data
Simple visualisation
The pipe
Group & summarise
Arrange, filter, select
Mutate data
More visualisation
Gather & spread
R Markdown
Other topics?
script9.R
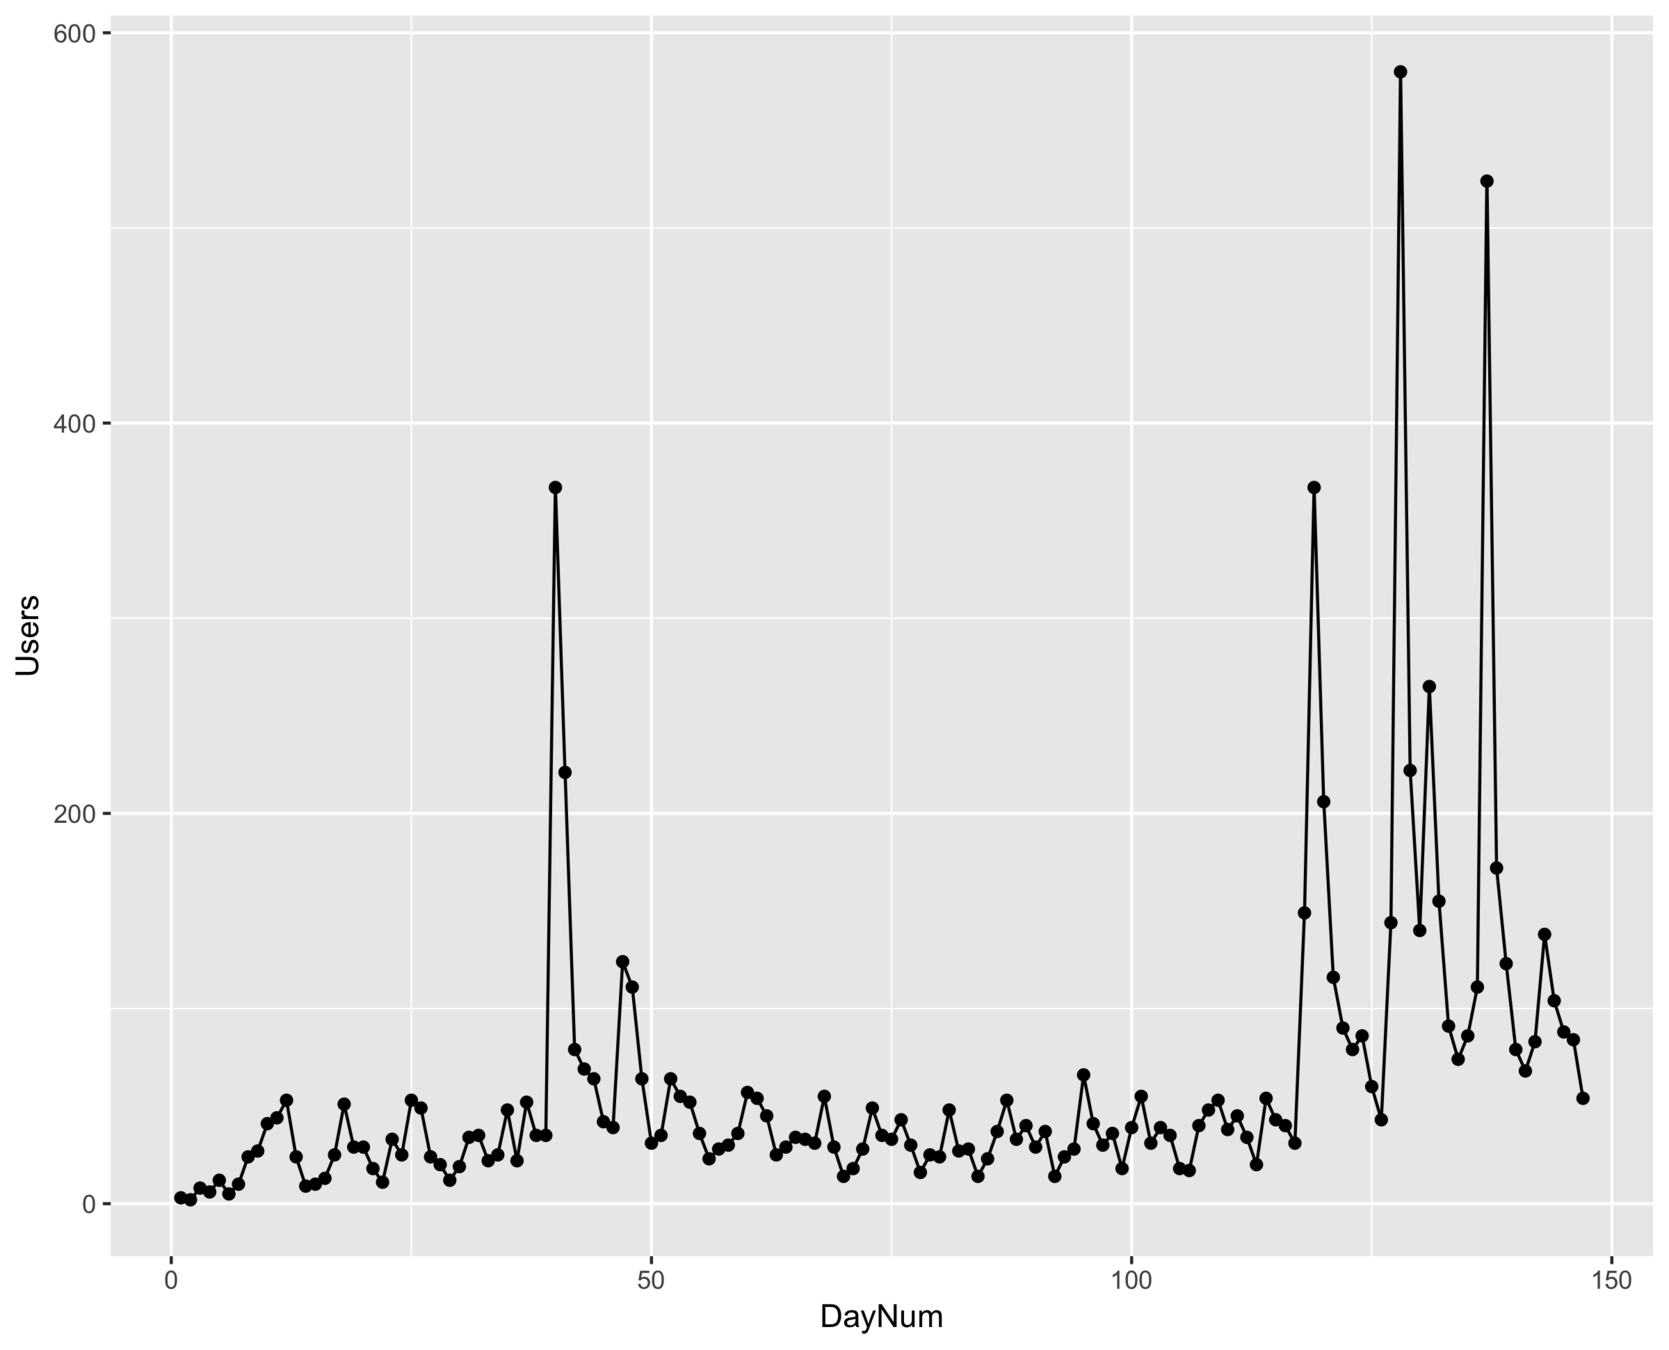
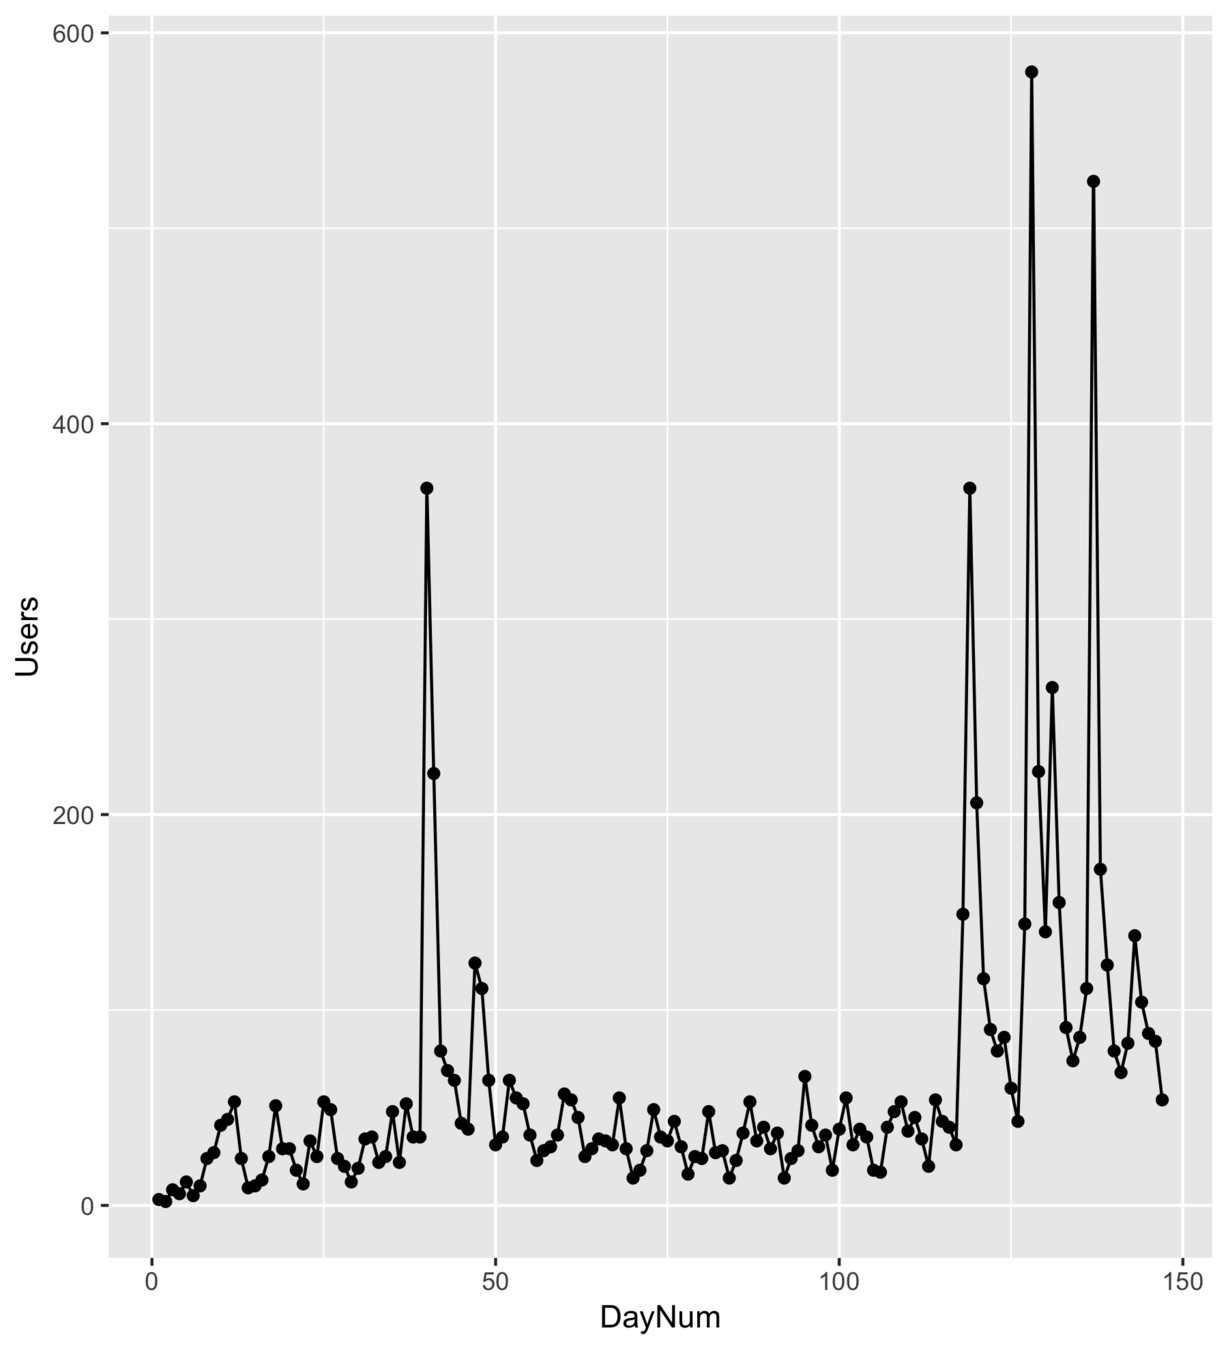
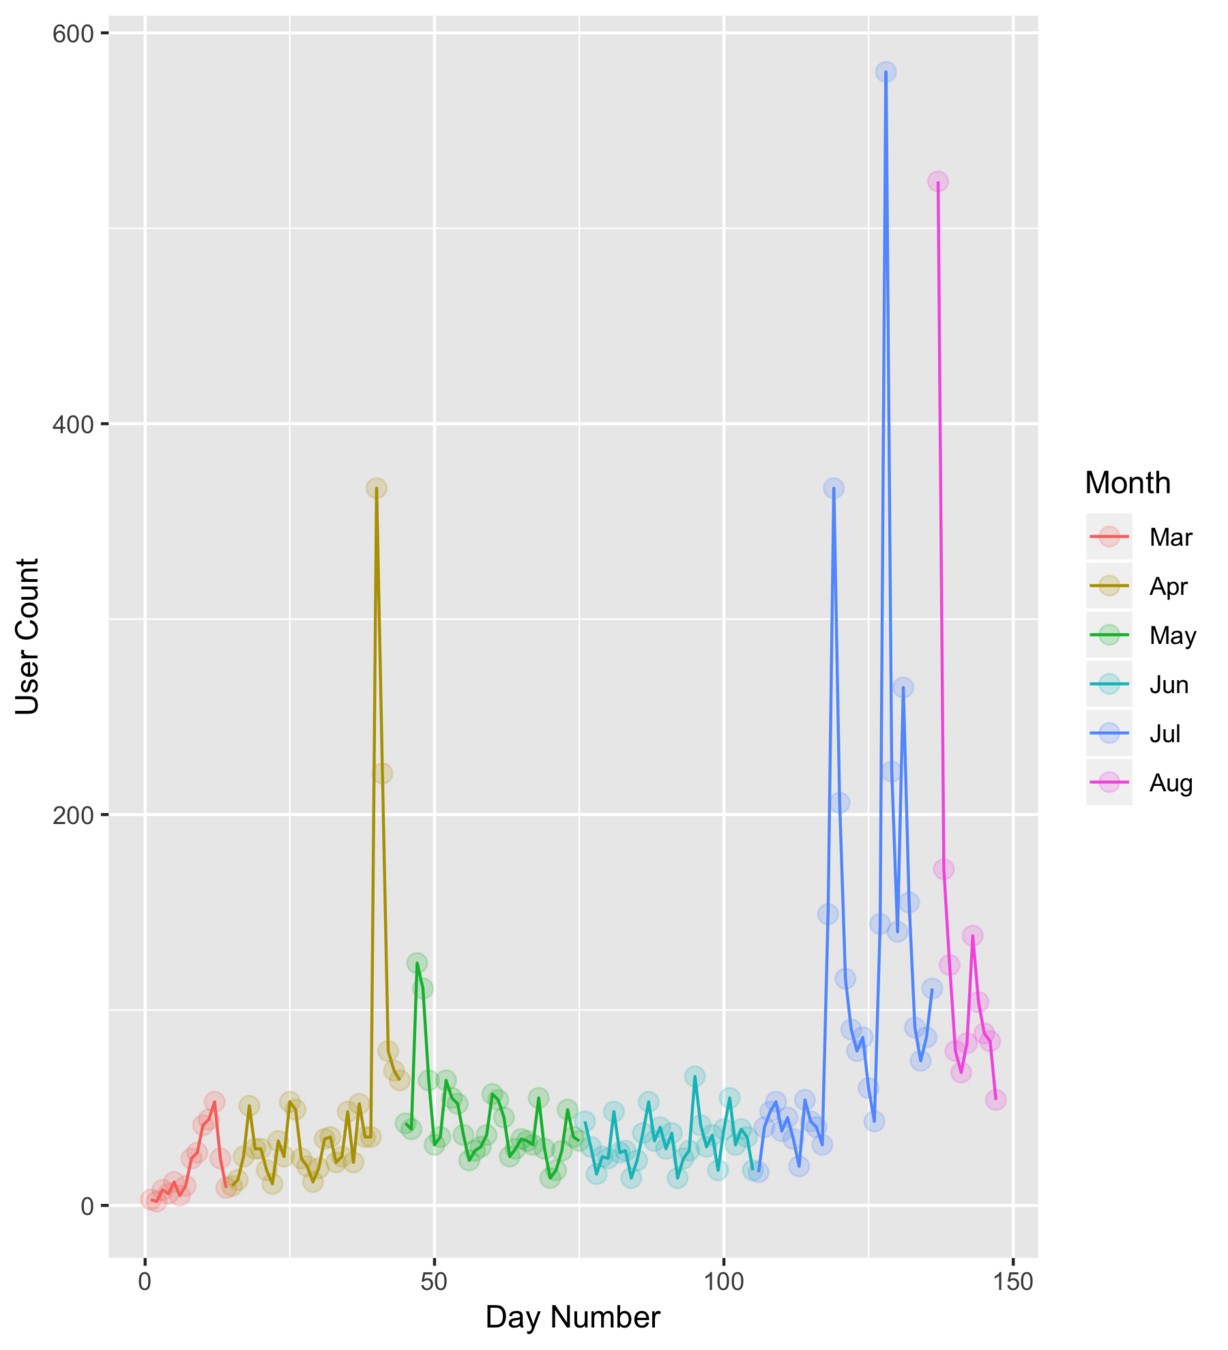
tidy_users %>%
    ggplot(aes(x = DayNum, y = Users)) +
    geom_point() +
    geom_line()
R & RStudio
Starting the tutorial
Get tidyverse
Load & inspect data
Simple visualisation
The pipe
Group & summarise
Arrange, filter, select
Mutate data
More visualisation
Gather & spread
R Markdown
Other topics?
script9.R
# see script 9
# for extra
# customisation
# options...
R & RStudio
Starting the tutorial
Get tidyverse
Load & inspect data
Simple visualisation
The pipe
Group & summarise
Arrange, filter, select
Mutate data
More visualisation
Gather & spread
R Markdown
Other topics?
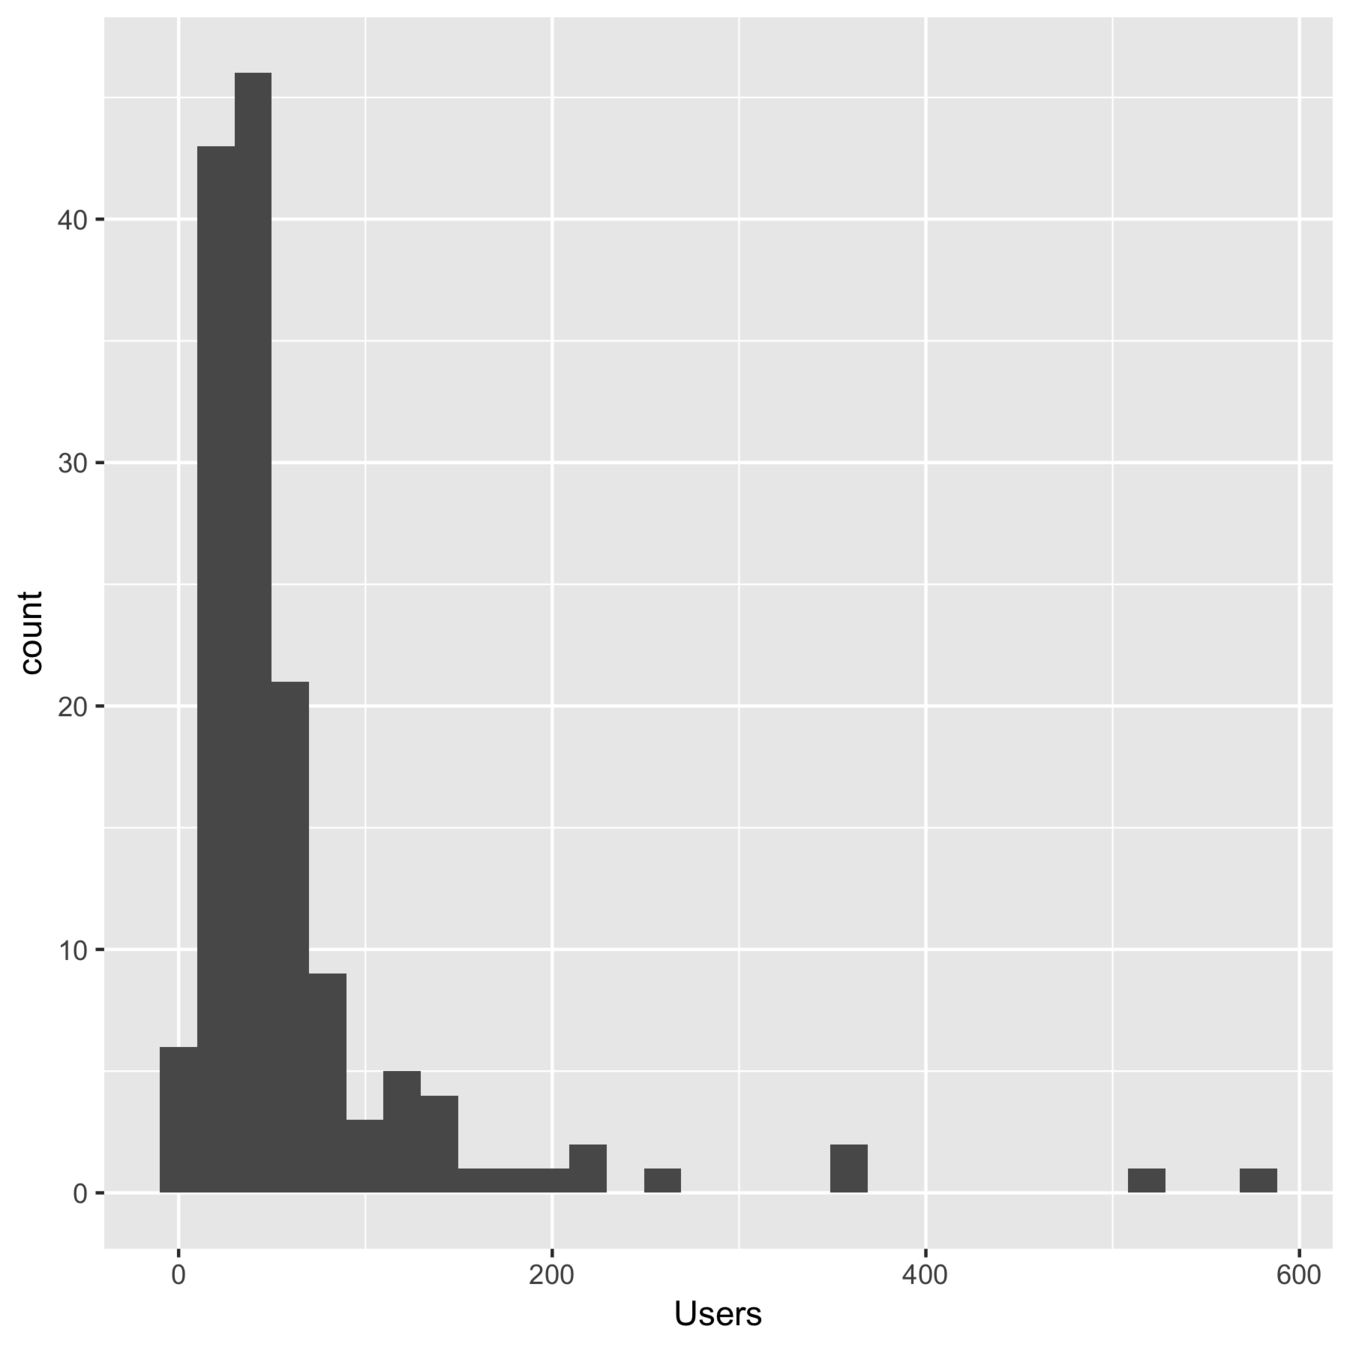
tidy_users %>%
    ggplot(aes(x = Users)) +
    geom_histogram()
R & RStudio
Starting the tutorial
Get tidyverse
Load & inspect data
Simple visualisation
The pipe
Group & summarise
Arrange, filter, select
Mutate data
More visualisation
Gather & spread
R Markdown
Other topics?
# see script 9
# for extra
# customisation
# options...tidy_users %>%
ggplot(aes(
x = MonthName,
y = Users,
colour = MonthName
)) +
geom_boxplot()R & RStudio
Starting the tutorial
Get tidyverse
Load & inspect data
Simple visualisation
The pipe
Group & summarise
Arrange, filter, select
Mutate data
More visualisation
Gather & spread
R Markdown
Other topics?
script9.R
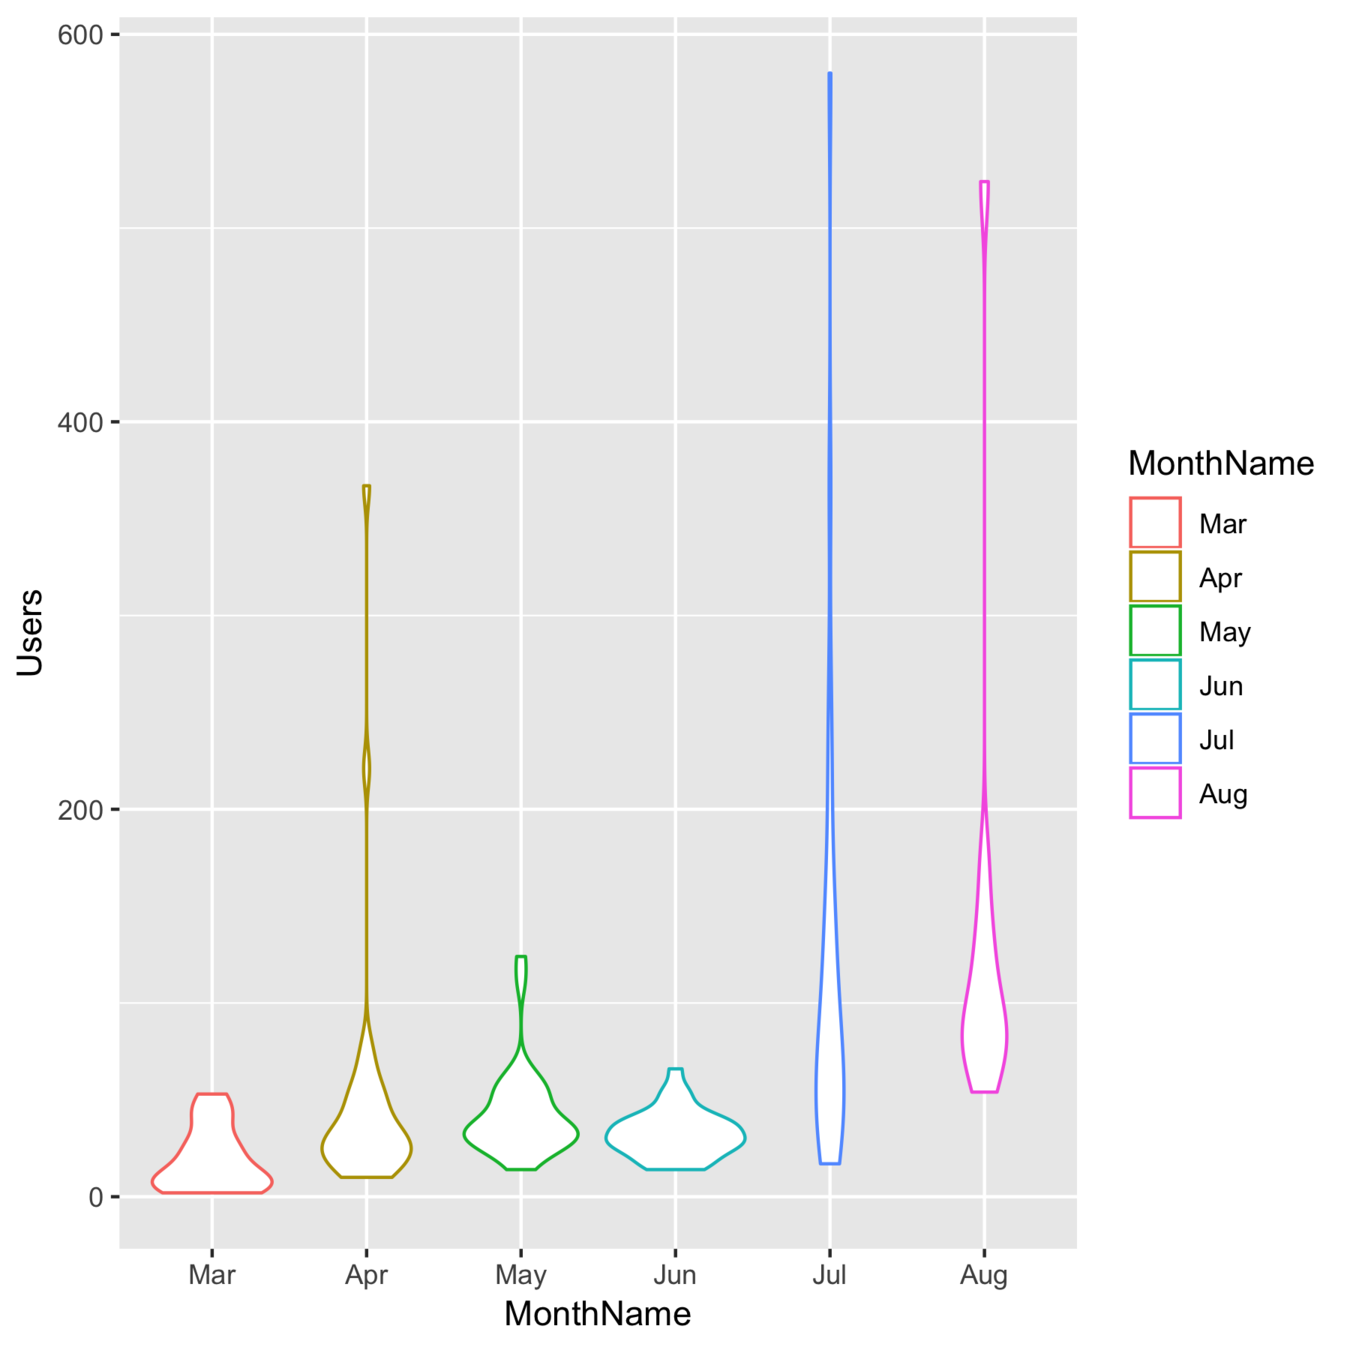
tidy_users %>%
  ggplot(aes(
    x = MonthName,
    y = Users,
    colour = MonthName
  )) +
  geom_violin()
R & RStudio
Starting the tutorial
Get tidyverse
Load & inspect data
Simple visualisation
The pipe
Group & summarise
Arrange, filter, select
Mutate data
More visualisation
Gather & spread
R Markdown
Other topics?
script9.R
R & RStudio
Starting the tutorial
Get tidyverse
Load & inspect data
Simple visualisation
The pipe
Group & summarise
Arrange, filter, select
Mutate data
More visualisation
Gather & spread
R Markdown
Other topics?
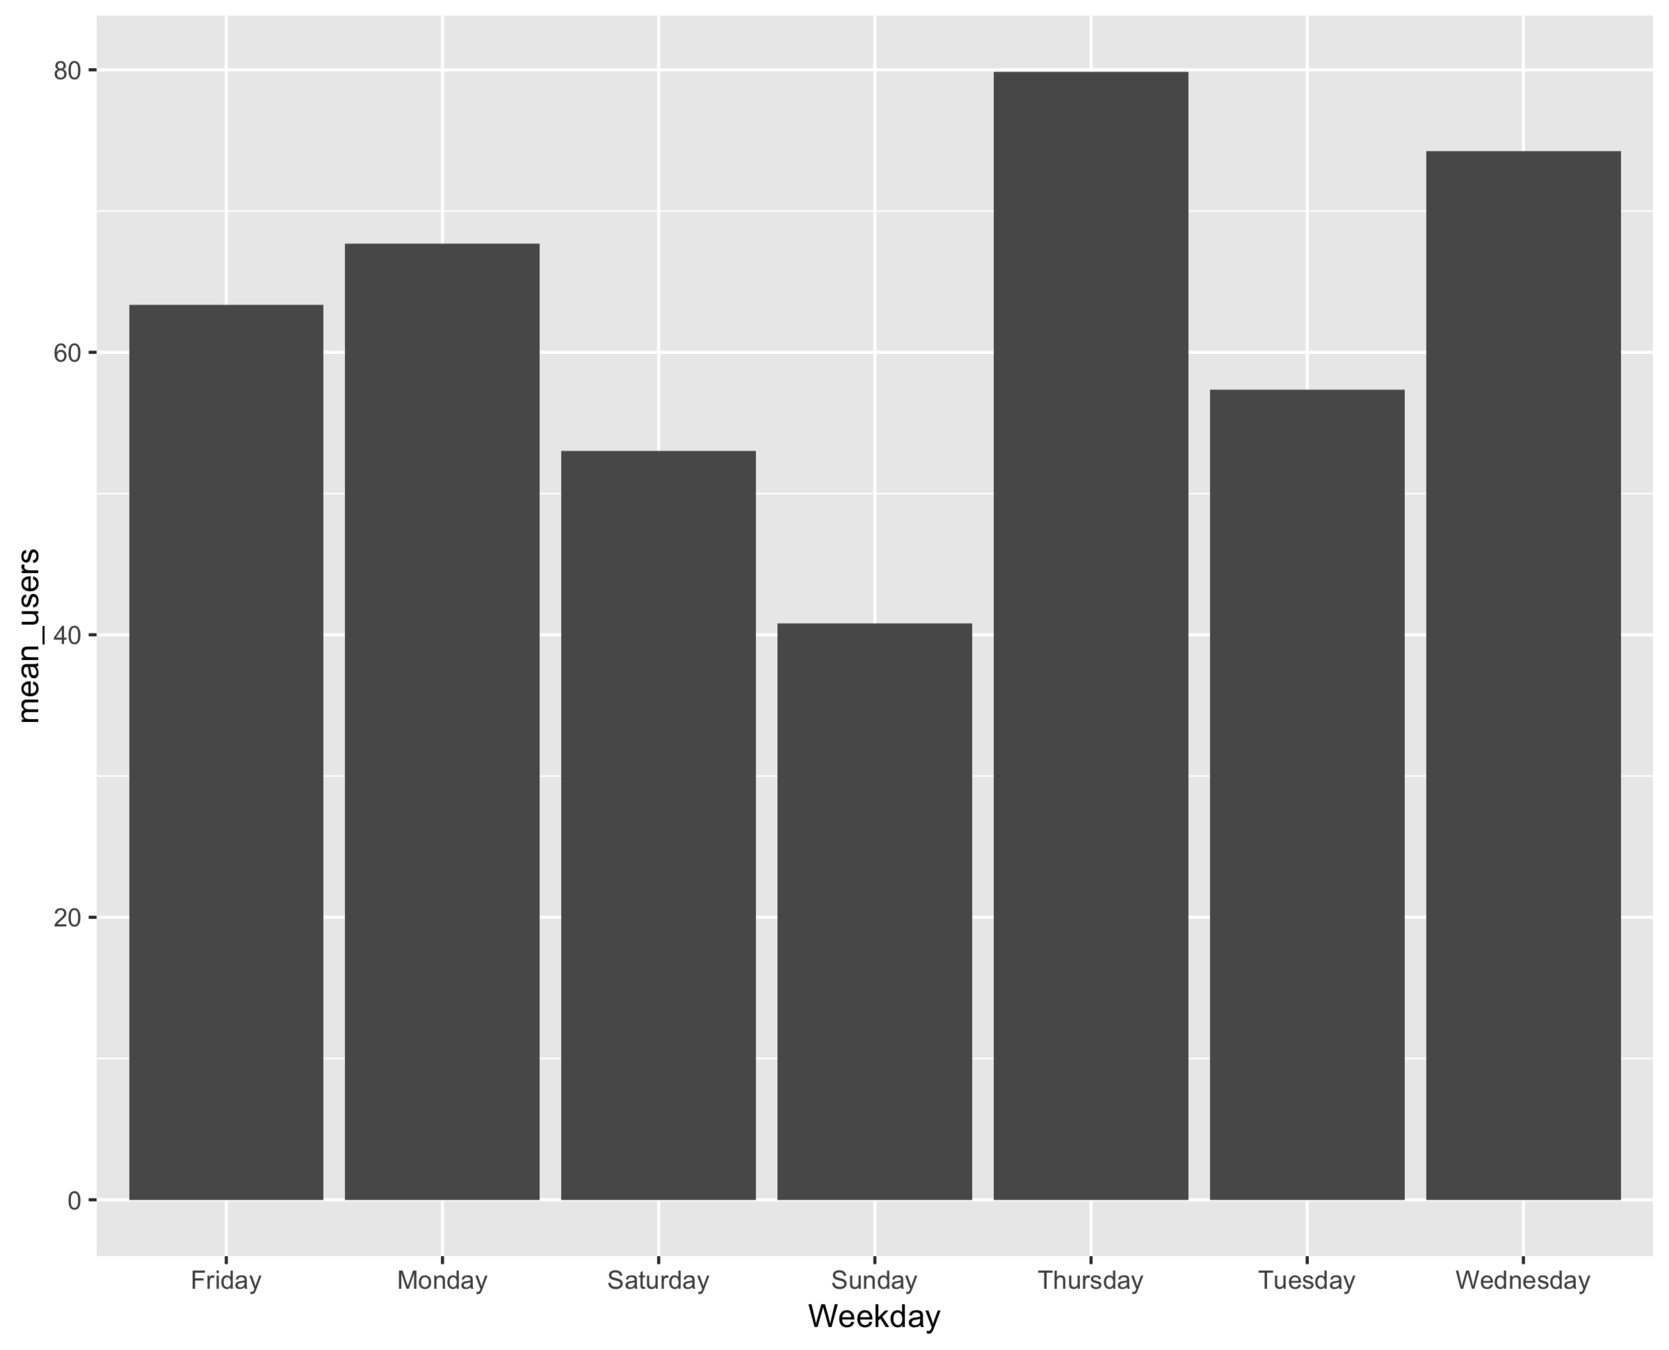
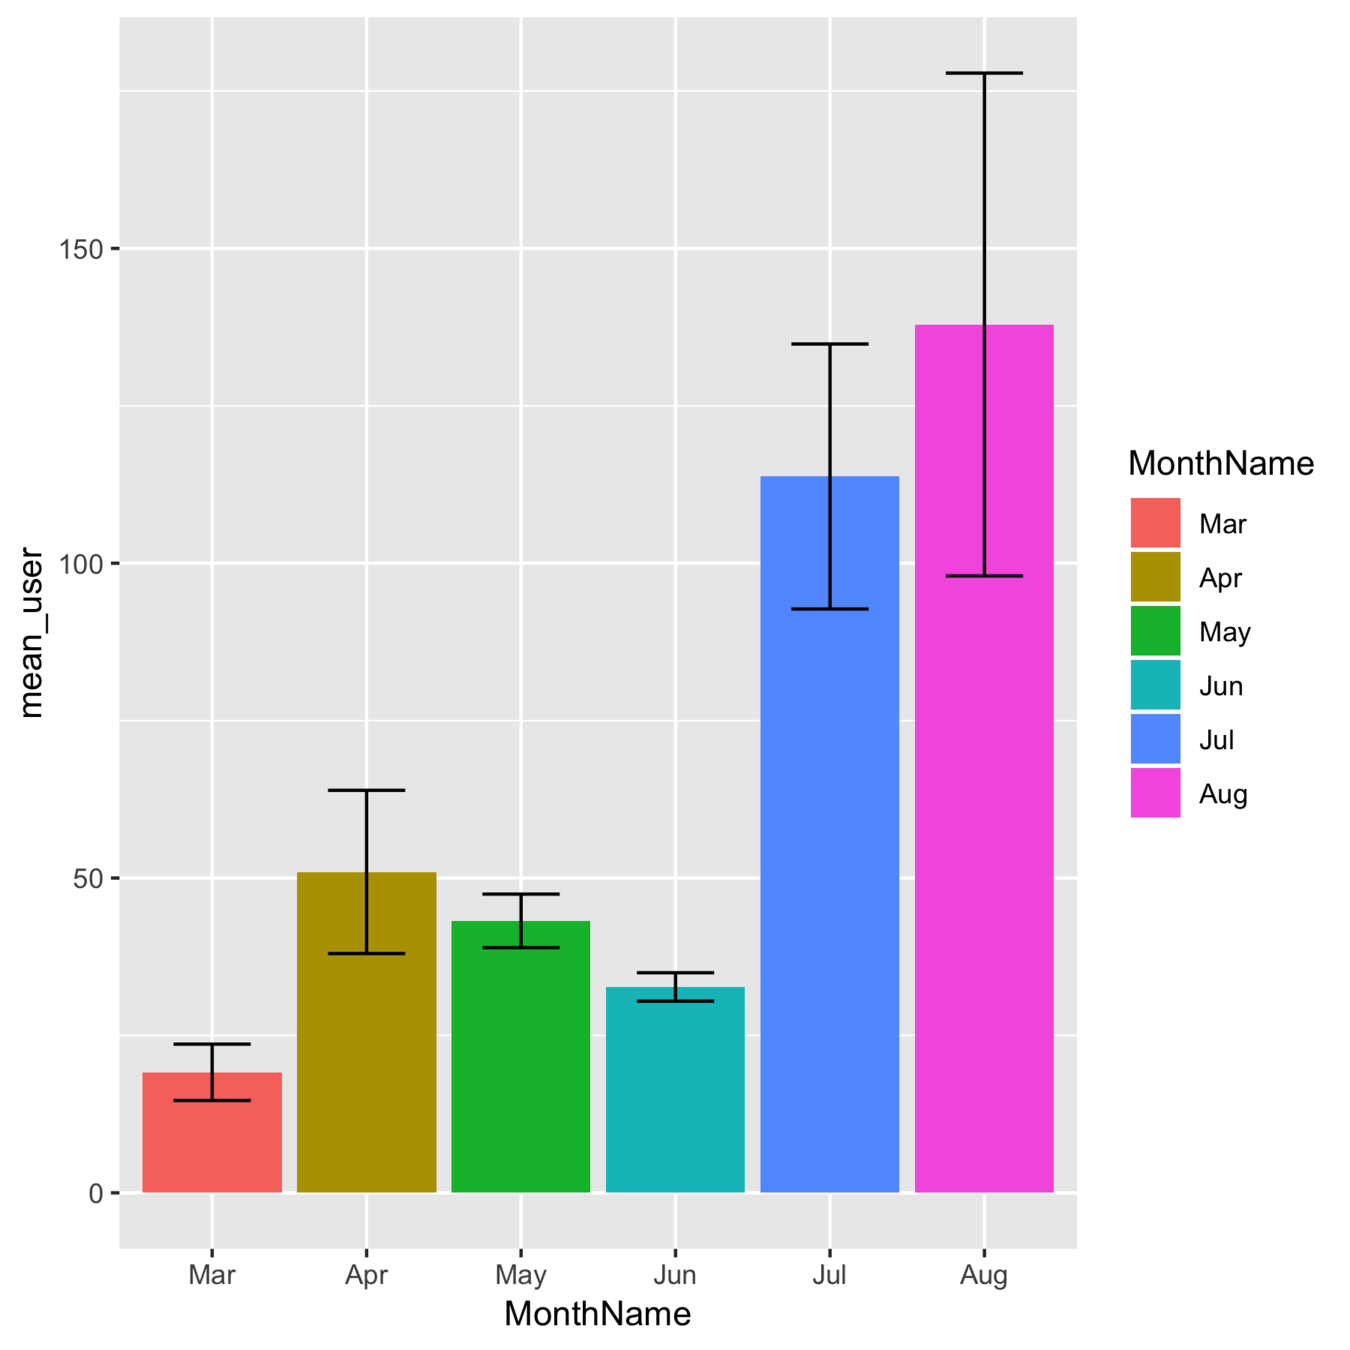
users_summary <- tidy_users %>%
  group_by(MonthName) %>%
  summarise(
    mean_user = mean(Users),
    sem = sd(Users) / sqrt(n())
  )

pic <- users_summary %>%
  ggplot(aes(
    x = MonthName,
    y = mean_user,
    ymin = mean_user - sem,
    ymax = mean_user + sem
  )) +
  geom_col() +
  geom_errorbar(width = .5)
script9.R
R & RStudio
Starting the tutorial
Get tidyverse
Load & inspect data
Simple visualisation
The pipe
Group & summarise
Arrange, filter, select
Mutate data
More visualisation
Gather & spread
R Markdown
Other topics?
R & RStudio
Starting the tutorial
Get tidyverse
Load & inspect data
Simple visualisation
The pipe
Group & summarise
Arrange, filter, select
Mutate data
More visualisation
Gather & spread
R Markdown
Other topics?
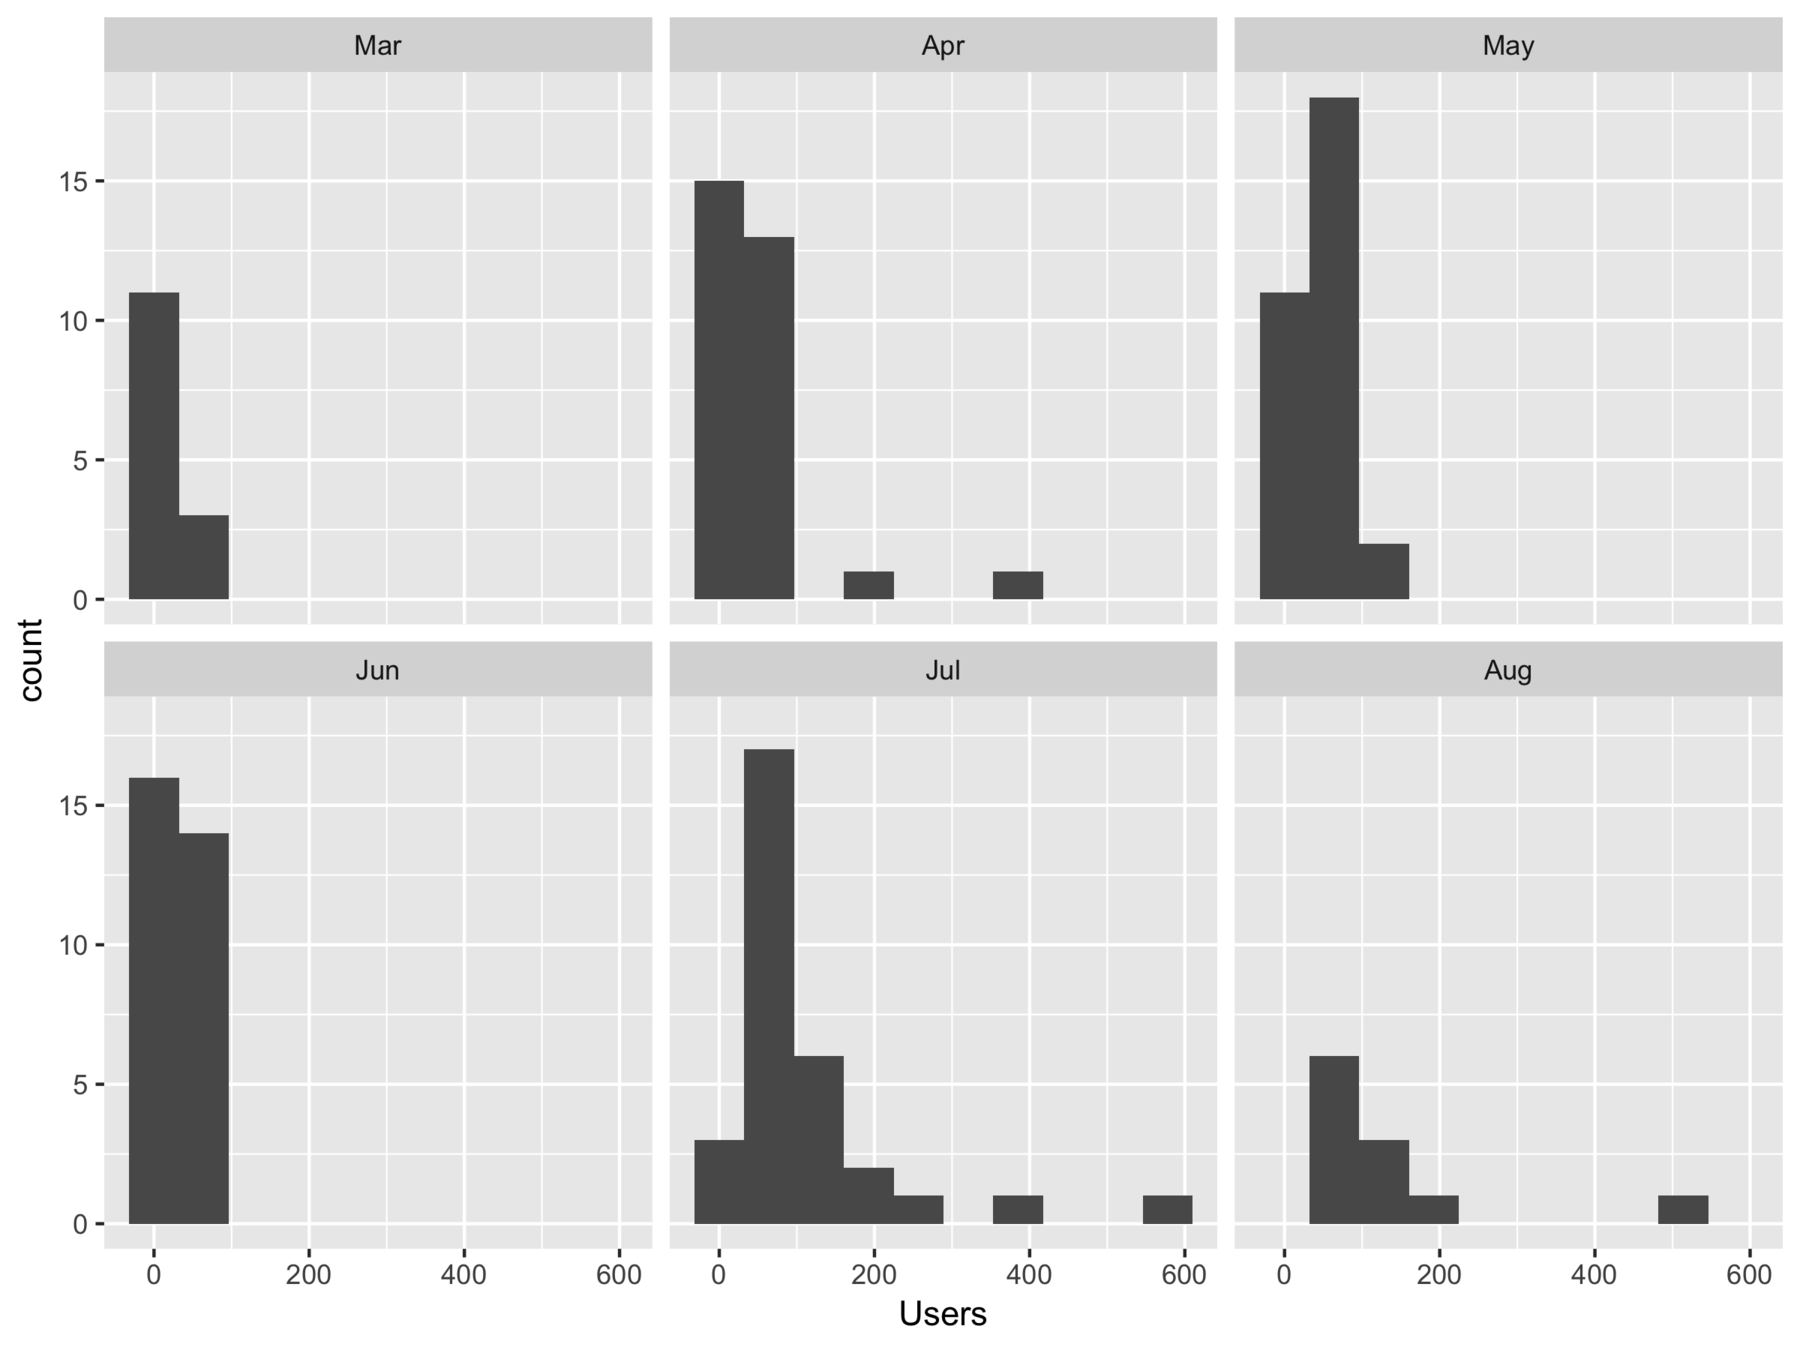
tidy_users %>%
  ggplot(aes(x = Users)) +
  geom_histogram(bins = 10) +
  facet_wrap(~named_month)
script9.R
R & RStudio
Starting the tutorial
Get tidyverse
Load & inspect data
Simple visualisation
The pipe
Group & summarise
Arrange, filter, select
Mutate data
More visualisation
Gather & spread
R Markdown
Other topics?
# read...
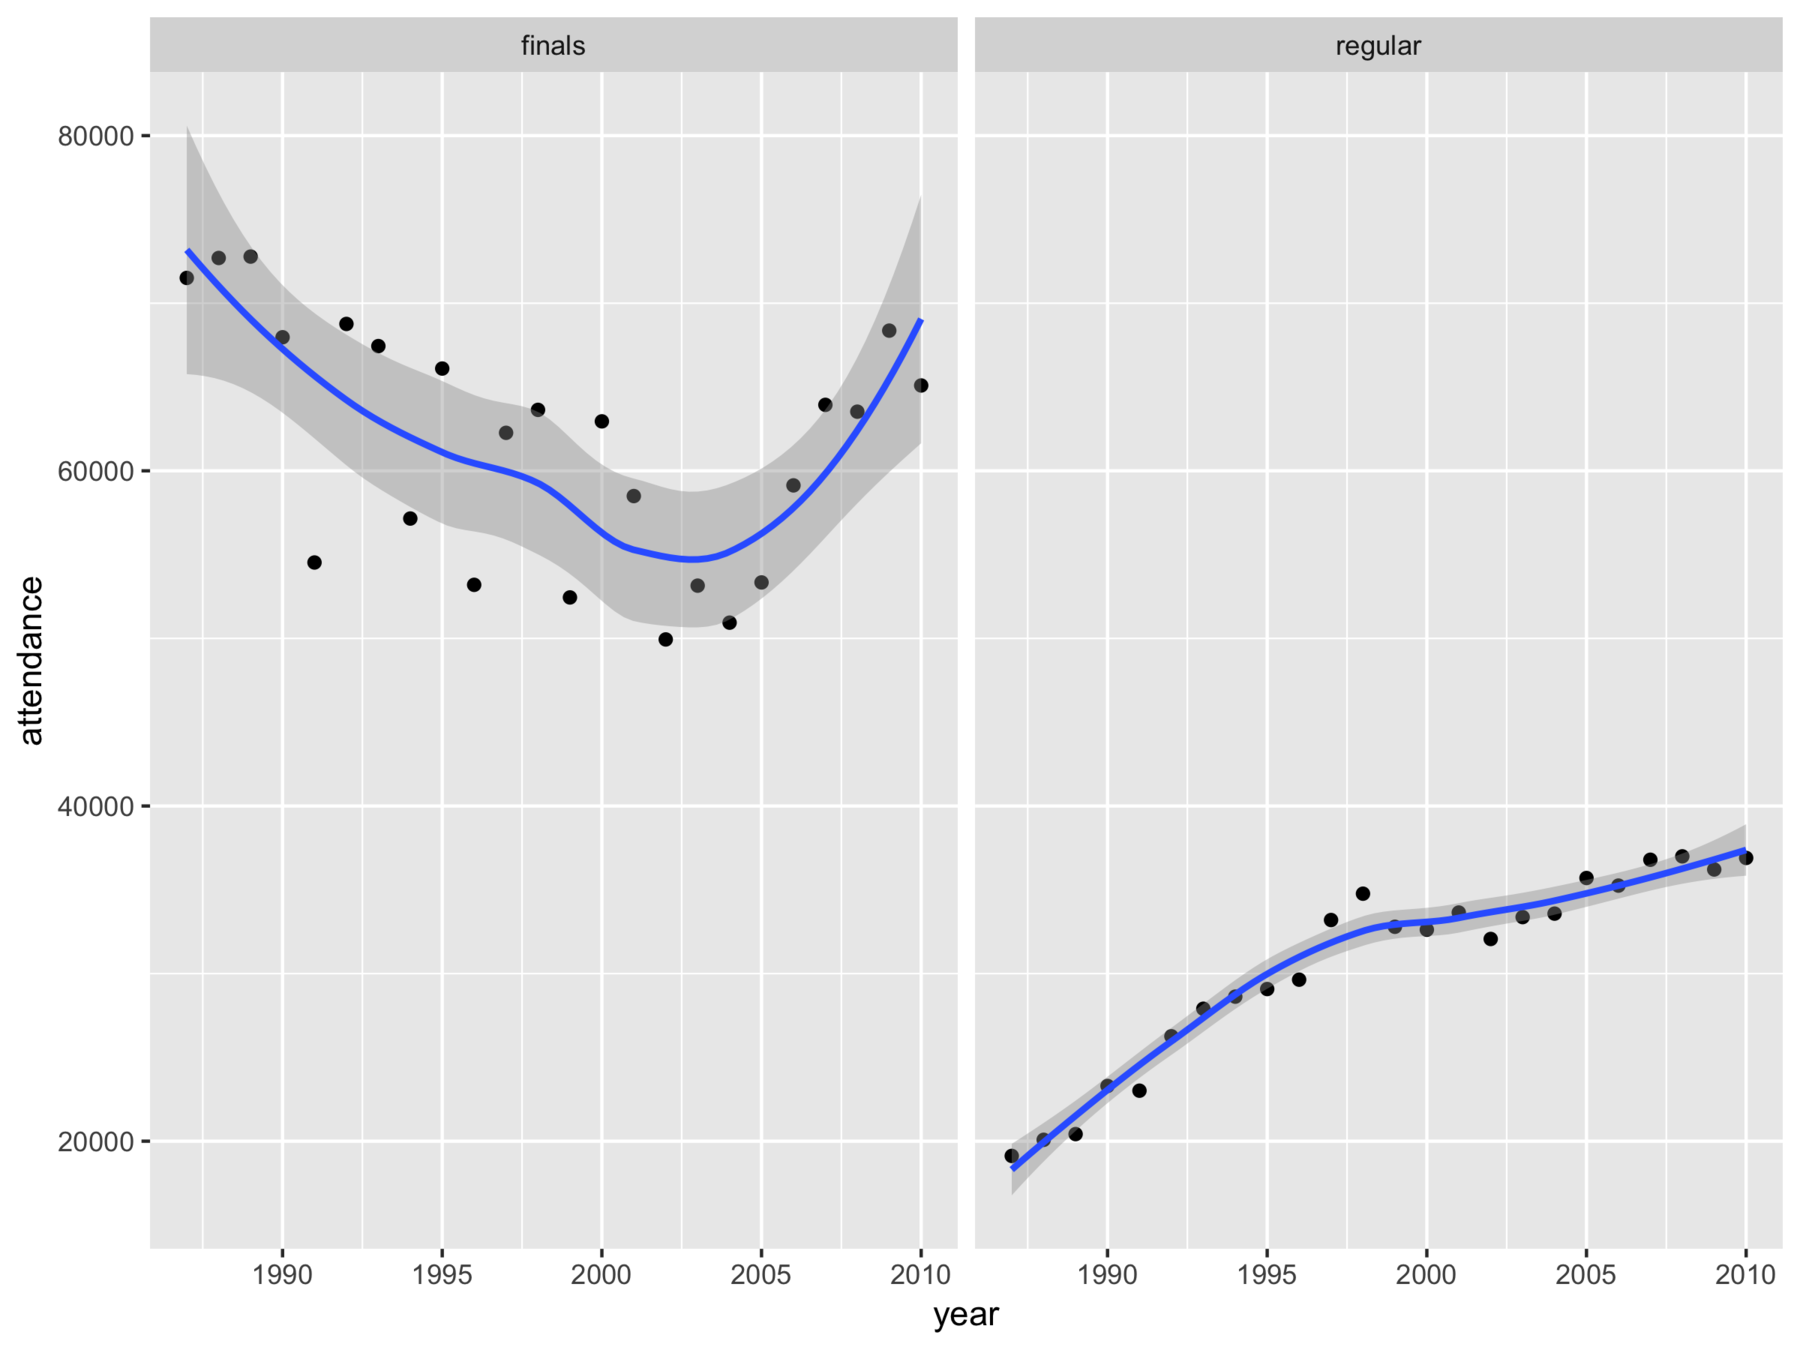
afl <- read_csv("./data/afl.csv")
# summarise...
attendance <- afl %>%
group_by(year, game_type) %>%
summarise(attendance = mean(attendance))
# visualise...
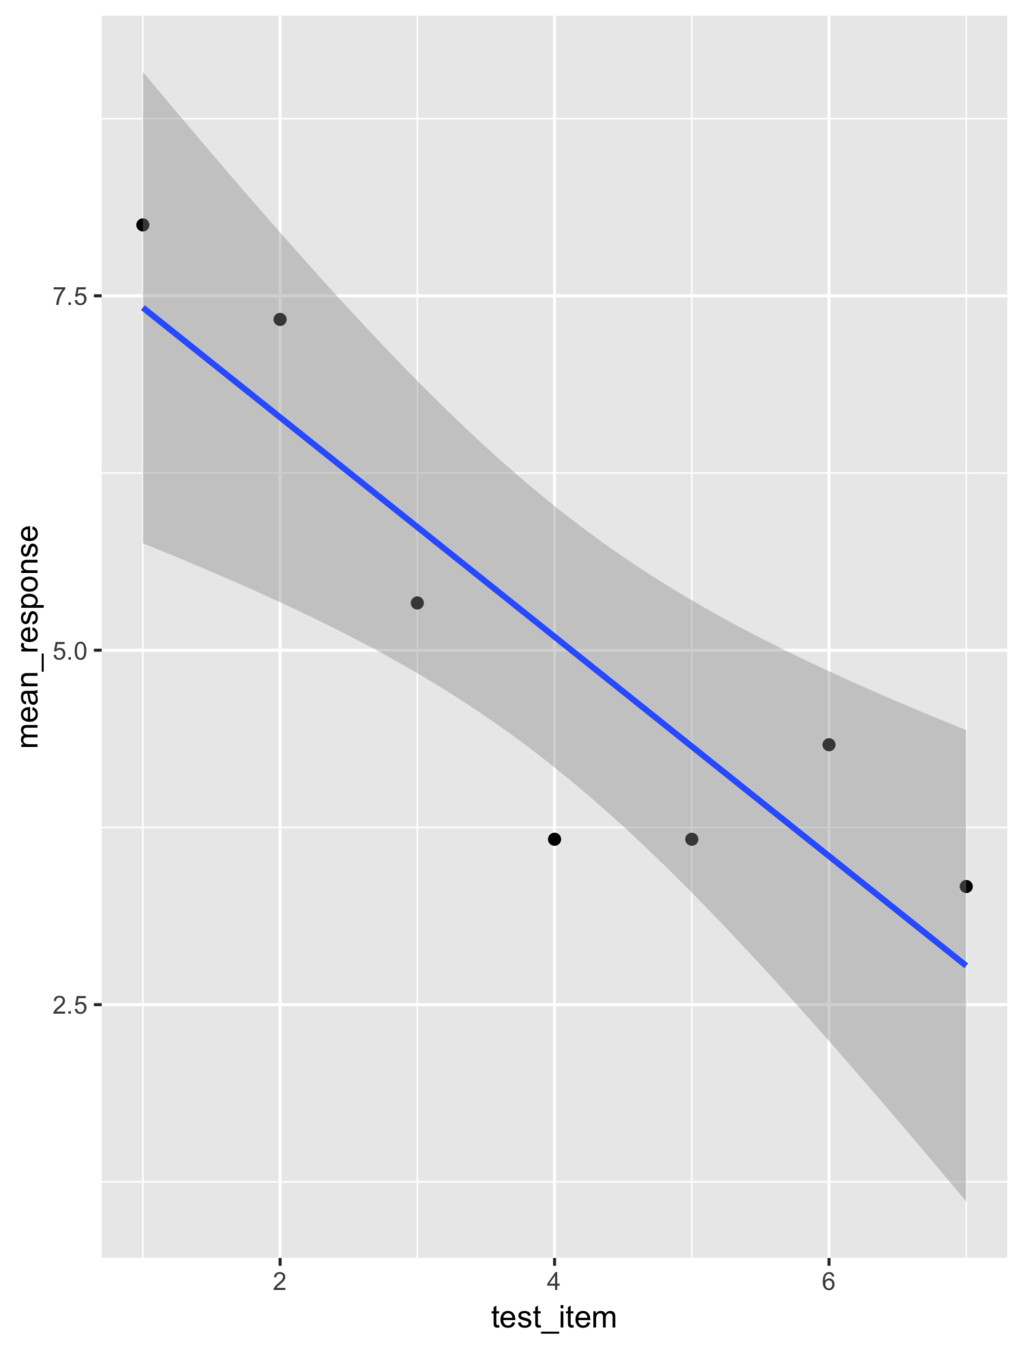
attendance %>%
ggplot(aes(x = year, y = attendance)) +
geom_point() +
facet_wrap(~ game_type) +
geom_smooth()script10.R
R & RStudio
Starting the tutorial
Get tidyverse
Load & inspect data
Simple visualisation
The pipe
Group & summarise
Arrange, filter, select
Mutate data
More visualisation
Gather & spread
R Markdown
Other topics?
R & RStudio
Starting the tutorial
Get tidyverse
Load & inspect data
Simple visualisation
The pipe
Group & summarise
Arrange, filter, select
Mutate data
More visualisation
Gather & spread
R Markdown
Other topics?
compcogscisydney.org/psyr/visualising-data.html
R & RStudio
Starting the tutorial
Get tidyverse
Load & inspect data
Simple visualisation
The pipe
Group & summarise
Arrange, filter, select
Mutate data
More visualisation
Gather & spread
R Markdown
Other topics?
www.nailsmag.com/page/70218/market-research
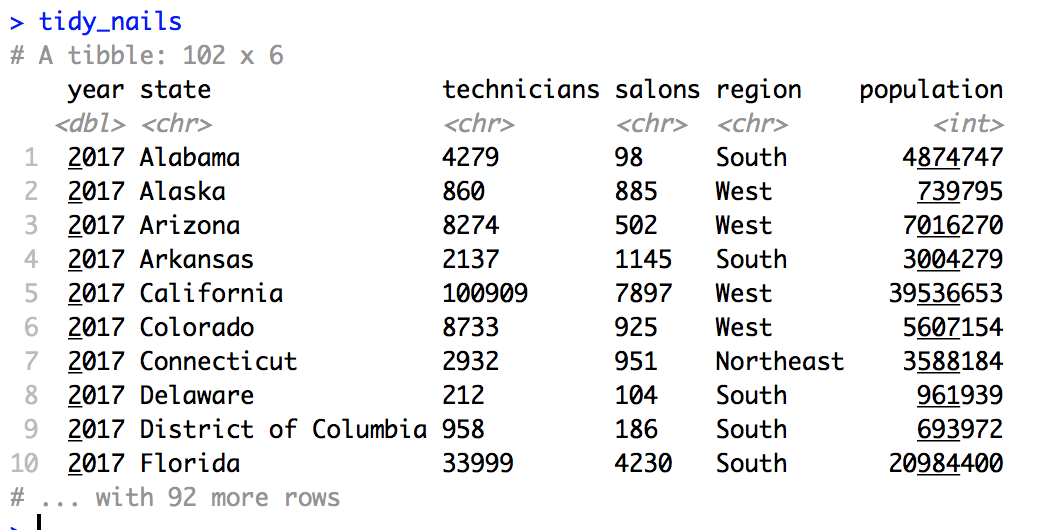
tidy_nails.csv
R & RStudio
Starting the tutorial
Get tidyverse
Load & inspect data
Simple visualisation
The pipe
Group & summarise
Arrange, filter, select
Mutate data
More visualisation
Gather & spread
R Markdown
Other topics?
These are two different "kinds" of way to "count" prevalence
script11.R
R & RStudio
Starting the tutorial
Get tidyverse
Load & inspect data
Simple visualisation
The pipe
Group & summarise
Arrange, filter, select
Mutate data
More visualisation
Gather & spread
R Markdown
Other topics?
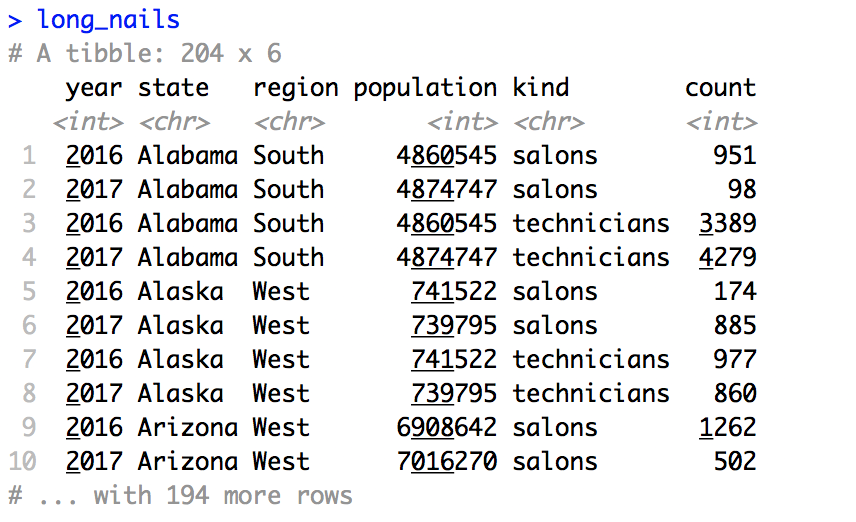
long_nails <- tidy_nails %>%
  gather(key = "kind", value = "count",
         technicians, salons)
script12.R
R & RStudio
Starting the tutorial
Get tidyverse
Load & inspect data
Simple visualisation
The pipe
Group & summarise
Arrange, filter, select
Mutate data
More visualisation
Gather & spread
R Markdown
Other topics?
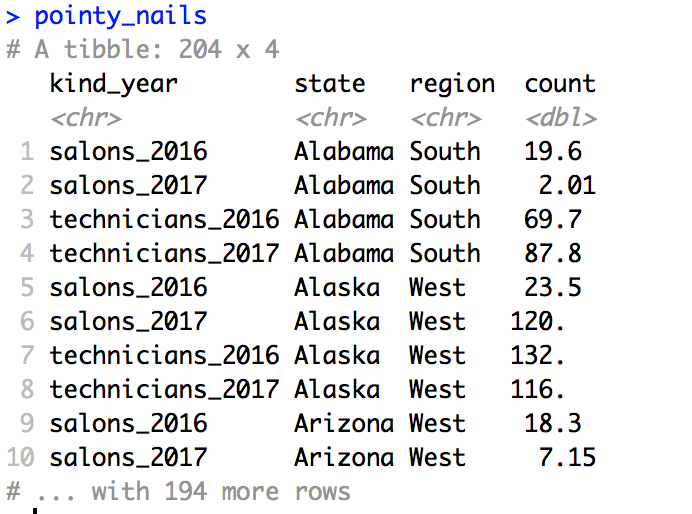
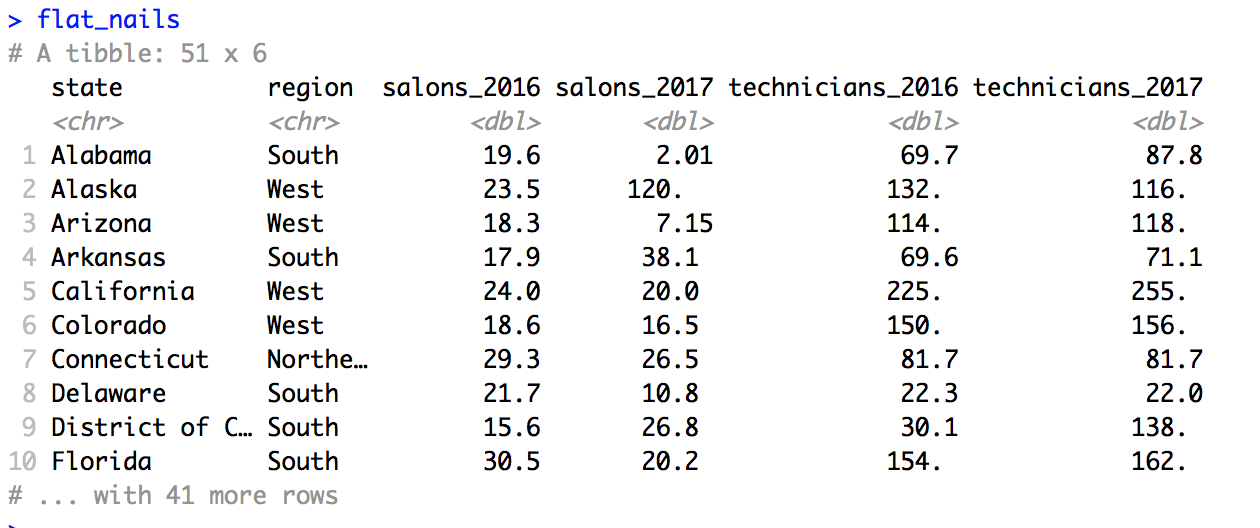
What about going the other way??
script12.R
R & RStudio
Starting the tutorial
Get tidyverse
Load & inspect data
Simple visualisation
The pipe
Group & summarise
Arrange, filter, select
Mutate data
More visualisation
Gather & spread
R Markdown
Other topics?
flat_nails <- pointy_nails %>%
  spread(key = "kind_year", value = "count")
script13.R
R & RStudio
Starting the tutorial
Get tidyverse
Load & inspect data
Simple visualisation
The pipe
Group & summarise
Arrange, filter, select
Mutate data
More visualisation
Gather & spread
R Markdown
Other topics?
R & RStudio
Starting the tutorial
Get tidyverse
Load & inspect data
Simple visualisation
The pipe
Group & summarise
Arrange, filter, select
Mutate data
More visualisation
Gather & spread
R Markdown
Other topics?
R & RStudio
Starting the tutorial
Get tidyverse
Load & inspect data
Simple visualisation
The pipe
Group & summarise
Arrange, filter, select
Mutate data
More visualisation
Gather & spread
R Markdown
Other topics?
compcogscisydney.org/psyr
rladiessydney.org/littlemisstidyverse
By Danielle Navarro
Slides for the "Little Miss Tidyverse" workshop hosted by R-Ladies Sydney (August 22, 2018). Blog post here: http://rladiessydney.org/littlemisstidyversehttp://rladiessydney.org/littlemisstidyverse Github repository here: https://github.com/rladiessydney/littlemisstidyverse


