


Igor Korotach
Head of FinTech at Quantum
Written by: Igor Korotach
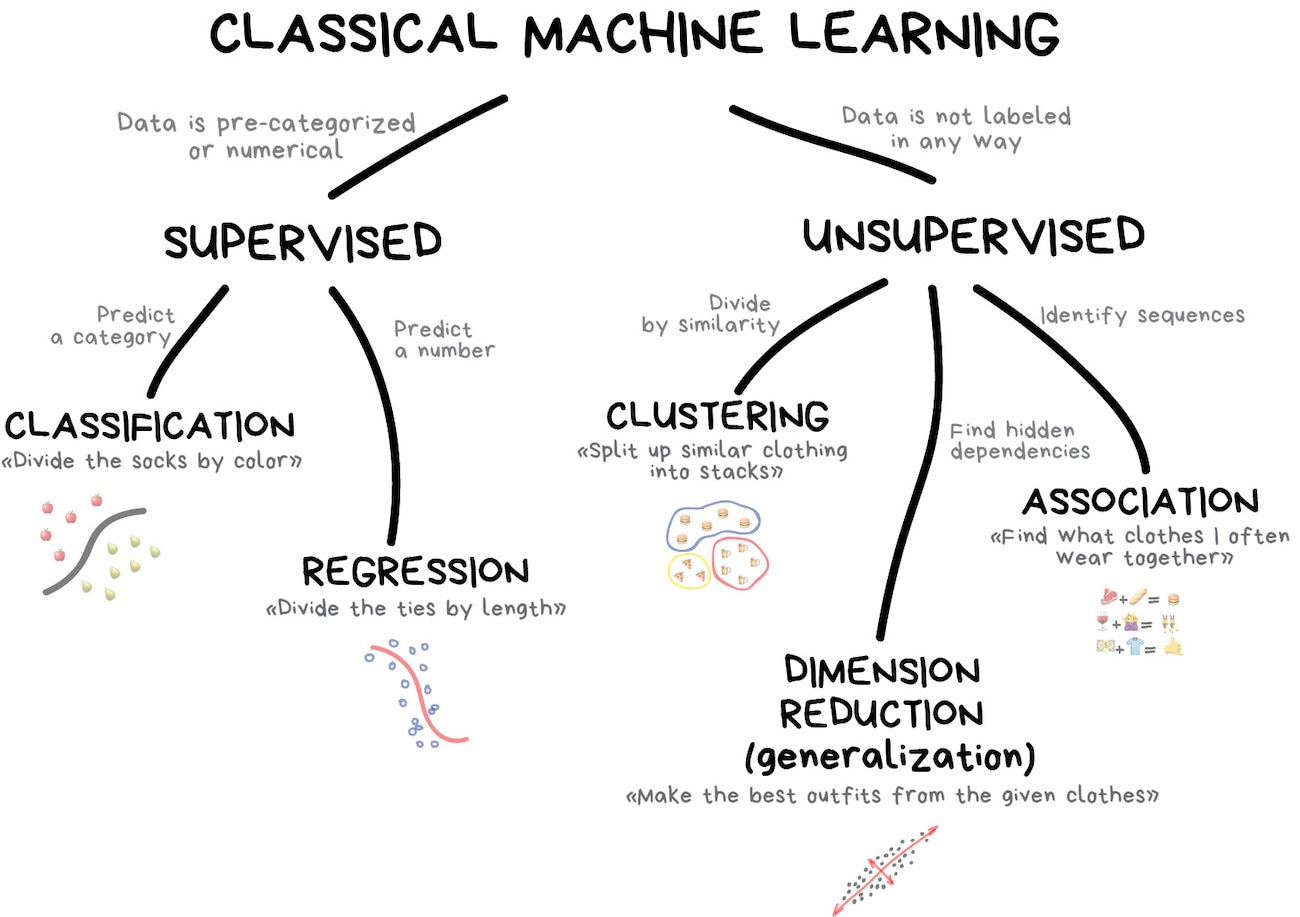
To recap the differences between the two:
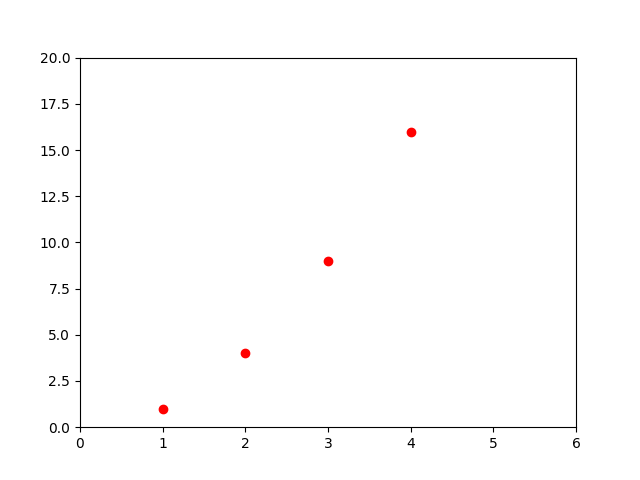
import matplotlib.pyplot as plt
plt.plot([1, 2, 3, 4], [1, 4, 9, 16], 'ro')
plt.axis([0, 6, 0, 20])
plt.show()Presentation link: https://slides.com/emulebest/de-ds
Mail: igorkorotach@gmail.com
Telegram: @emulebest
By Igor Korotach


