


Ishanu Chattopadhyay PRO
ML | Data Science Biomedical Informatics | Social Science | Assistant Professor
Ishanu Chattopadhyay, PhD
Assistant Professor of Biomedical Informatics & Computer Science
University of Kentucky
quantized output levels
Building classifier based on LSM metric
No transplantation is guaranteed to work reliably
Predicted to reduce
risk reliably
Predicted to reduce
risk reliably
Dataset from Metabolomics Workbench
| Study ID | ST000923 |
|---|---|
| Study Title | Longitudinal Metabolomics of the Human Microbiome in Inflammatory Bowel Disease |
| Institute | Broad Institute of MIT and Harvard |
|---|---|
| Last Name | Avila-Pacheco |
| First Name | Julian |
| Submit Date | 2017-11-14 |
| Num Groups | 3 |
| Total Subjects | 546 |
| Num Males | 276 |
| Num Females | 270 |
| Analysis Type Detail | LC-MS |
State-of-art microbiome based Classification (~10 species) *
| IBD vs UC | 0.82 |
| IBD vs CD | 0.76 |
*Zheng, J., et al. (2024). Noninvasive, microbiome-based diagnosis of inflammatory bowel disease. Nature Medicine, 30(12), 3555–3567. https://doi.org/10.1038/s41591-024-03280-4
| IBD vs non IBD | 0.85 |
Gut-Metabolome based Classification (~36 metabolites) *
Application 2
LSM model
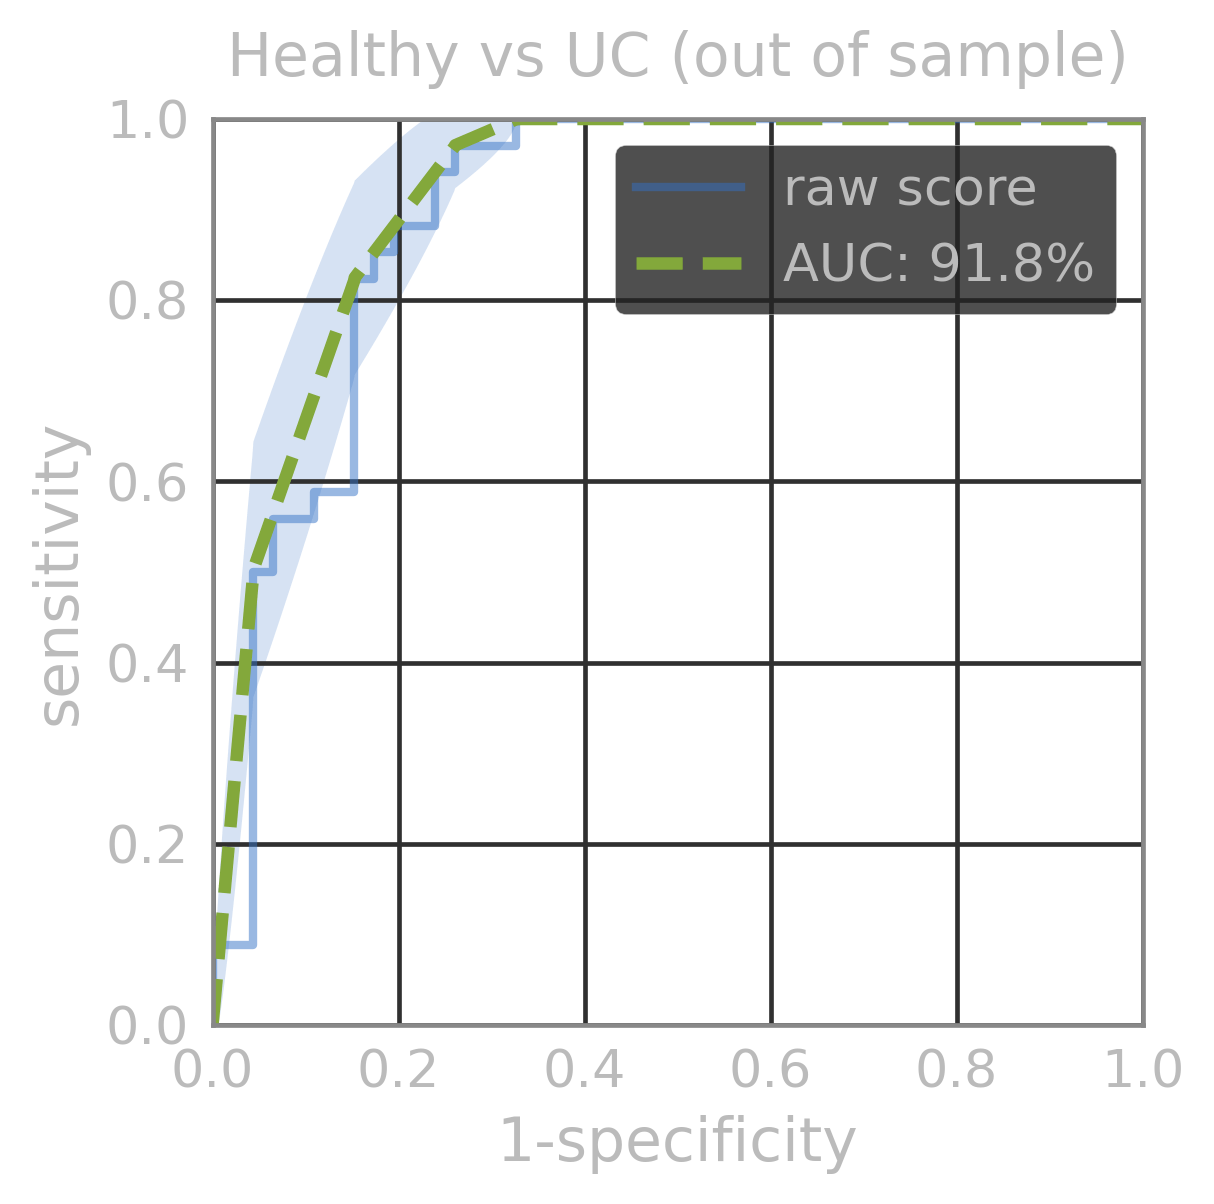
| AUC (out of sample) | |
|---|---|
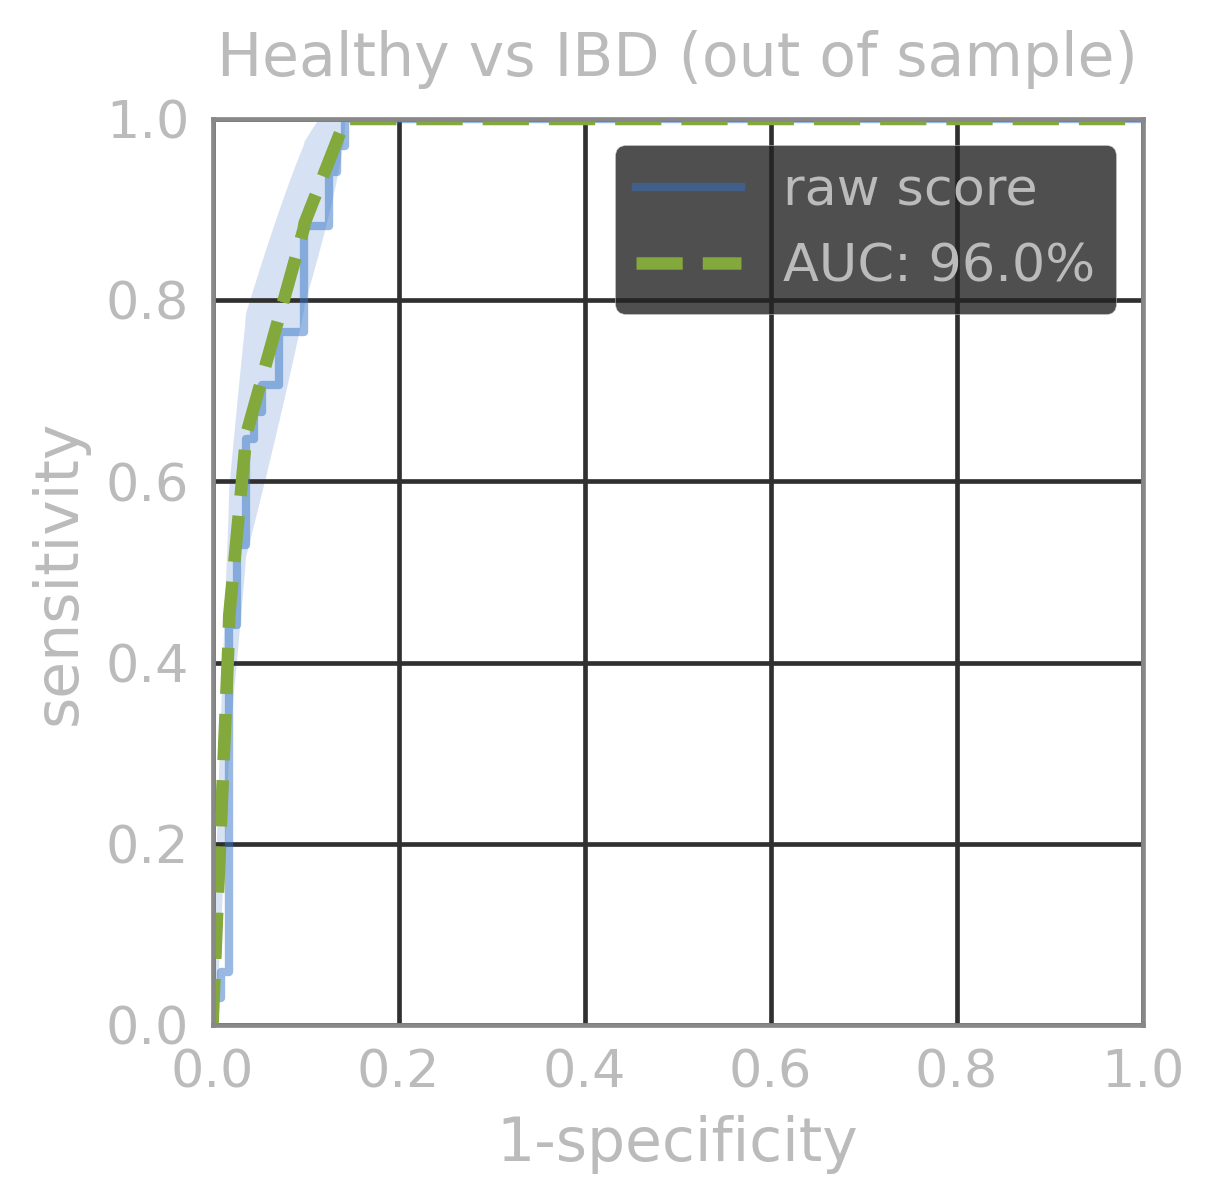
| Healthy vs IBD | 96.1% |
| Healthy vs UC | 92% |
| UC vs CD | 99% |
| Healthy vs CD | 99% |
LSM model
| AUC (out of sample) | |
|---|---|
| Healthy vs IBD | 96.1% |
| Healthy vs UC | 92% |
| UC vs CD | 99% |
| Healthy vs CD | 99% |
| Number of metabolites | 5,280 | 85% untargeted metabolites |
|---|---|---|
| Number of parameters | 4,002,306 | |
| Average Tree Depth | 38.62 | |
| Number of constraints inferred | 108,884 | ~83% involve untargeted metabolites |
| Number of samples used | 180 | (no clinical phenotype information used) |
Application 3
sample profile of new patient \(y\)
Need one patient!
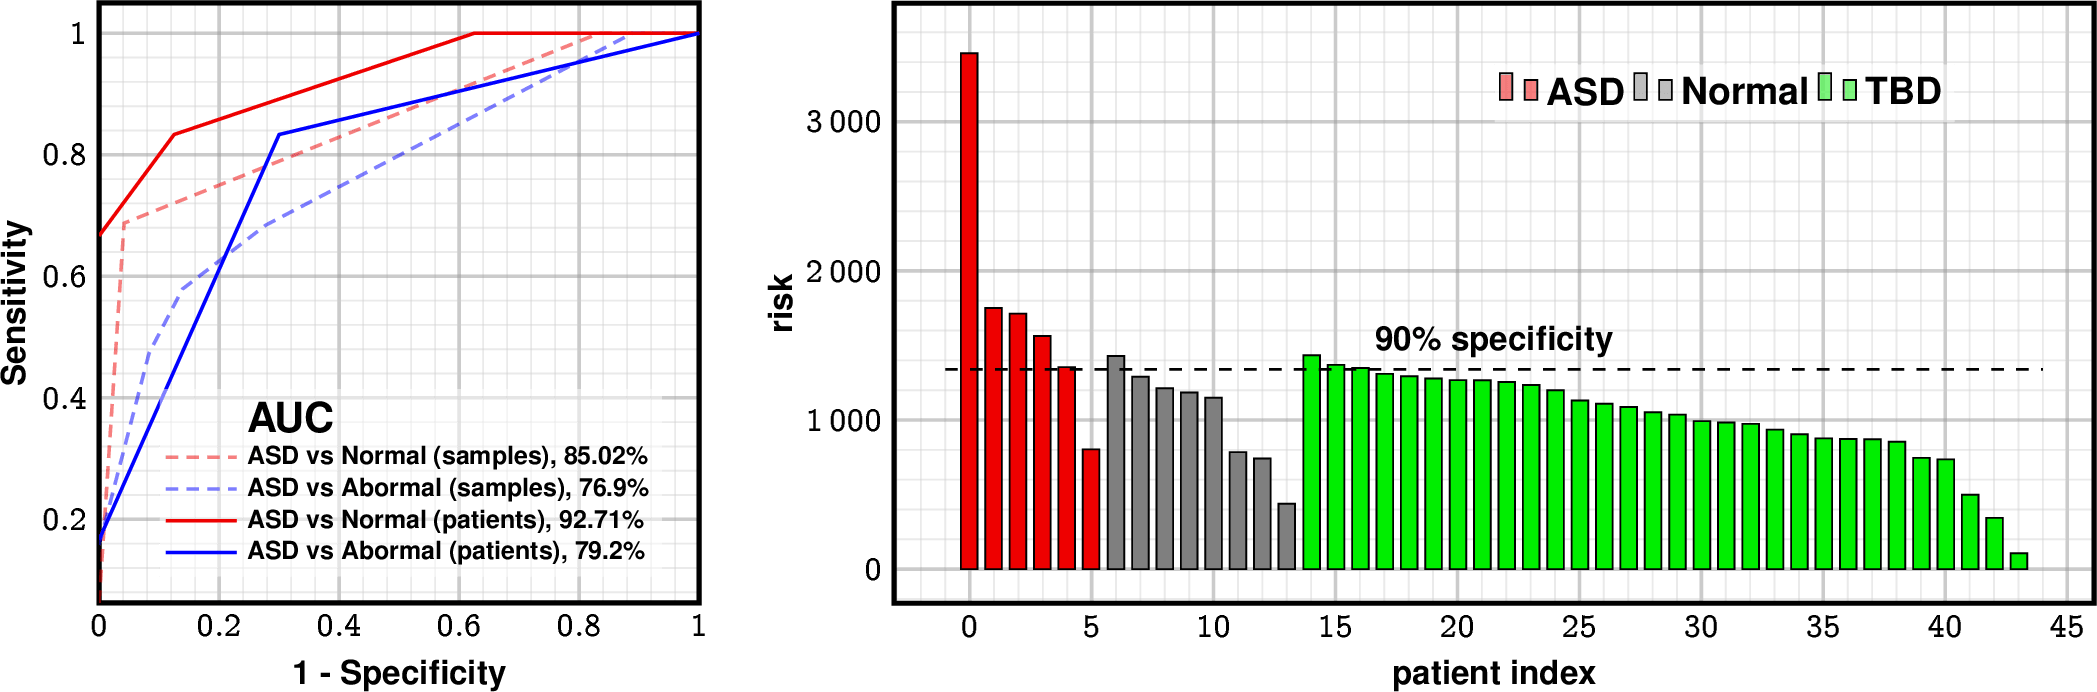
| AUC | Sensitivity at 95% spec | |
|---|---|---|
| LSM | 92.7% | 74% |
| MCHAT/F | 67% | 39% |
| ADOS-2 | 90-97% | 85% |
getting close to the gold standard
1 false positive
1 false negative
10% flag in TBD (expected 8.3% positives)
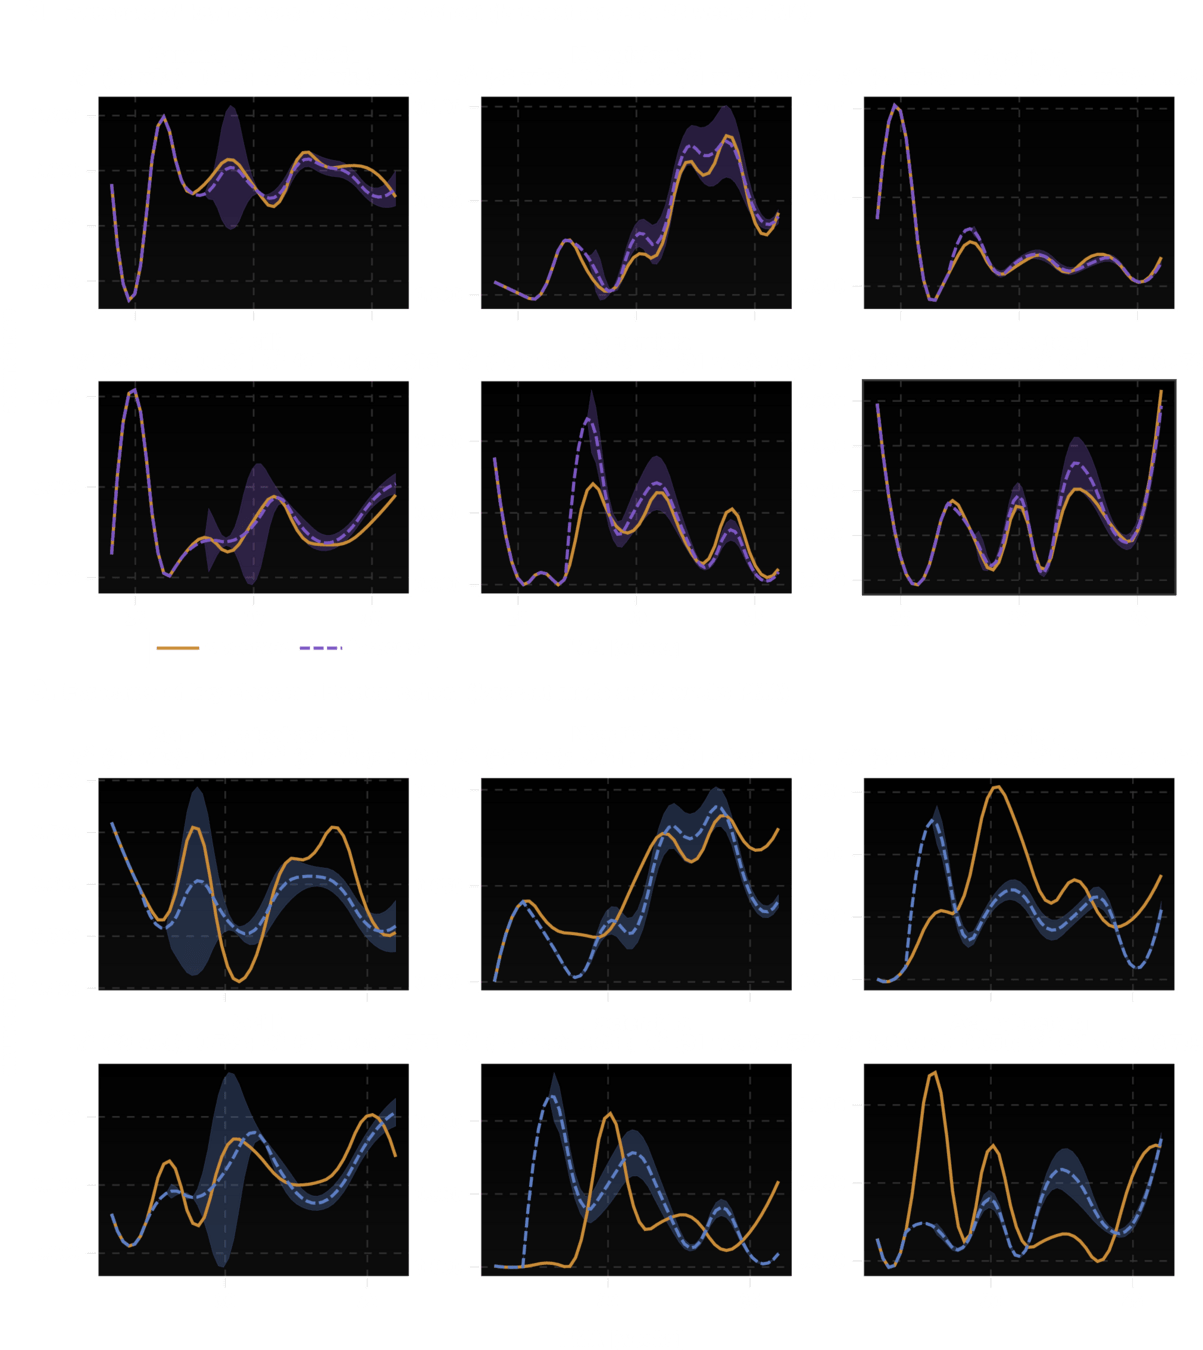
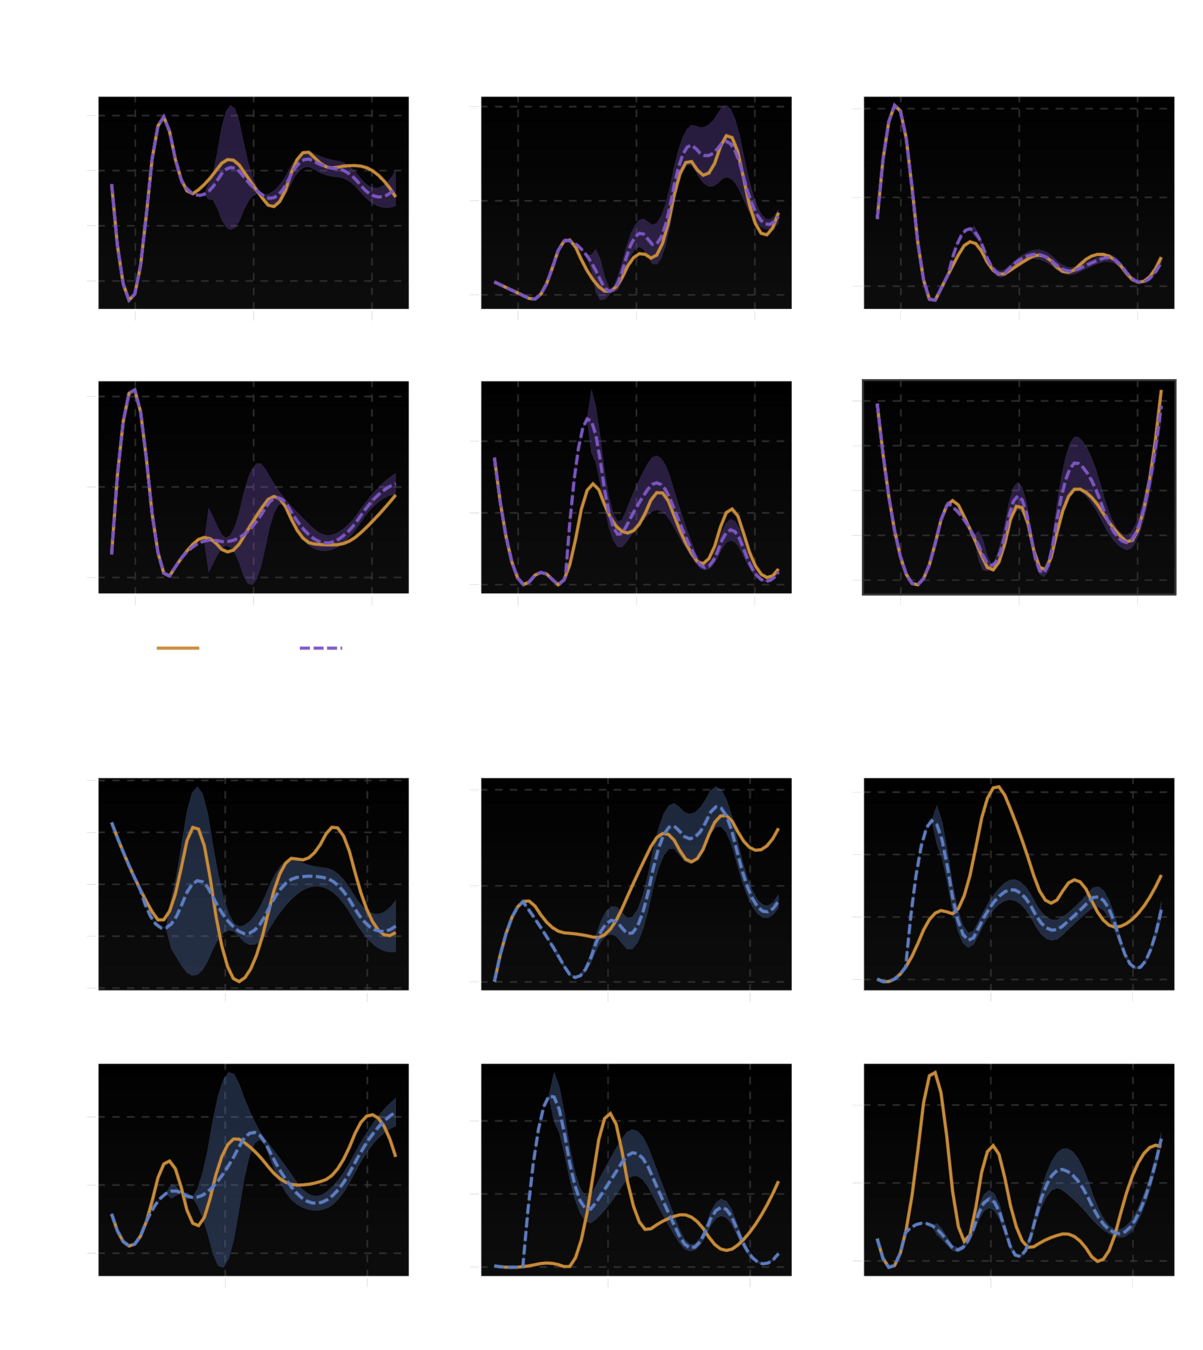
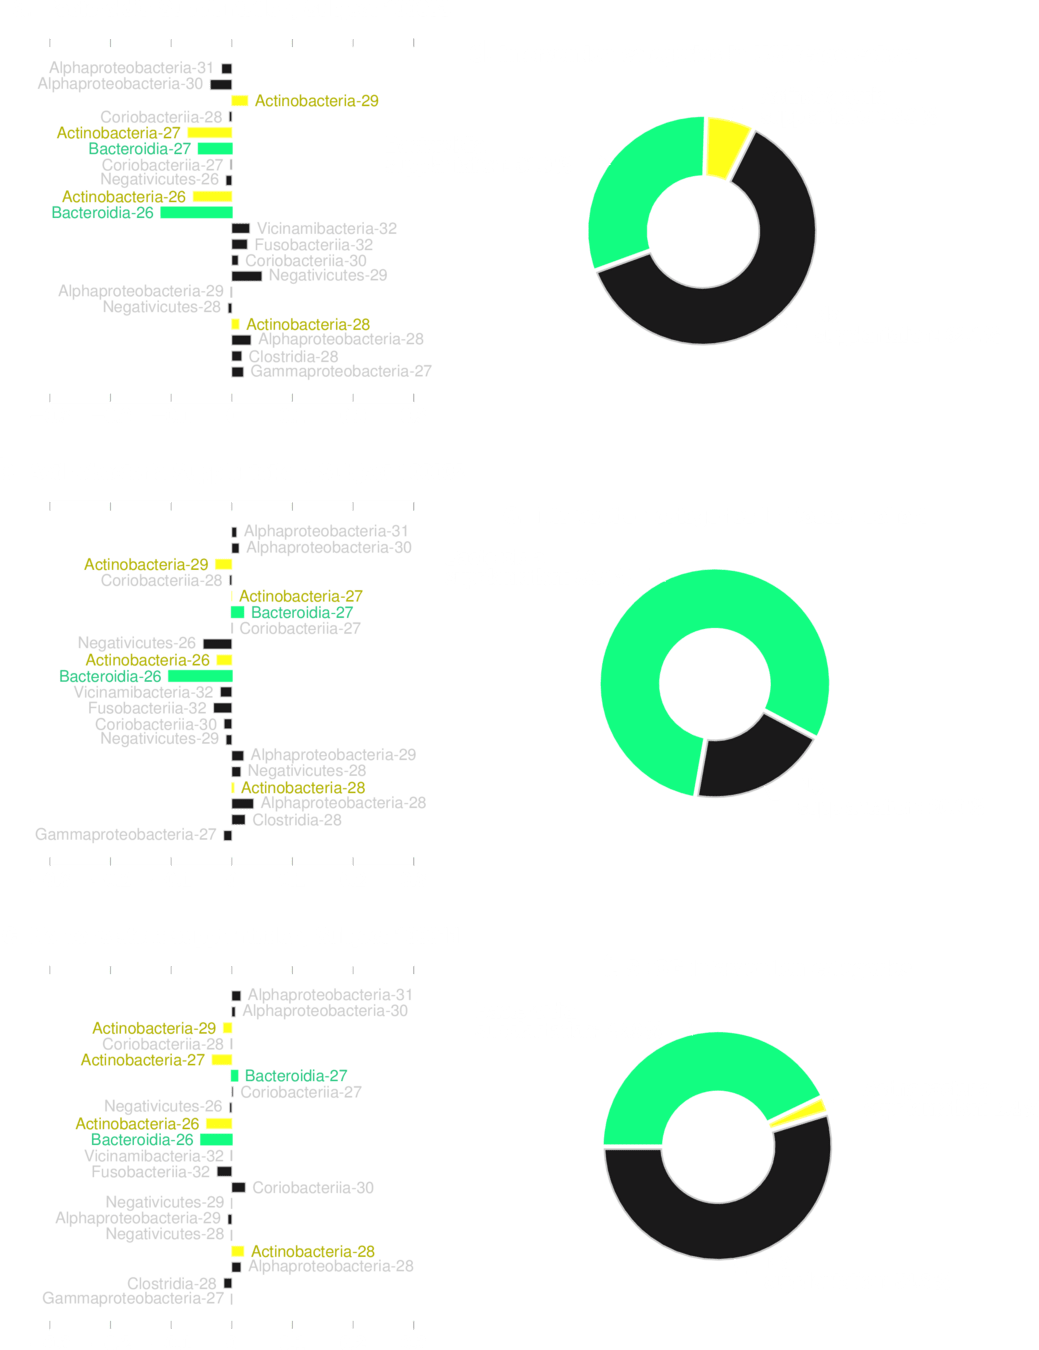
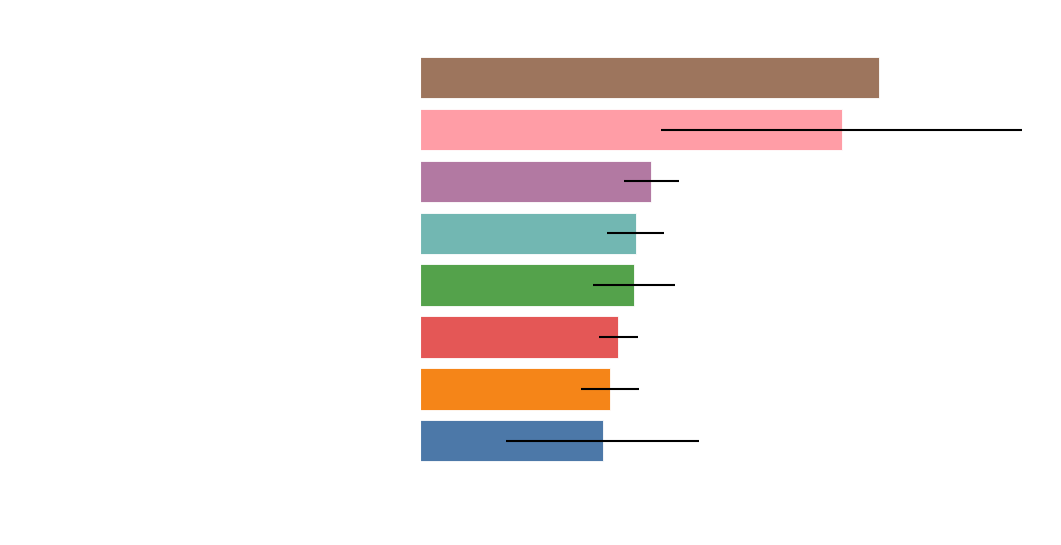
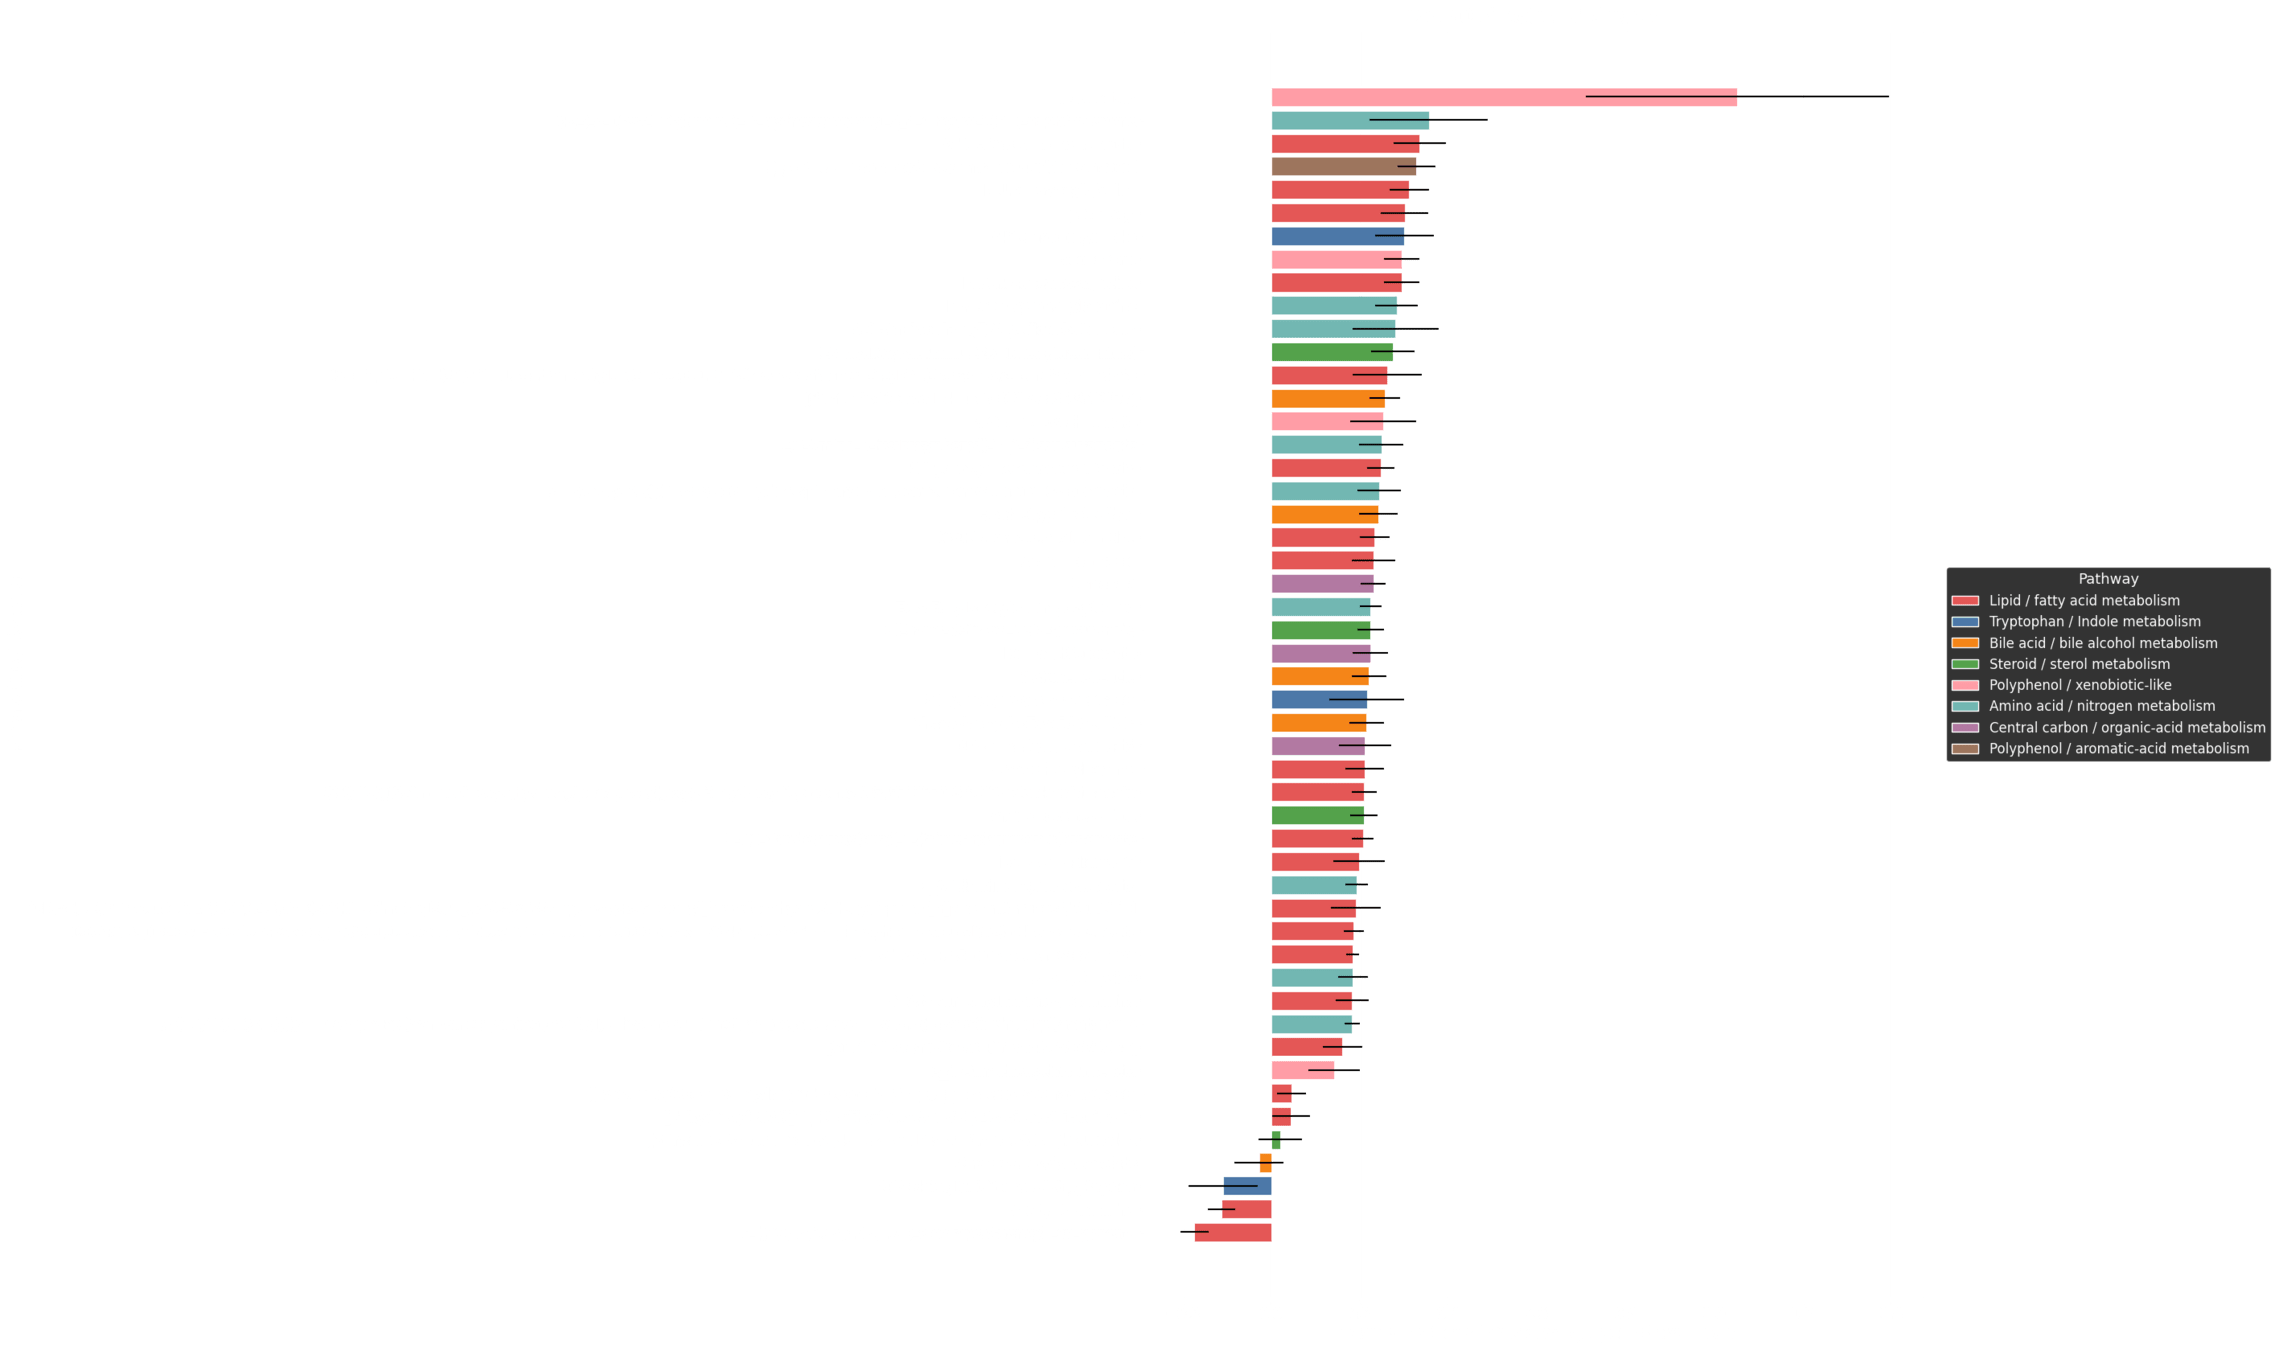
Patient specific driver profile
Average driver profile
A New Paradigm of AI-driven Discovery in Metabolome Biology
By Ishanu Chattopadhyay
DARPA-EA-25-02-05-MAGICS-PA-025