






Ishanu Chattopadhyay PRO
ML | Data Science Biomedical Informatics | Social Science | Assistant Professor
Ishanu Chattopadhyay, PhD
Asst Professor, Biomedical informatics & Computer Science
University of Kentucky
ishanu_ch@uky.edu
ALLTECH RESEARCH SHOWCASE
PAI PREEMPT MAGICS
The views, opinions and/or findings expressed are those of the author(s) and should not be interpreted as representing the official views or policies of the Department of Defense or the U.S. Government.
1918 onward: classical swine H1N1 persists in pigs [1,2]
1979: Eurasian avian-like swine H1N1 becomes established in European swine [2]
1998: North American triple-reassortant swine viruses emerge [3]
2008-2009: pandemic genome assembled in swine; 6 segments from North American triple-reassortant swine viruses, 2 segments (NA, M) from Eurasian avian-like swine [3]
Mar-Apr 2009: human outbreak recognized in Mexico and the U.S. [3,4]
Jun 11, 2009: WHO declares pandemic [5]
Memoli MJ, Tumpey TM, Jagger BW, Dugan VG, Sheng ZM, Qi L, Kash JC, Taubenberger JK. An early “classical” swine H1N1 influenza virus shows similar pathogenicity to the 1918 pandemic virus in ferrets and mice. Virology. 2009;393(2):338-345. doi:10.1016/j.virol.2009.08.021.
Dunham EJ, Dugan VG, Kaser EK, Perkins SE, Brown IH, Holmes EC, Taubenberger JK. Different evolutionary trajectories of European avian-like and classical swine H1N1 influenza A viruses. Journal of Virology. 2009;83(11):5485-5494. doi:10.1128/JVI.02565-08.
Smith GJD, Vijaykrishna D, Bahl J, Lycett SJ, Worobey M, Pybus OG, Ma SK, Cheung CL, Raghwani J, Bhatt S, Peiris JSM, Guan Y, Rambaut A. Origins and evolutionary genomics of the 2009 swine-origin H1N1 influenza A epidemic. Nature. 2009;459(7250):1122-1125. doi:10.1038/nature08182.
Centers for Disease Control and Prevention. Outbreak of swine-origin influenza A (H1N1) virus infection, Mexico, March-April 2009. MMWR Morb Mortal Wkly Rep. 2009;58(17):467-470.
World Health Organization. DG Statement following the meeting of the Emergency Committee. 11 June 2009.
1918
1979
1998
2008
2008
2009
Mar
Jun
ALLTECH / 19 OCT 2026
01 / WHY IT MATTERS
Emergence starts in animals
8 of 8
Segments of the 2009 pandemic genome came from viruses already circulating in swine
30 years
From the 1979 swine lineage to the first human cases in 2009
Visible in sequence data years before it was visible in people.
Timeline after Smith et al., Nature (2009); full references on slide.
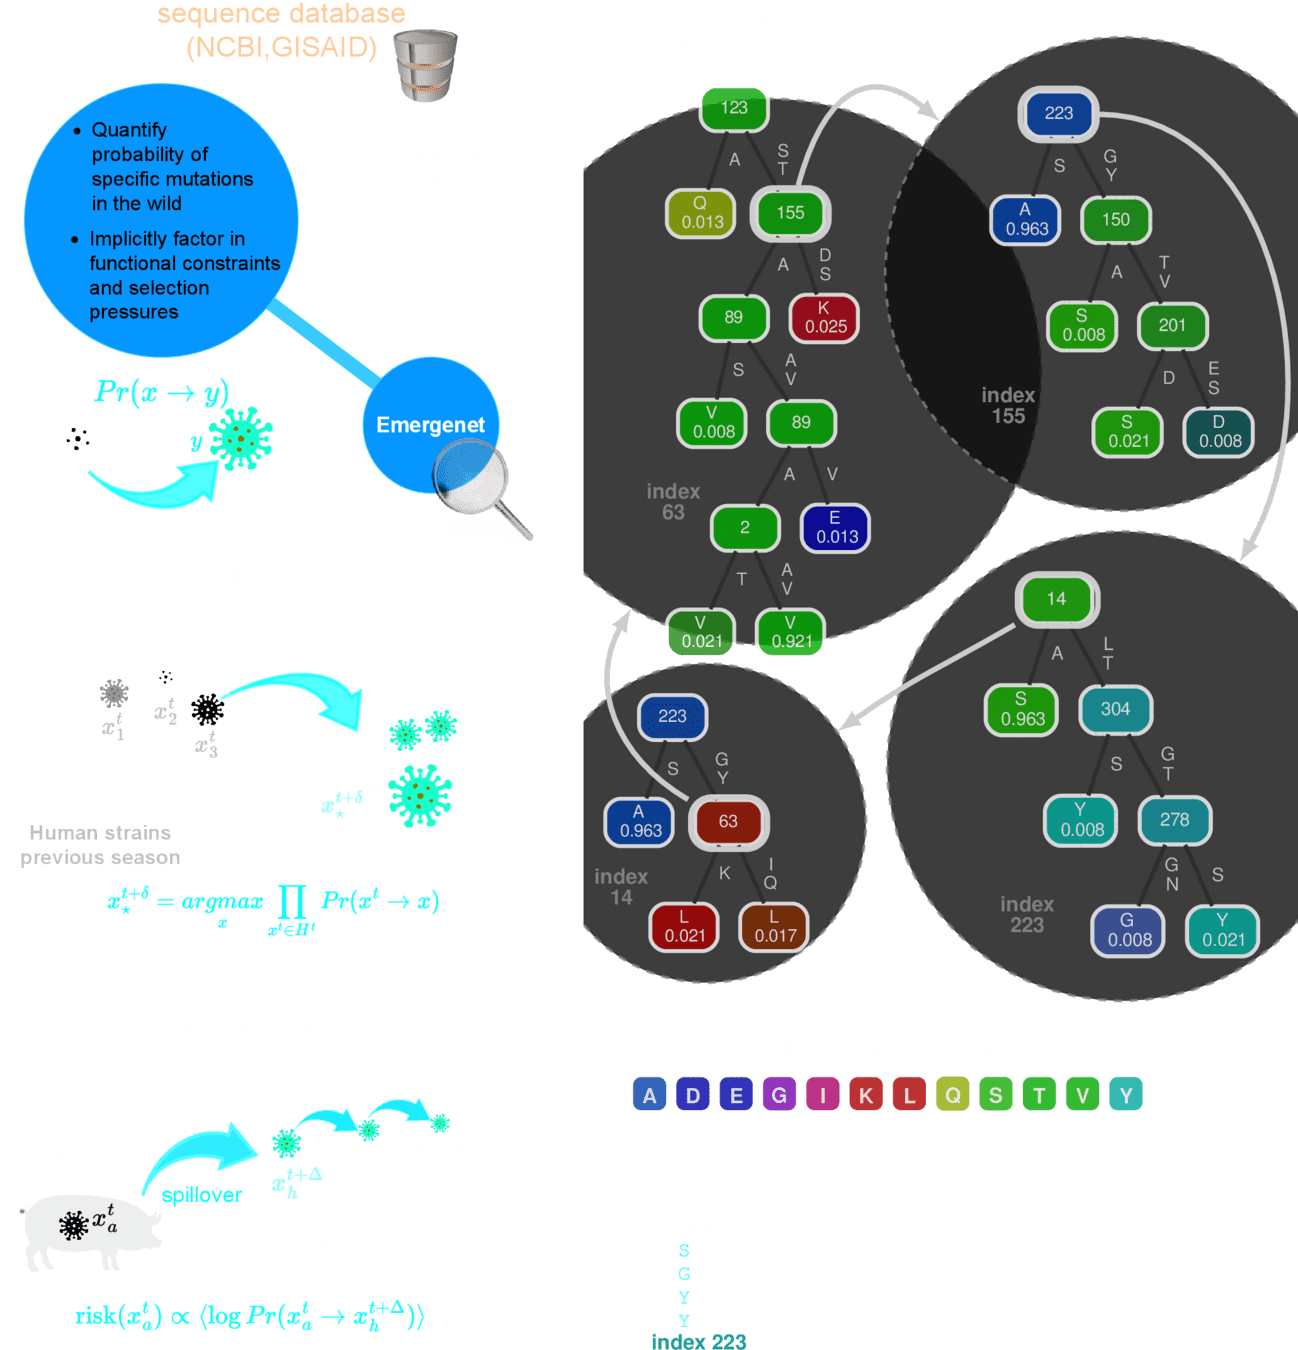
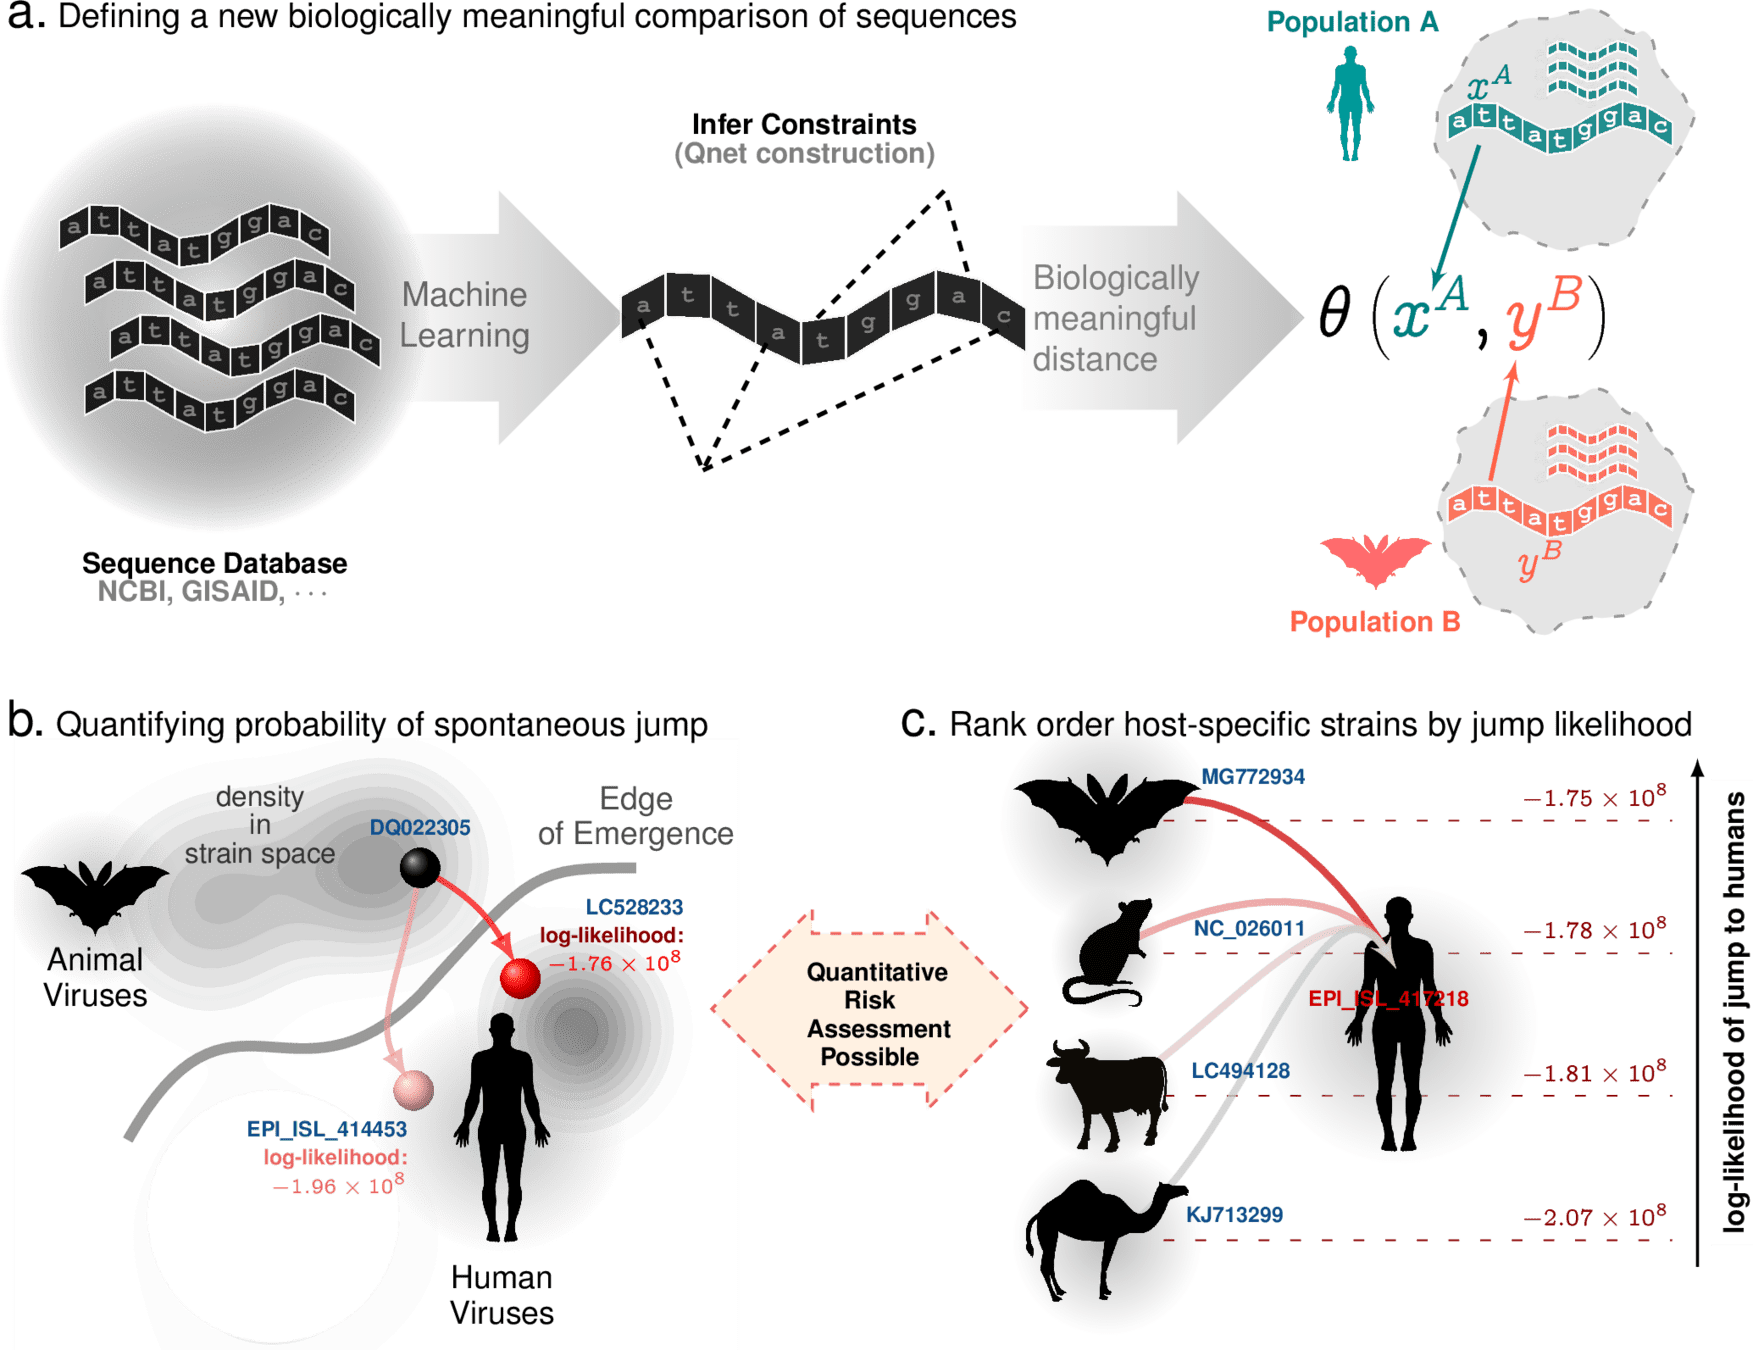
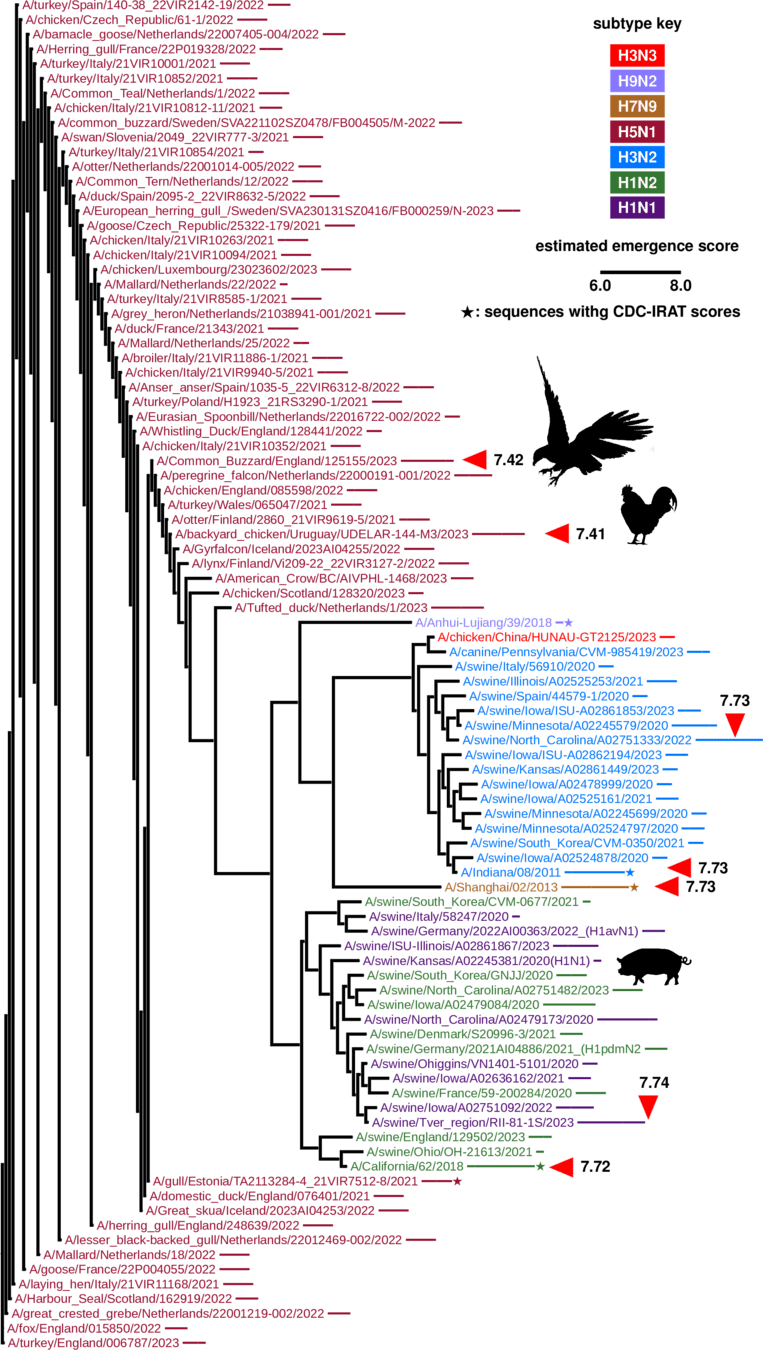
Are emergence events predictable?
NCBI + GISAID
>400,000 HA/NA sequences
recursive forest of conditional inference trees
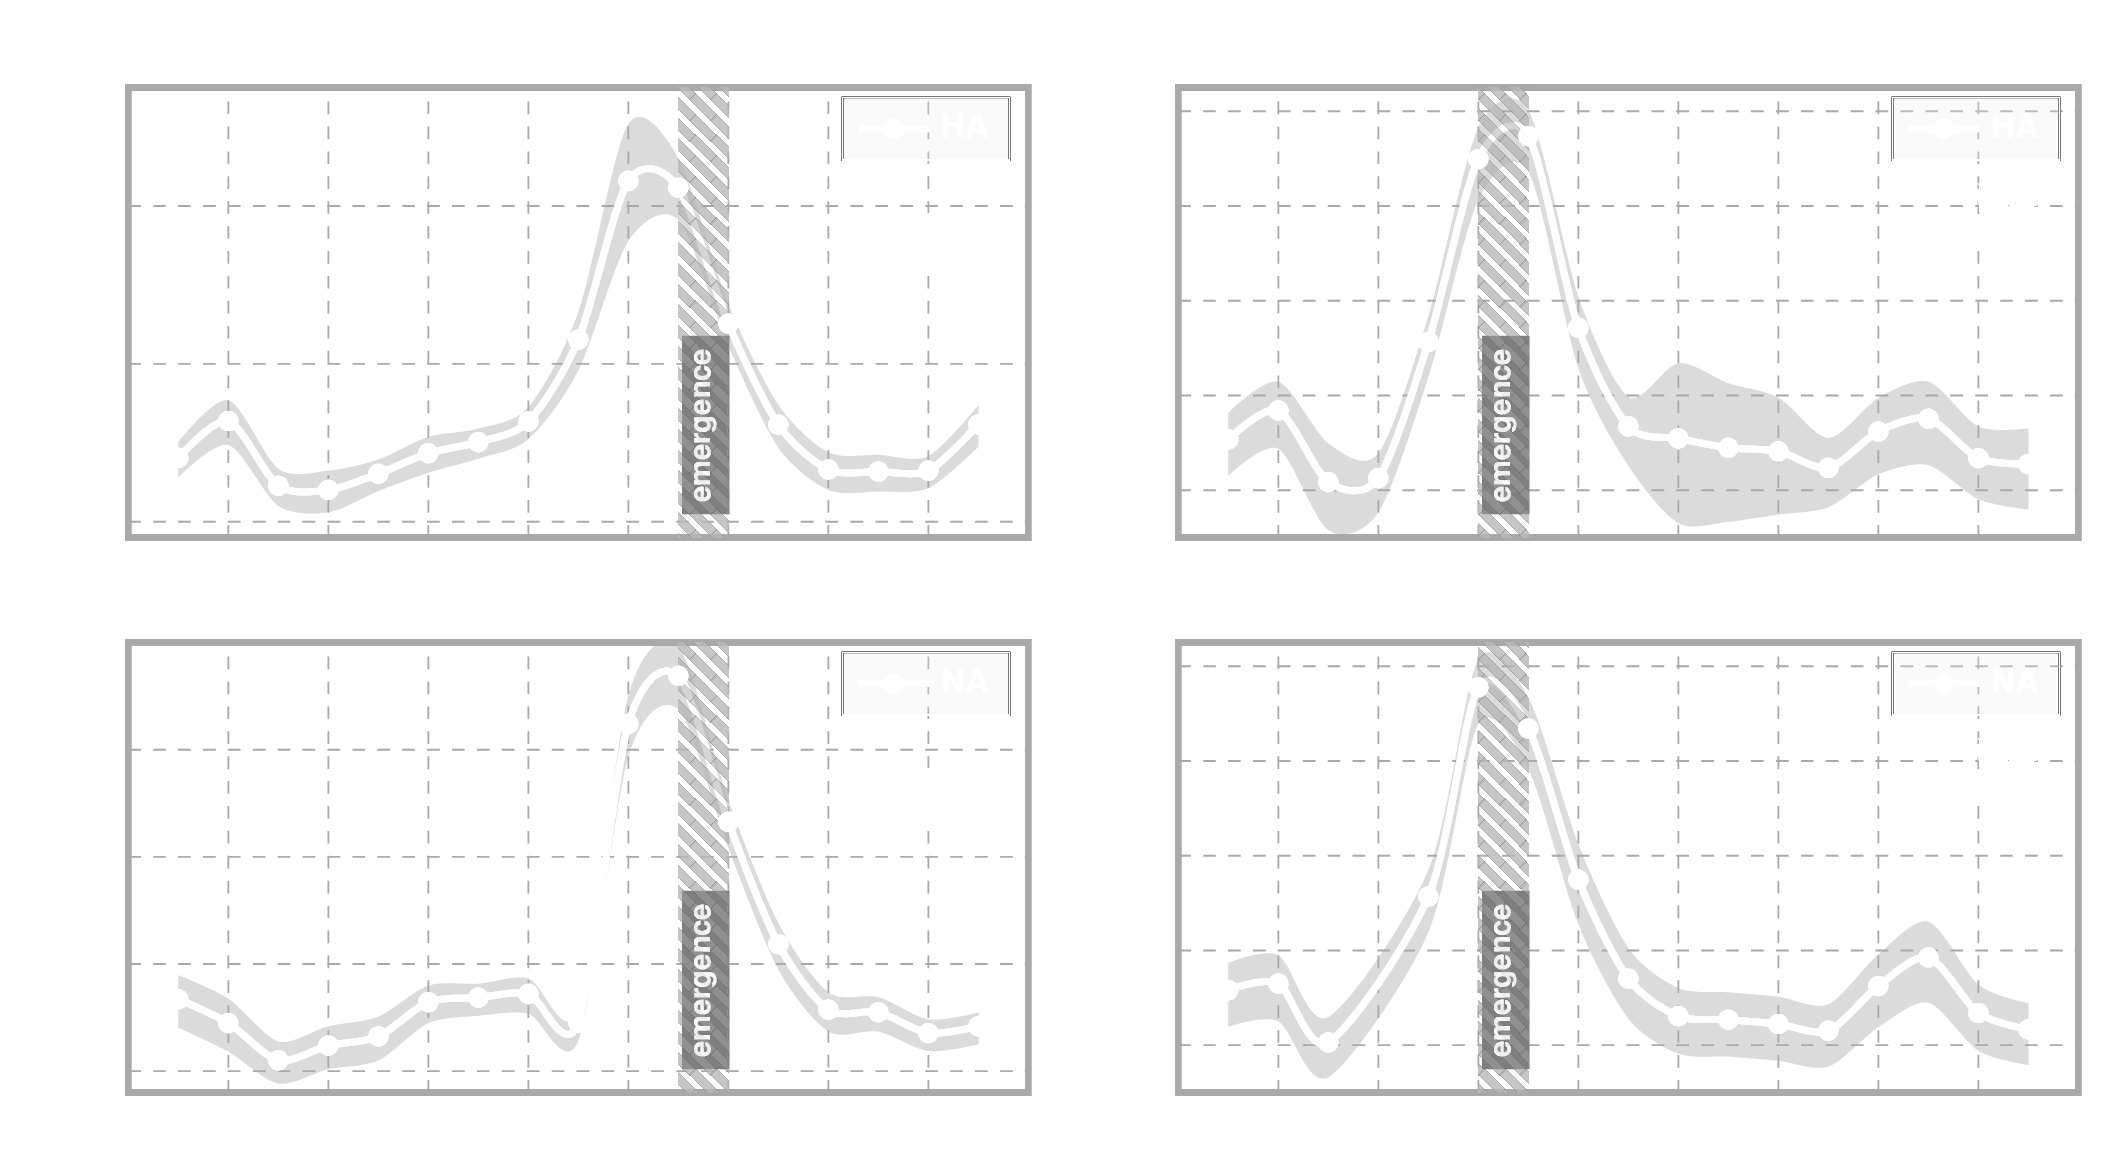
H1N1 2025 Influenza A HA
Set of conditional inference trees (CIT)
Strict statistical guarantees: quantifies inference uncertainty
Each tree models exactly one variable as a function of potentially all other variables
Non-leaf nodes are "hyperlinked" to other trees
Learn the emergent constriants from data
H5N1 2025 Influenza A HA
Set of conditional inference trees (CIT)
Strict statistical guarantees: quantifies inference uncertainty
Each tree models exactly one variable as a function of potentially all other variables
Non-leaf nodes are "hyperlinked" to other trees
Learn the emergent constriants from data
(automated, in seconds)
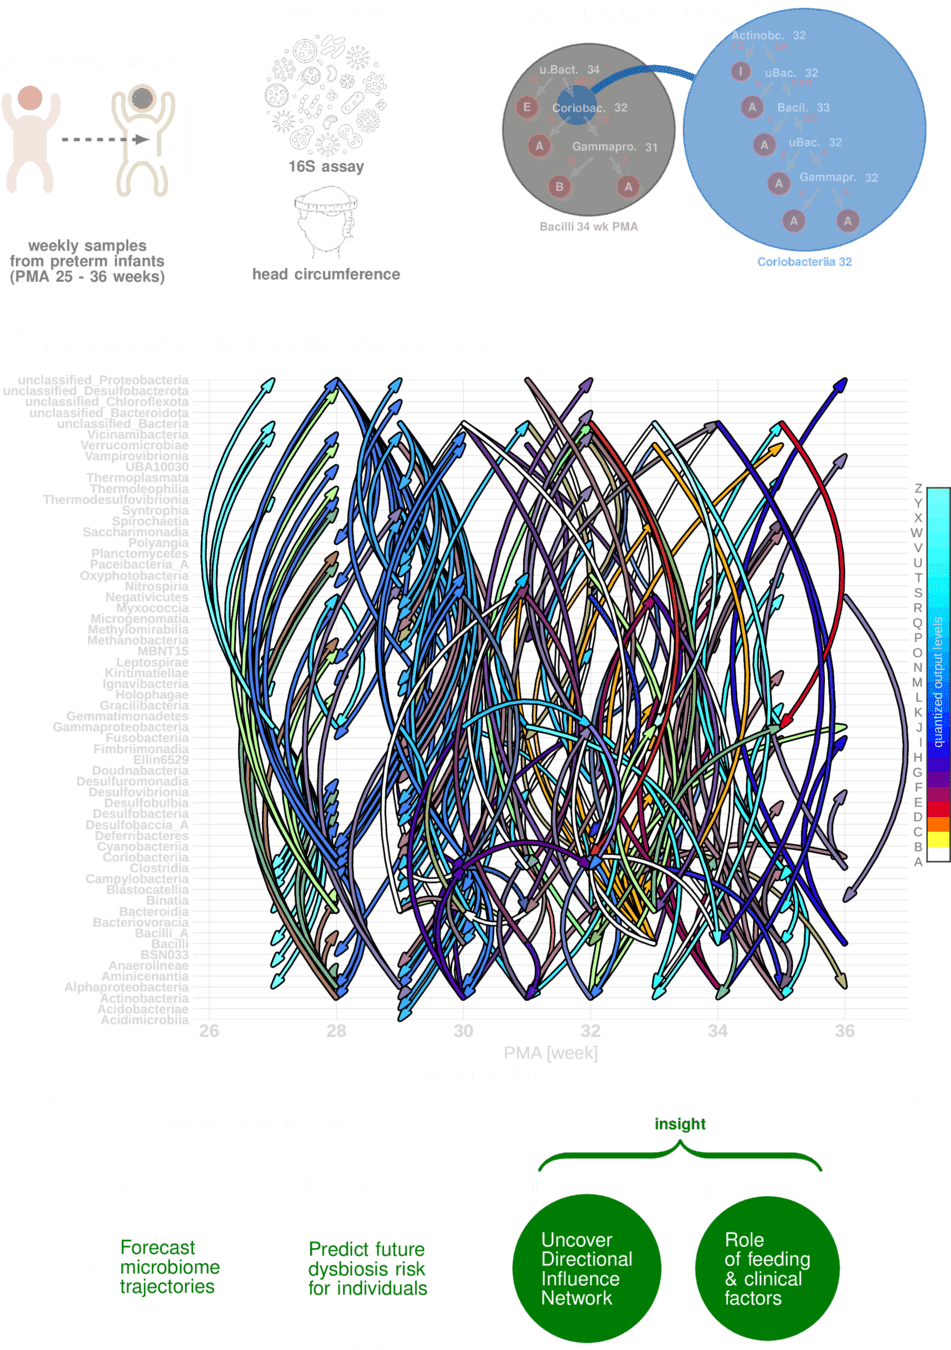
quantized output levels
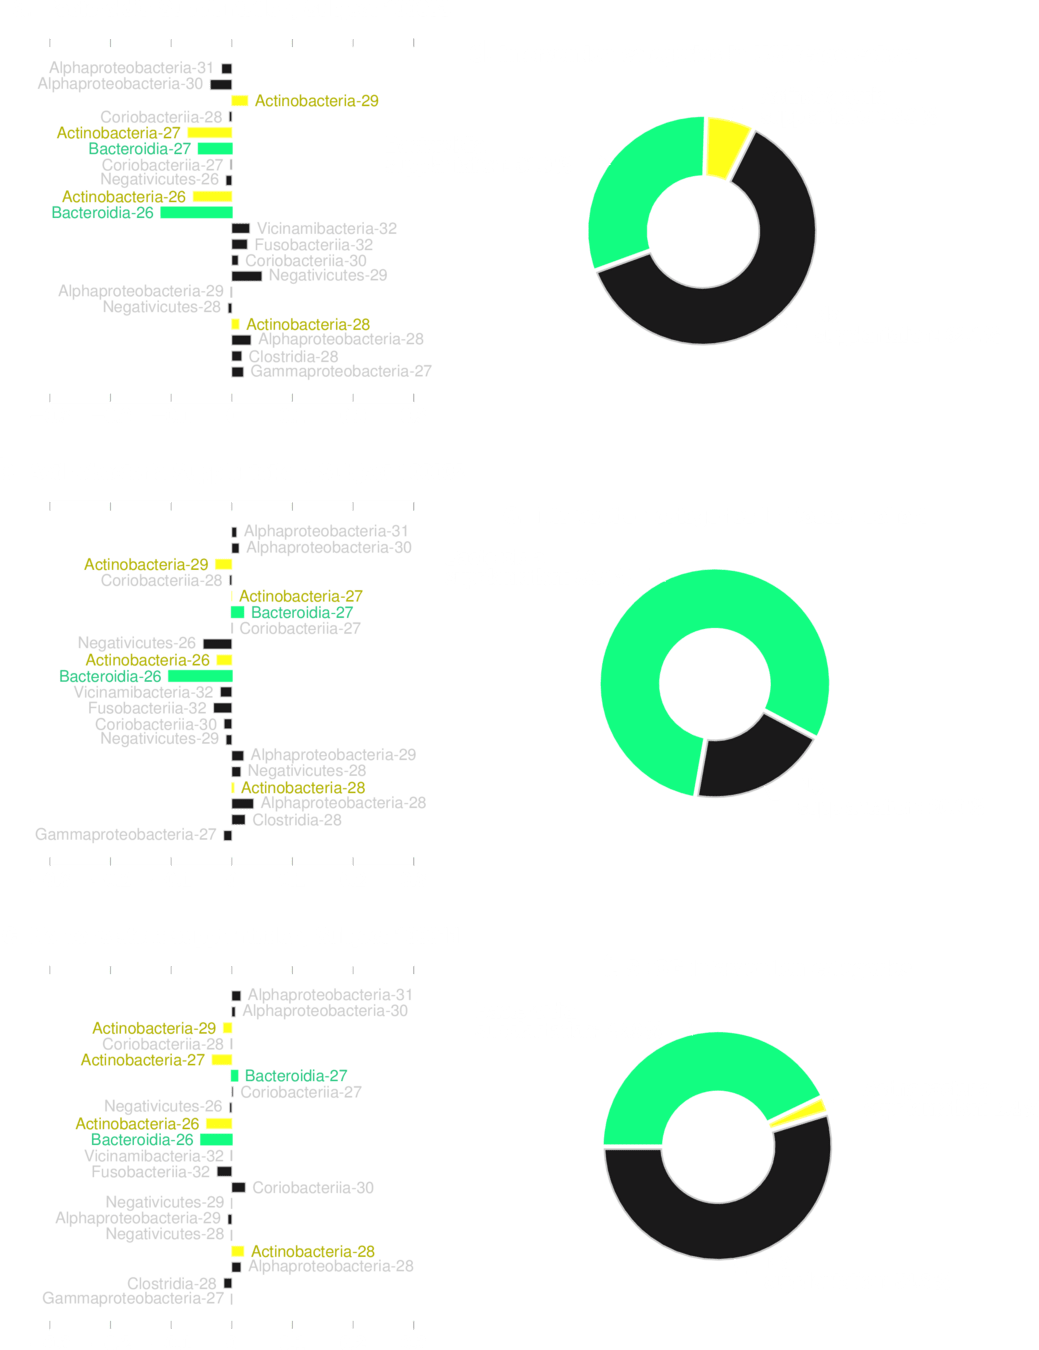
Dataset from Metabolomics Workbench
| Study ID | ST000923 |
|---|---|
| Study Title | Longitudinal Metabolomics of the Human Microbiome in Inflammatory Bowel Disease |
| Institute | Broad Institute of MIT and Harvard |
|---|---|
| Last Name | Avila-Pacheco |
| First Name | Julian |
| Submit Date | 2017-11-14 |
| Num Groups | 3 |
| Total Subjects | 546 |
| Num Males | 276 |
| Num Females | 270 |
| Analysis Type Detail | LC-MS |
State-of-art microbiome based Classification (~10 species) *
| IBD vs UC | 0.82 |
| IBD vs CD | 0.76 |
*Zheng, J., et al. (2024). Noninvasive, microbiome-based diagnosis of inflammatory bowel disease. Nature Medicine, 30(12), 3555–3567. https://doi.org/10.1038/s41591-024-03280-4
| IBD vs non IBD | 0.85 |
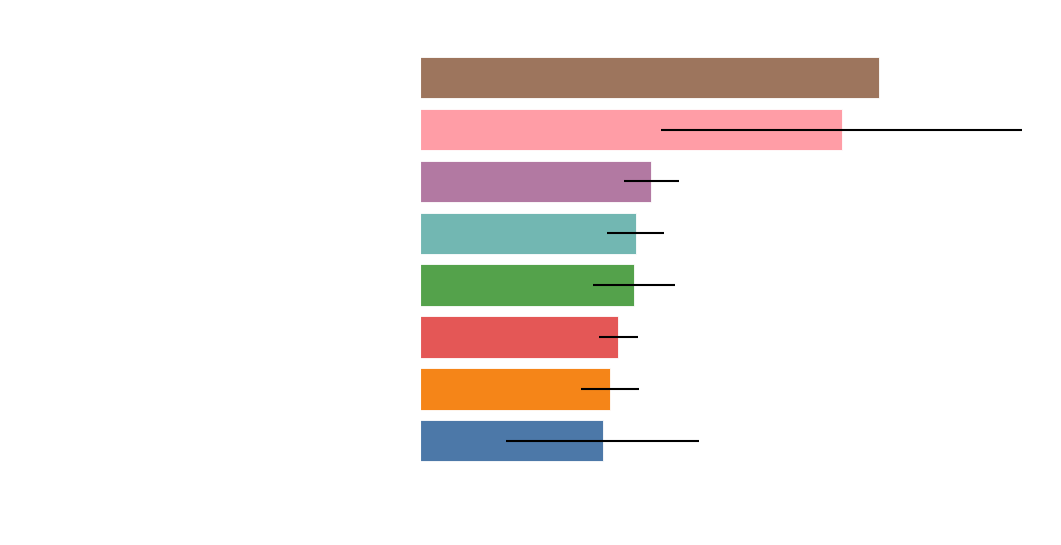
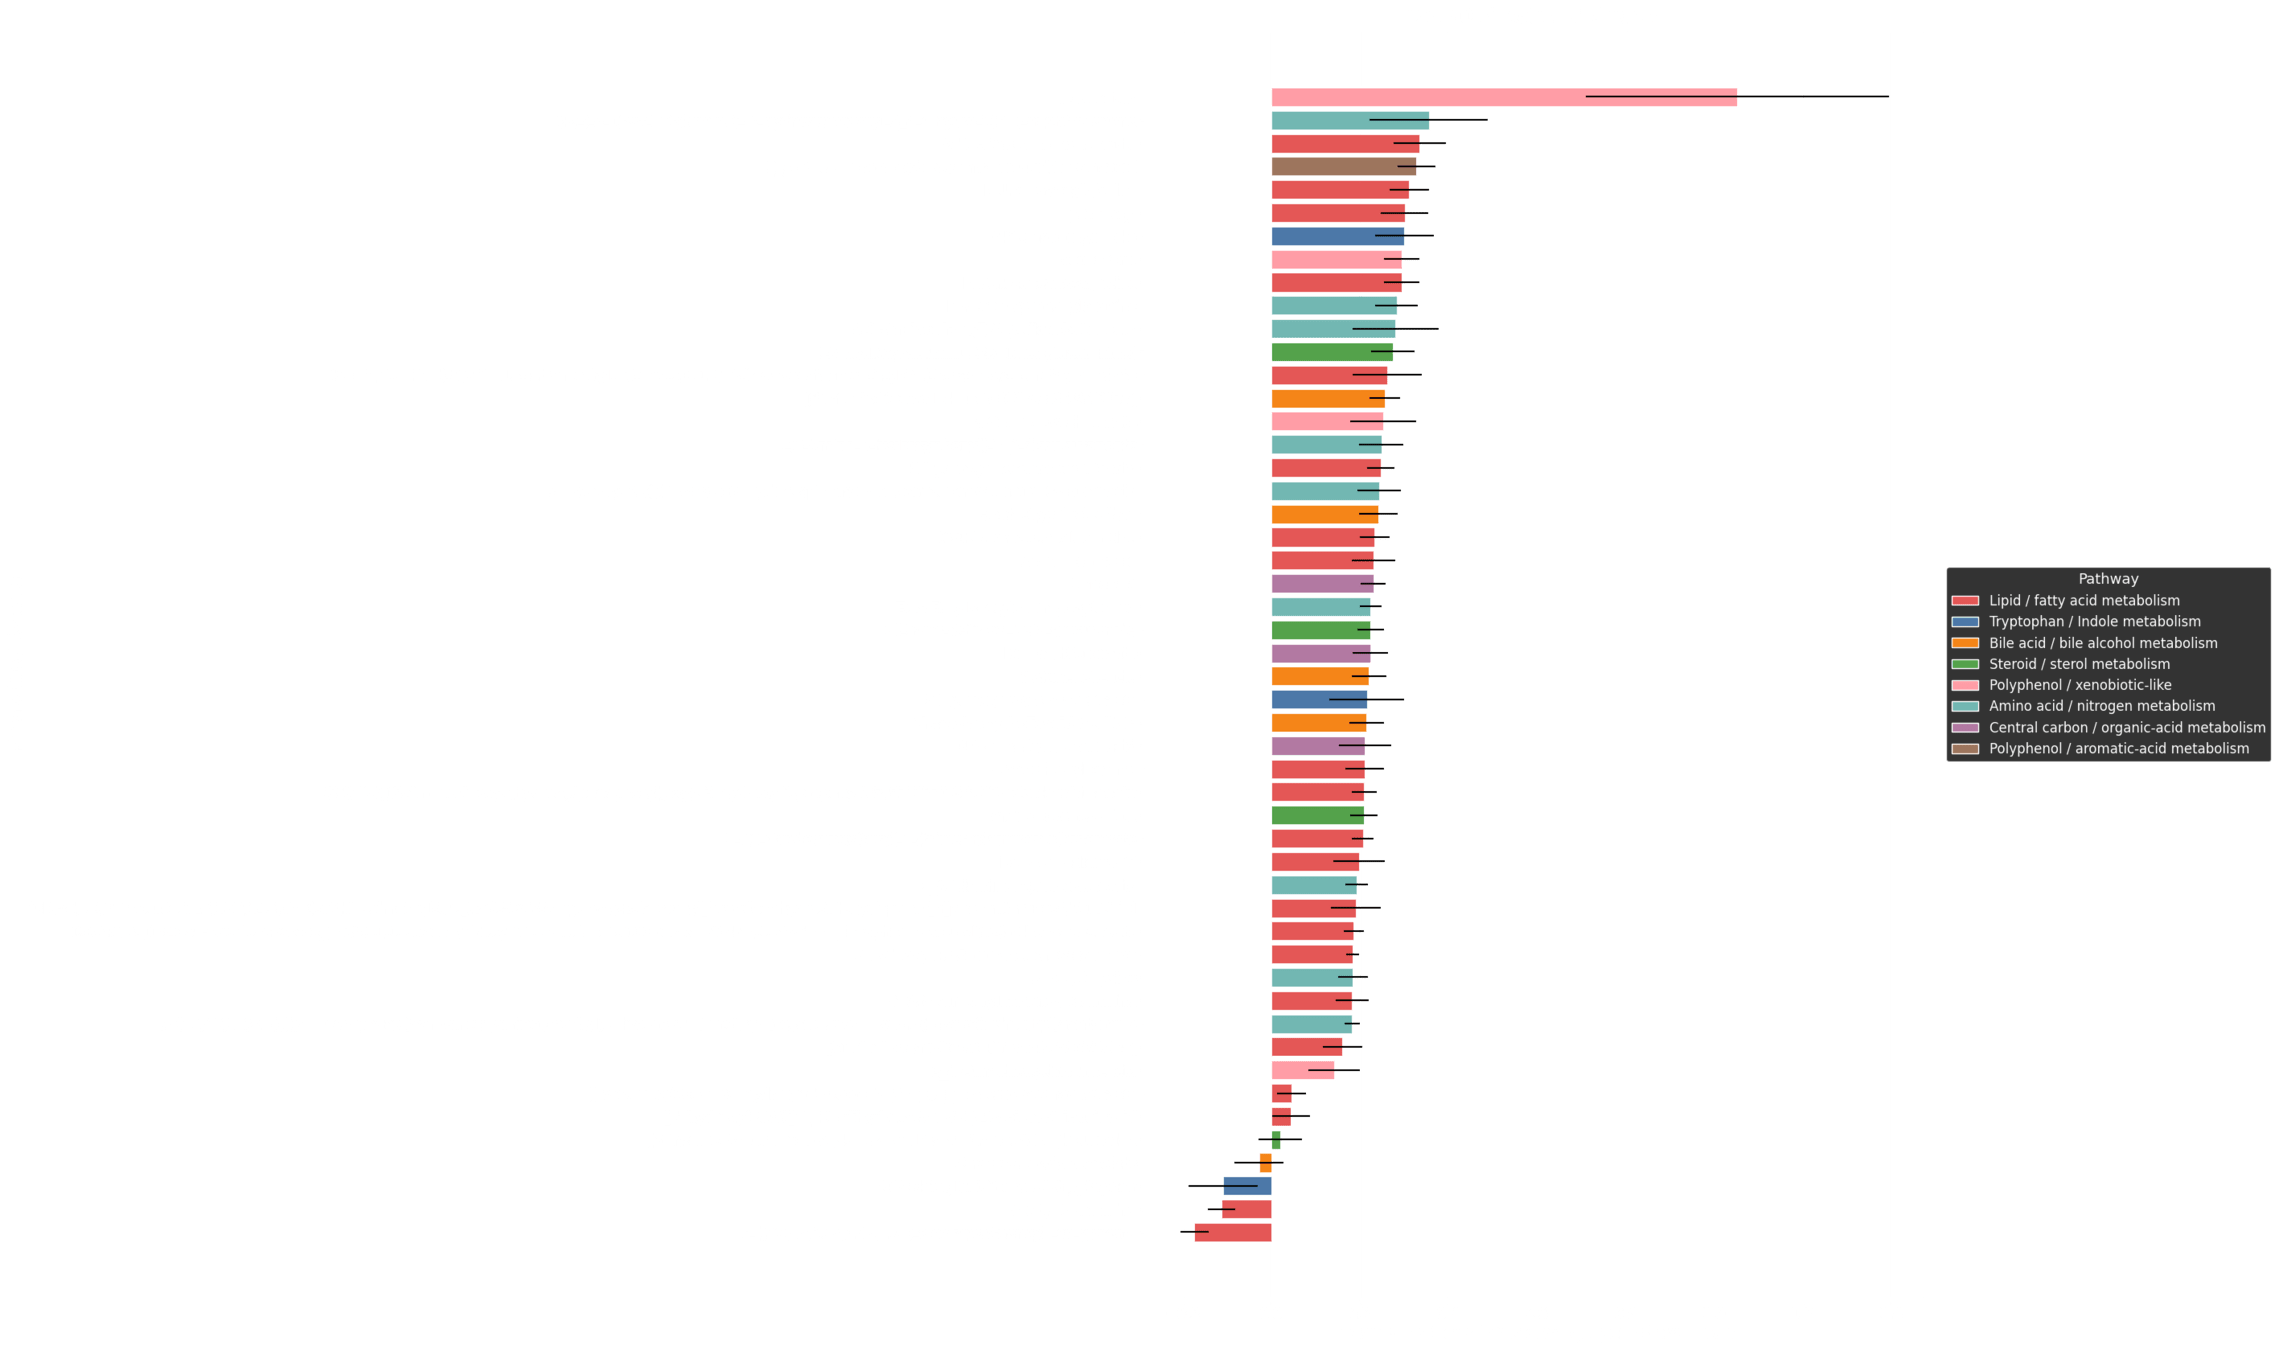
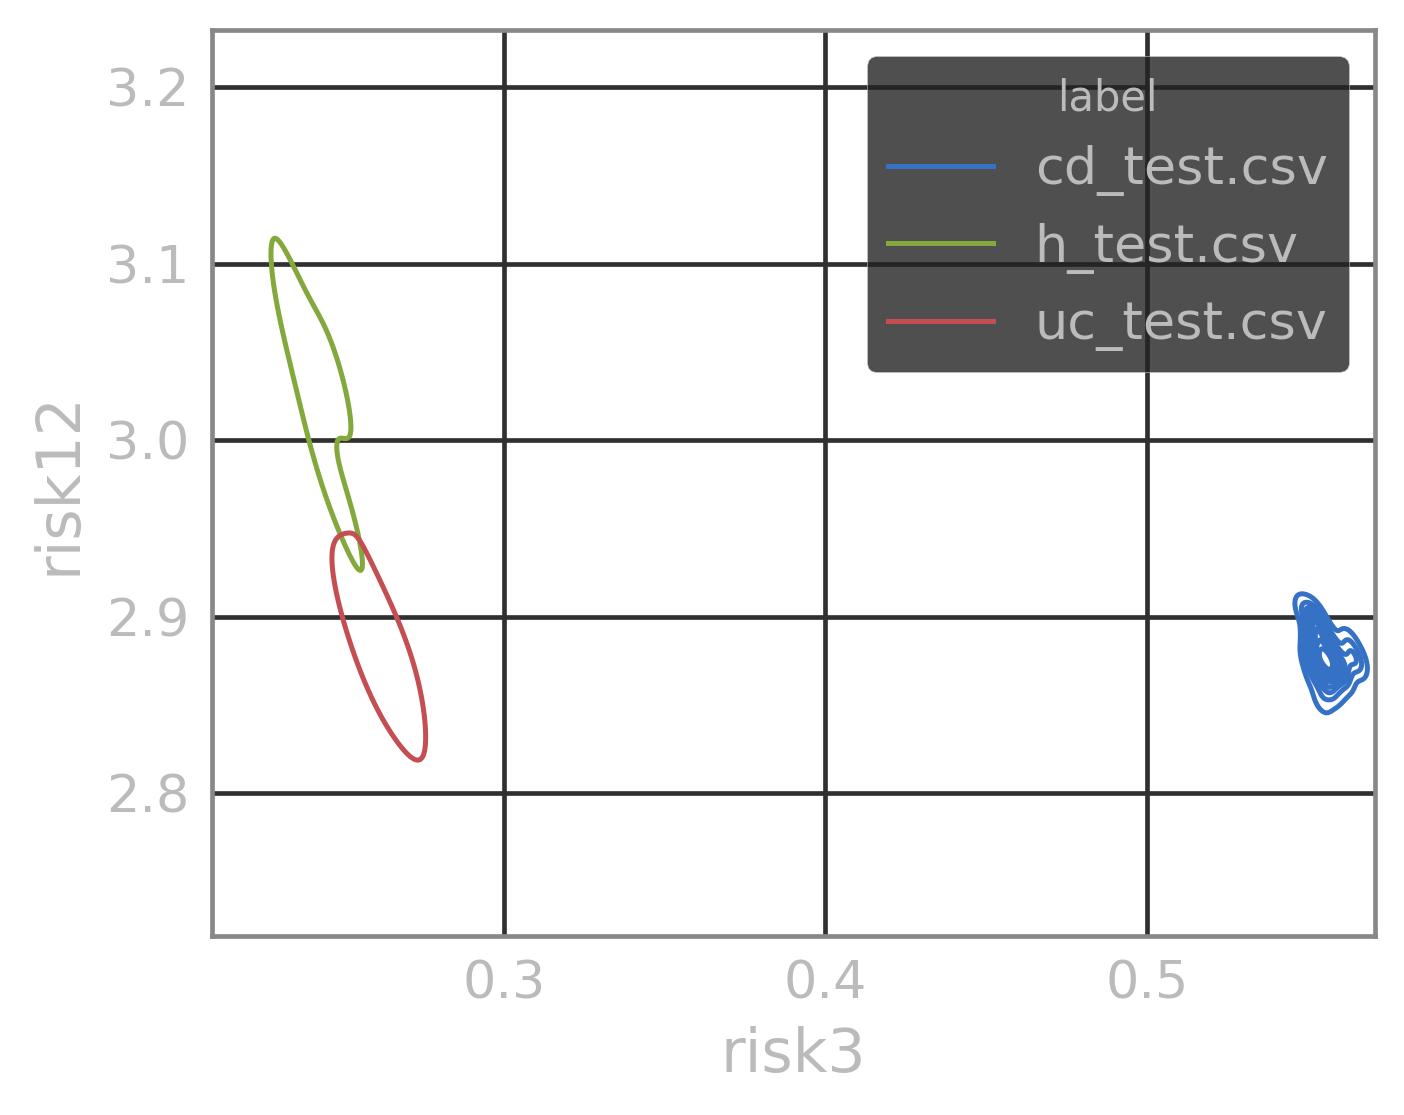
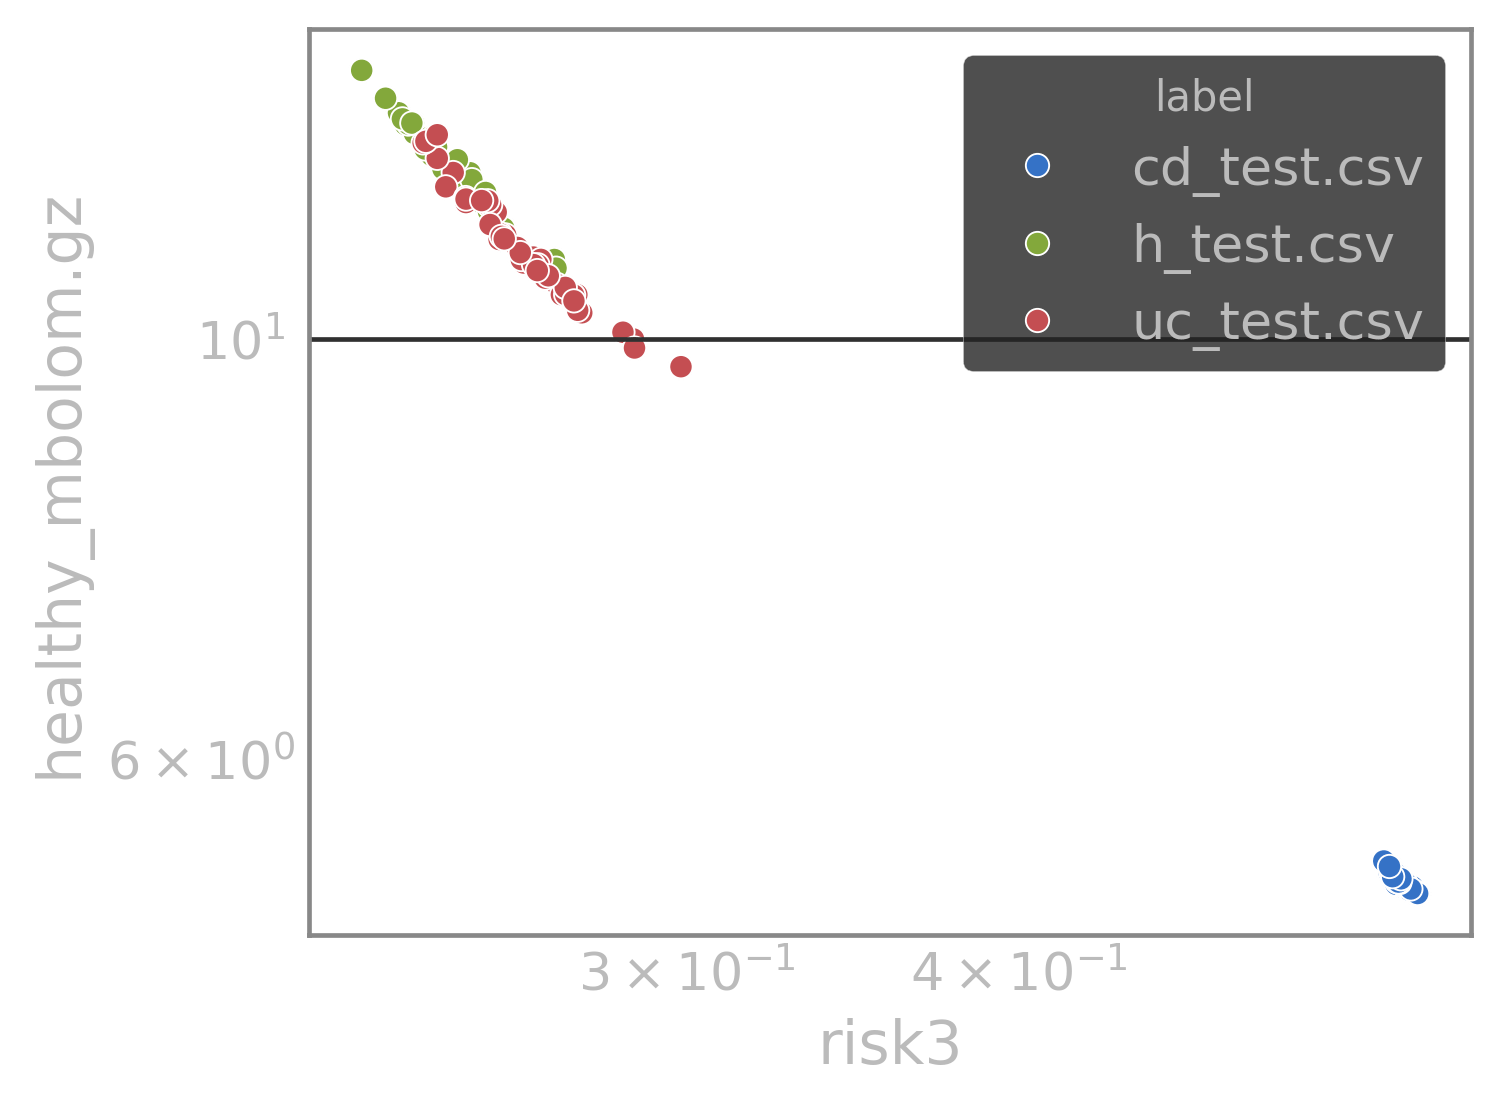
Gut-Metabolome based Classification (~36 metabolites) *
Application 2
LSM model
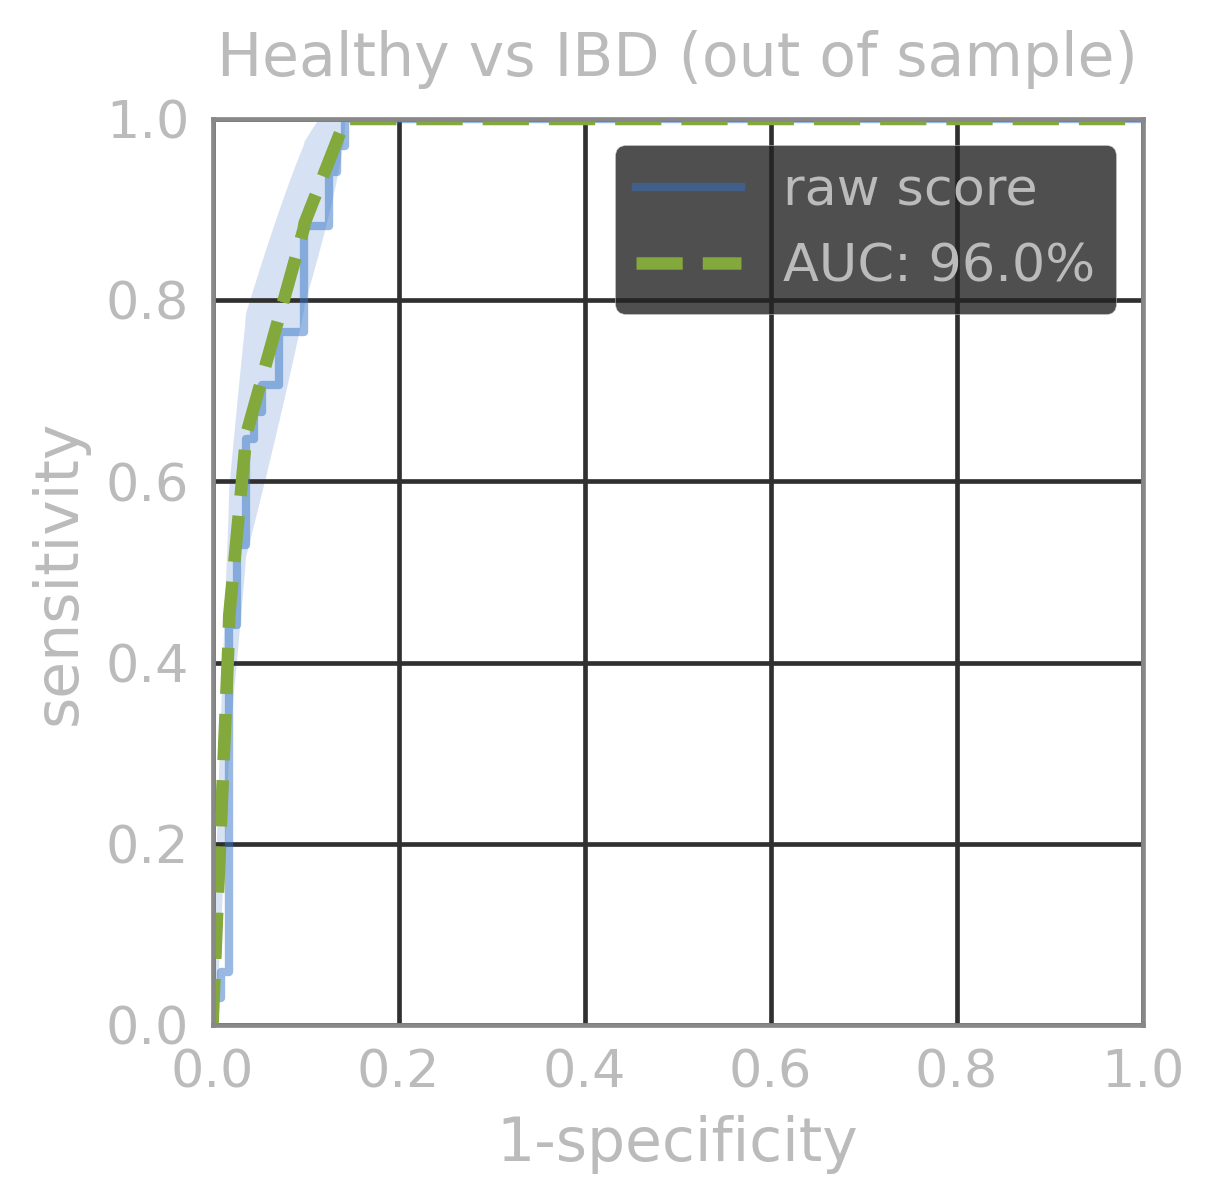
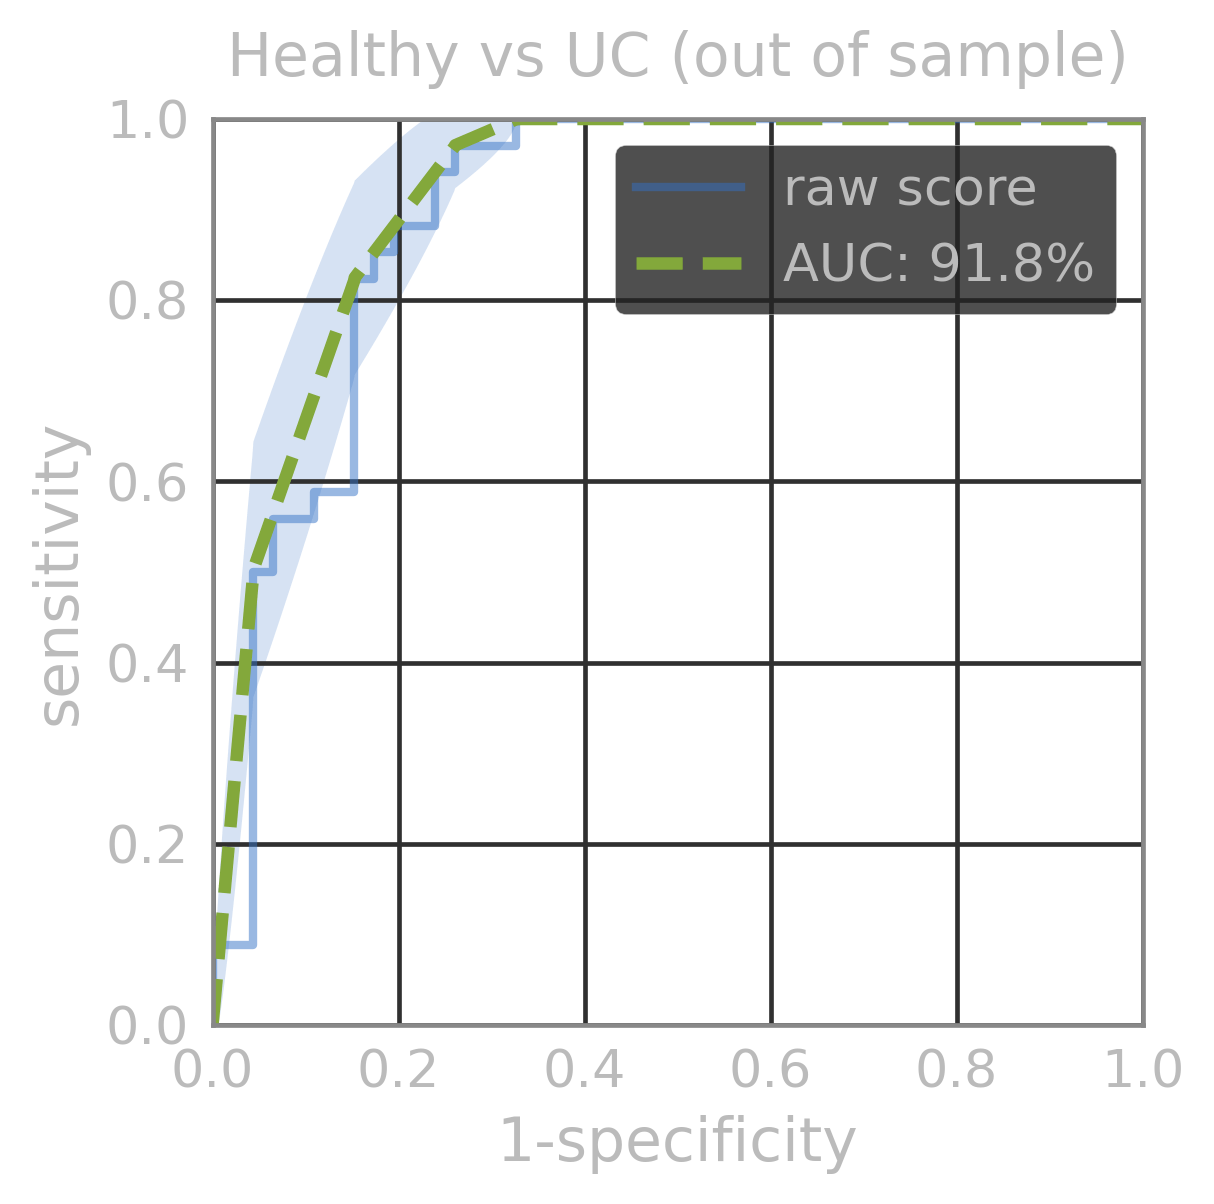
| AUC (out of sample) | |
|---|---|
| Healthy vs IBD | 96.1% |
| Healthy vs UC | 92% |
| UC vs CD | 99% |
| Healthy vs CD | 99% |
LSM model
| AUC (out of sample) | |
|---|---|
| Healthy vs IBD | 96.1% |
| Healthy vs UC | 92% |
| UC vs CD | 99% |
| Healthy vs CD | 99% |
Validating antigenicity predictions
Application to Equine Influenza dynamics
Corona Viruses and other emerging pathogens
Backup Slides
Lets train a machine learning model to recognize human vs swine Influenza HA proteins
High confidence generally
Data source: NCBI and GISAID HA sequences collected between 1999 and 2016 globally (HA protein fasta)
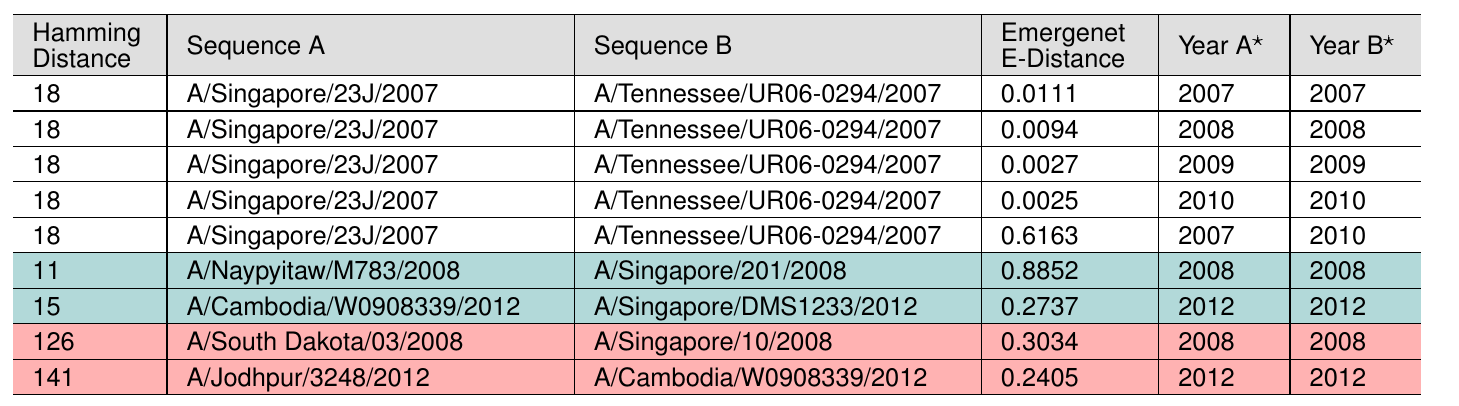
Same sequence/strain pair, but dfferent background (times of collection)
LSM distance
Small edit distance (5-8) and large LSM distance
Same subtype doesnt need to pre-exist in humans
Very few observations suffice in the animal circulation
Fewer strains increase quantifiable uncertainty
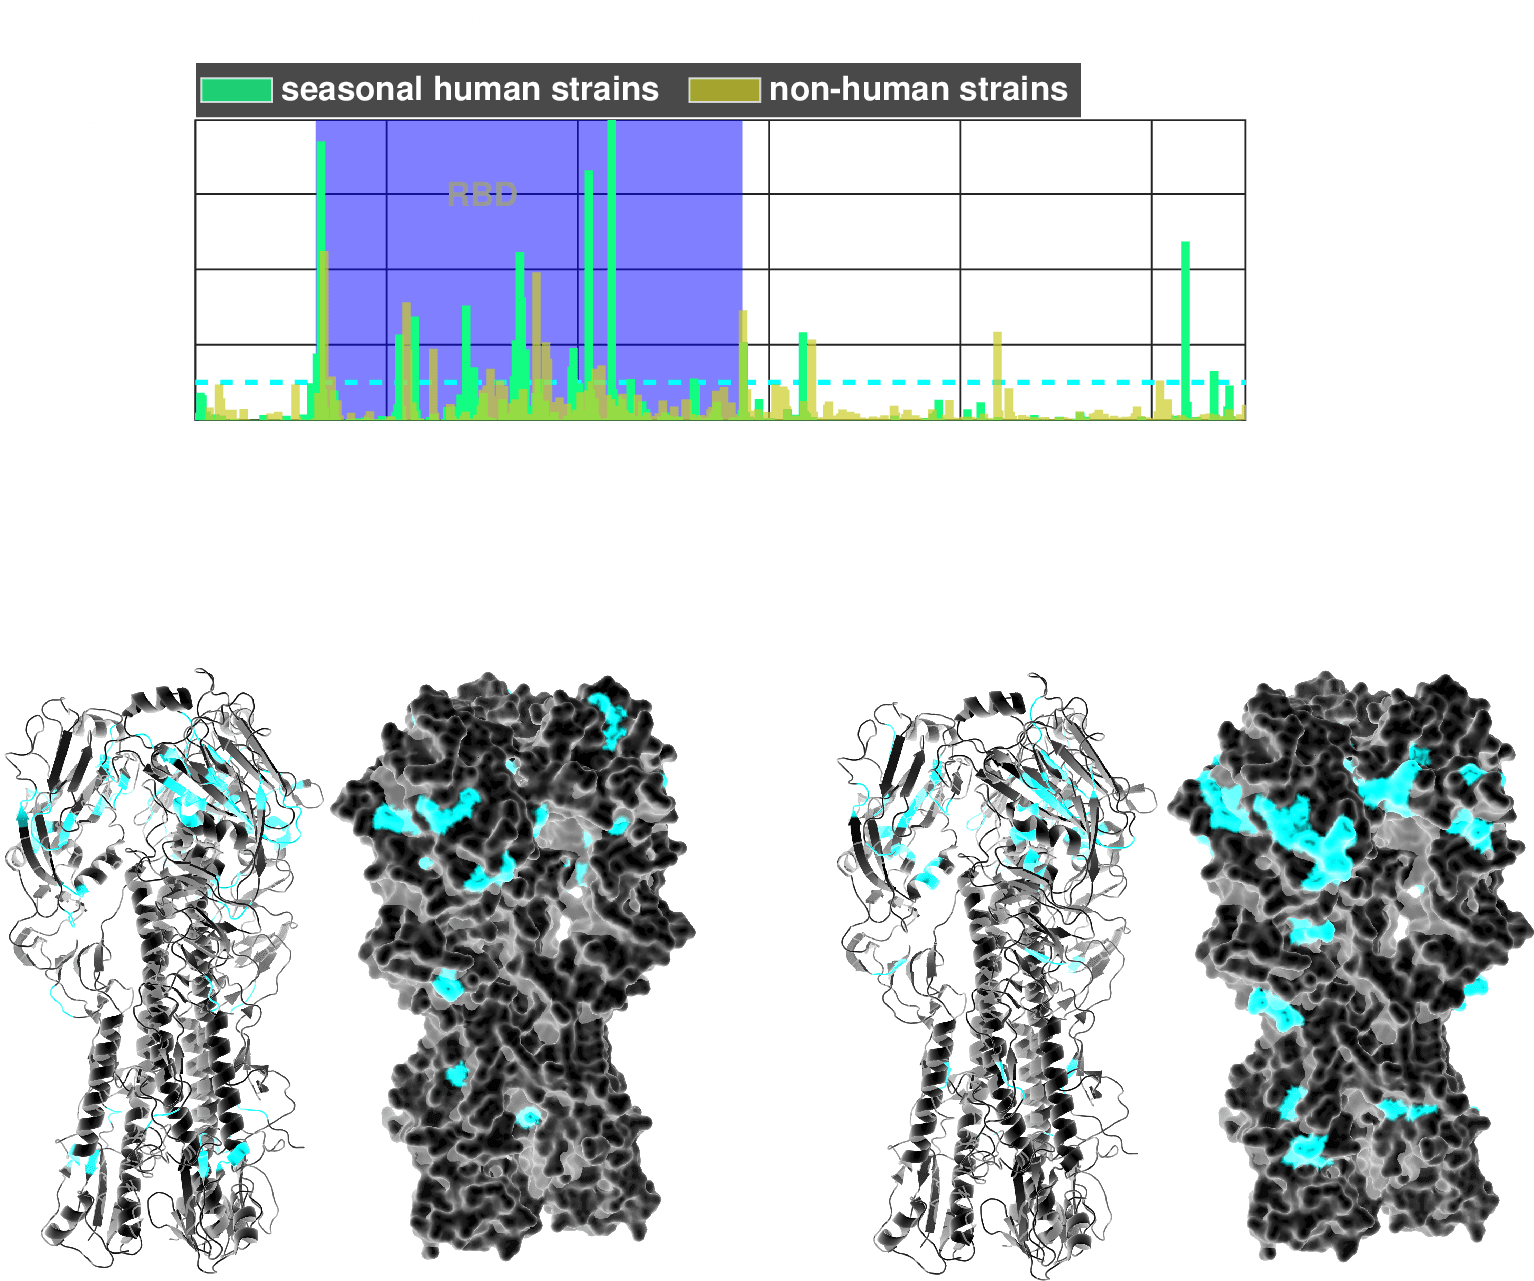
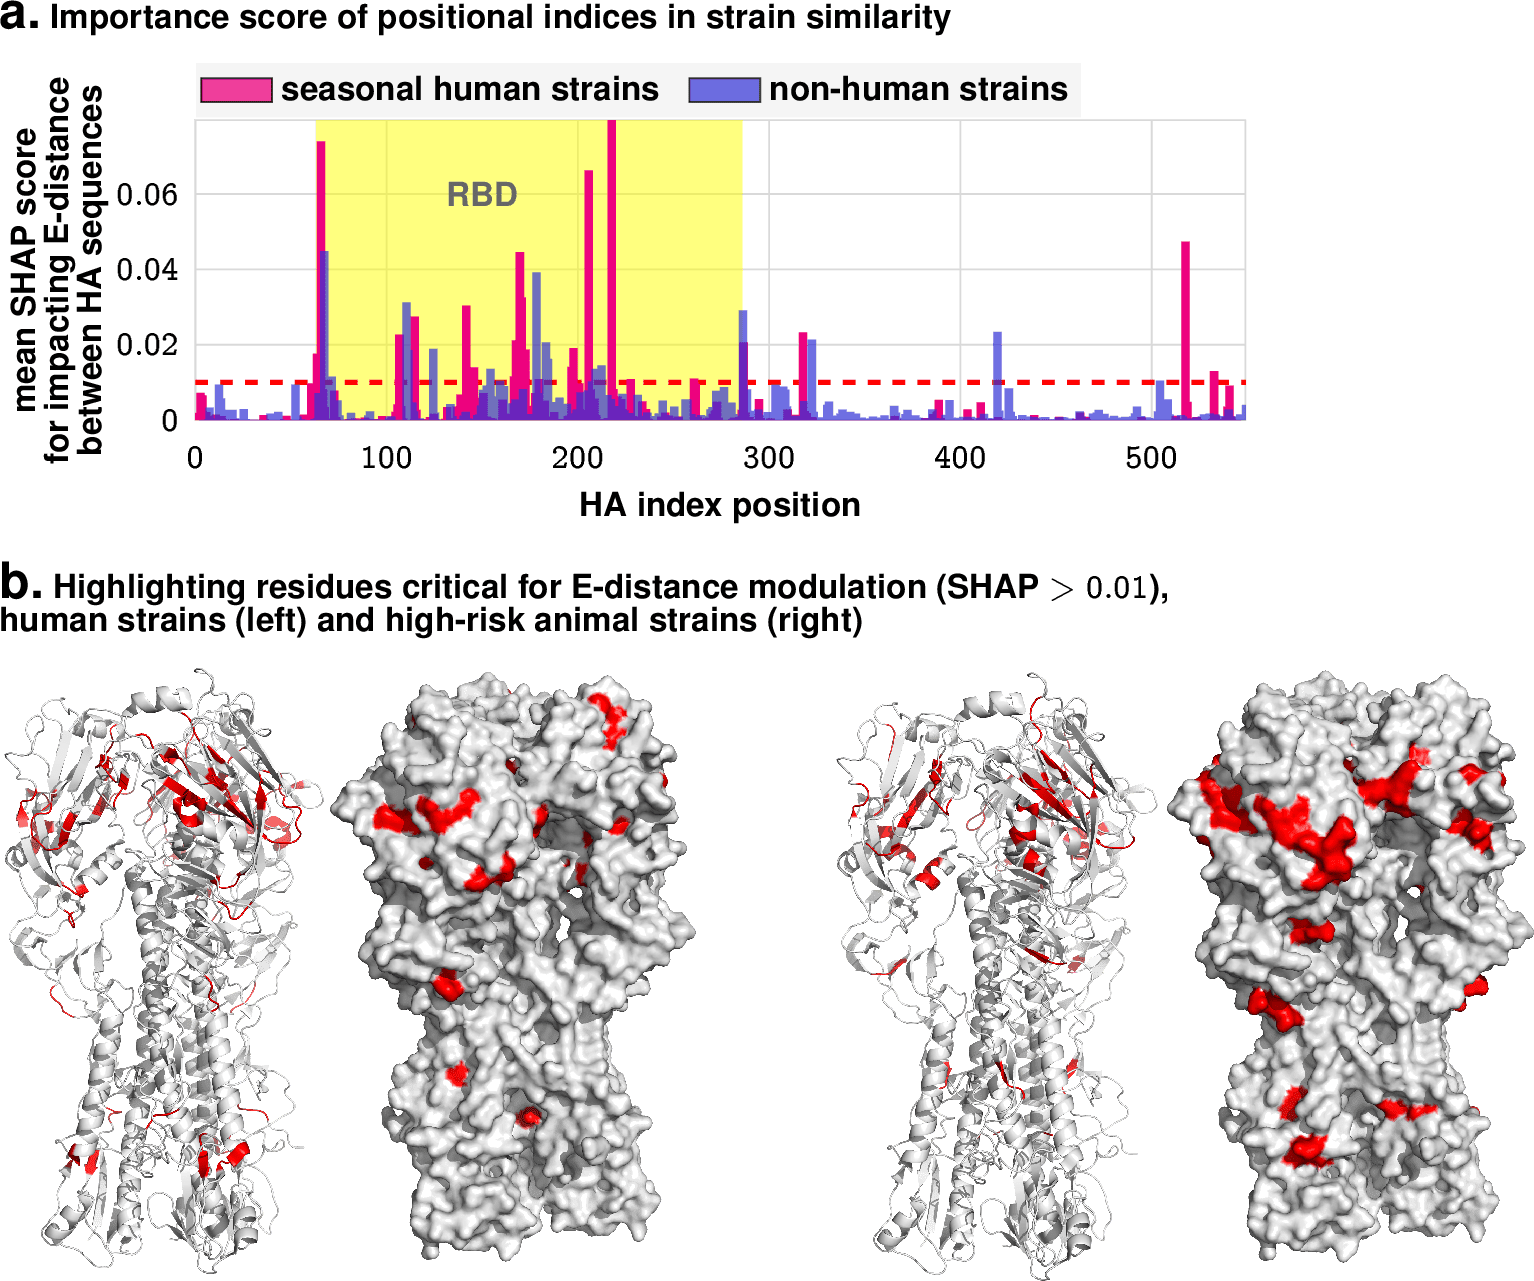
Estimate how LSM distances perturb as we perturb individual sites
By Ishanu Chattopadhyay