Pneumonia dynamics
in bighorn sheep
Kezia Manlove
Dissertation defense
September 14, 2016


Pete
Raina Plowright
Paul Cross
Frances Cassirer


Tom Besser
Resource challenges in wildlife disease
Low public concern
Mortalities in captivity
Sub-optimal diagnostics
Rare longitudinal datasets
Rare post-mortems


Overarching challenge
Learn quickly from available data
Dissertation goals
1. Save sheep
2. Come up with a better plan
Introduction
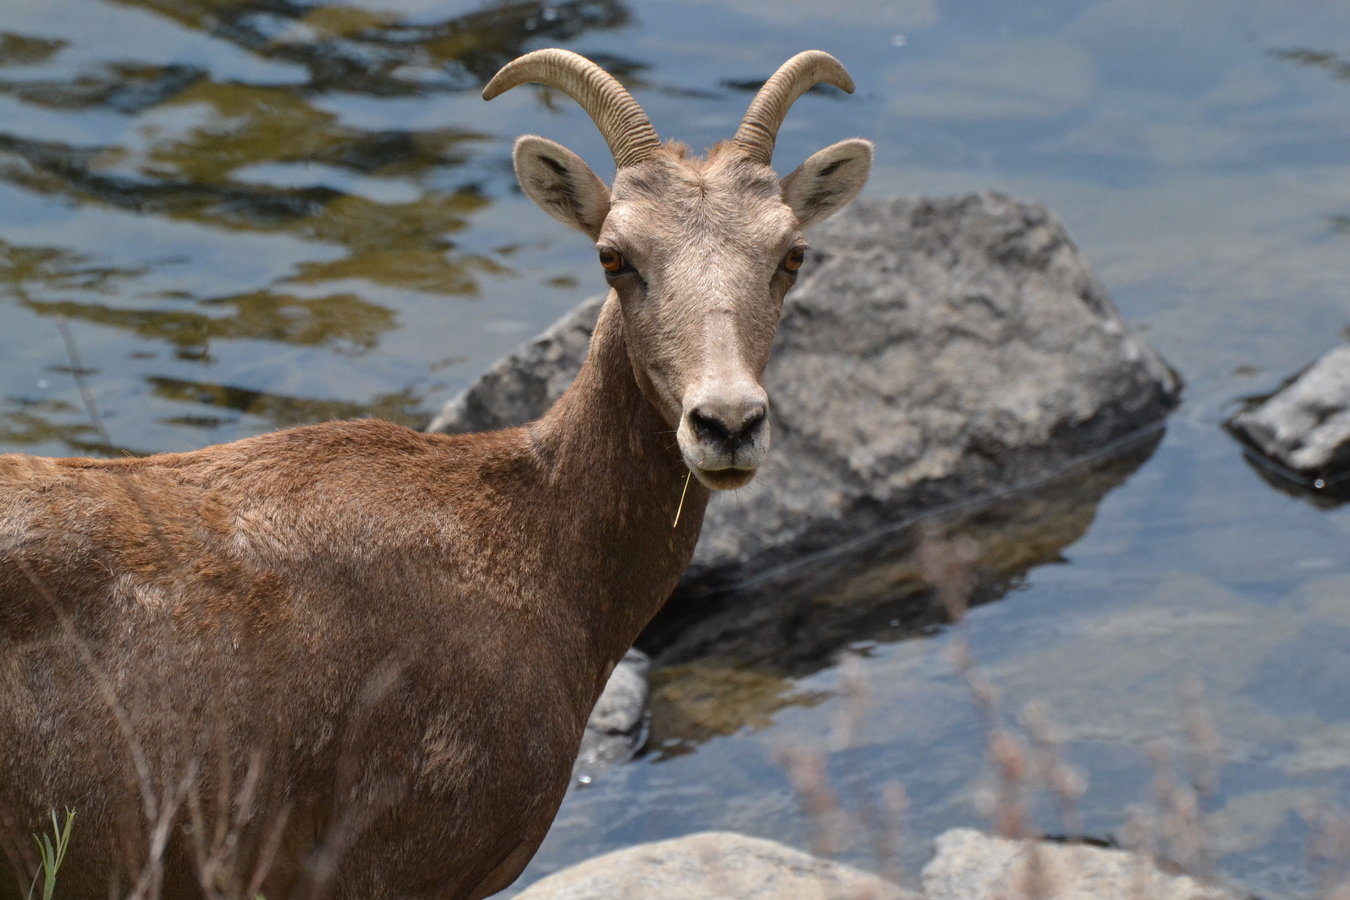
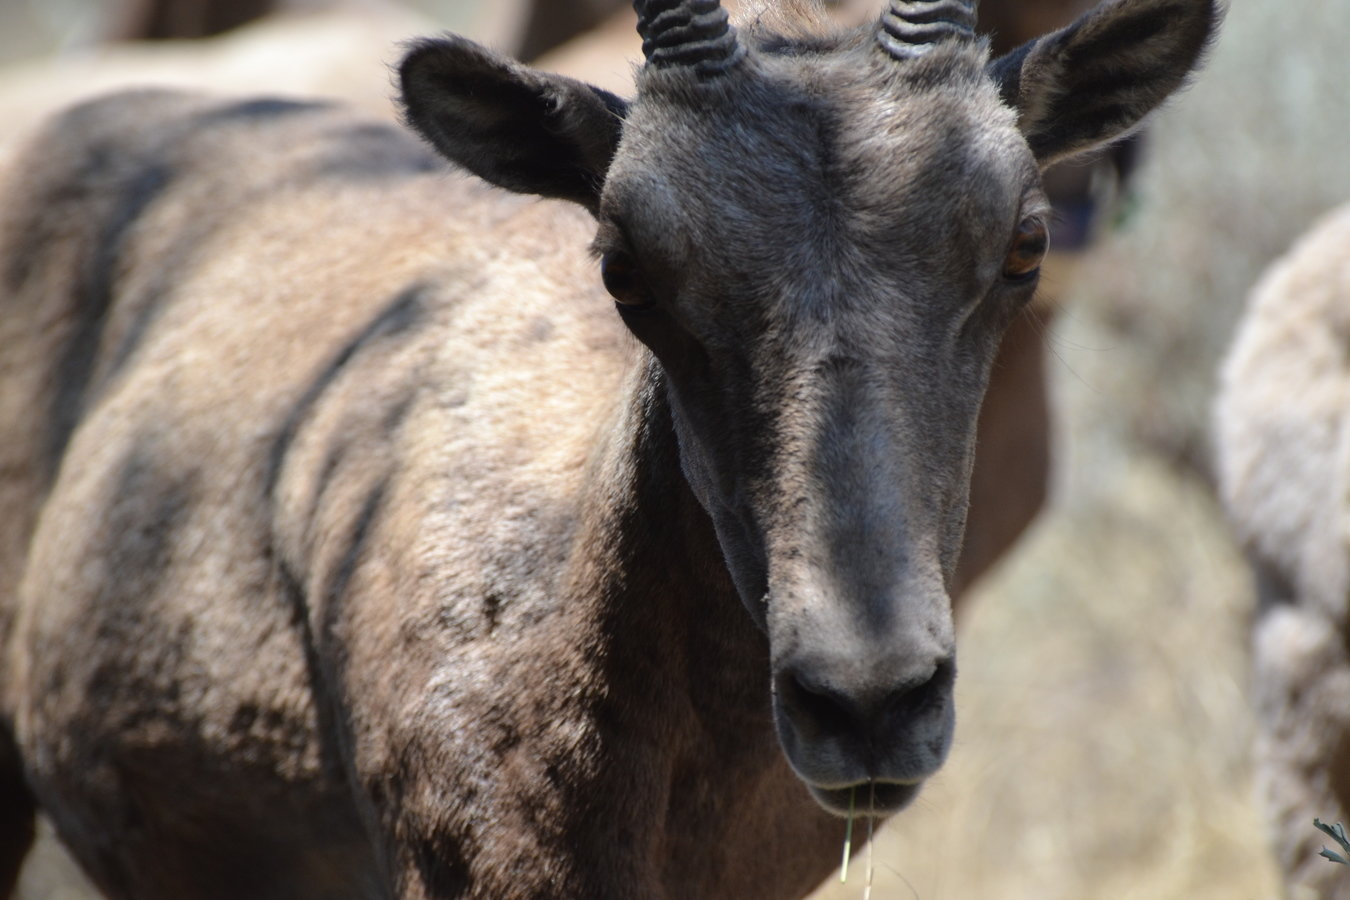
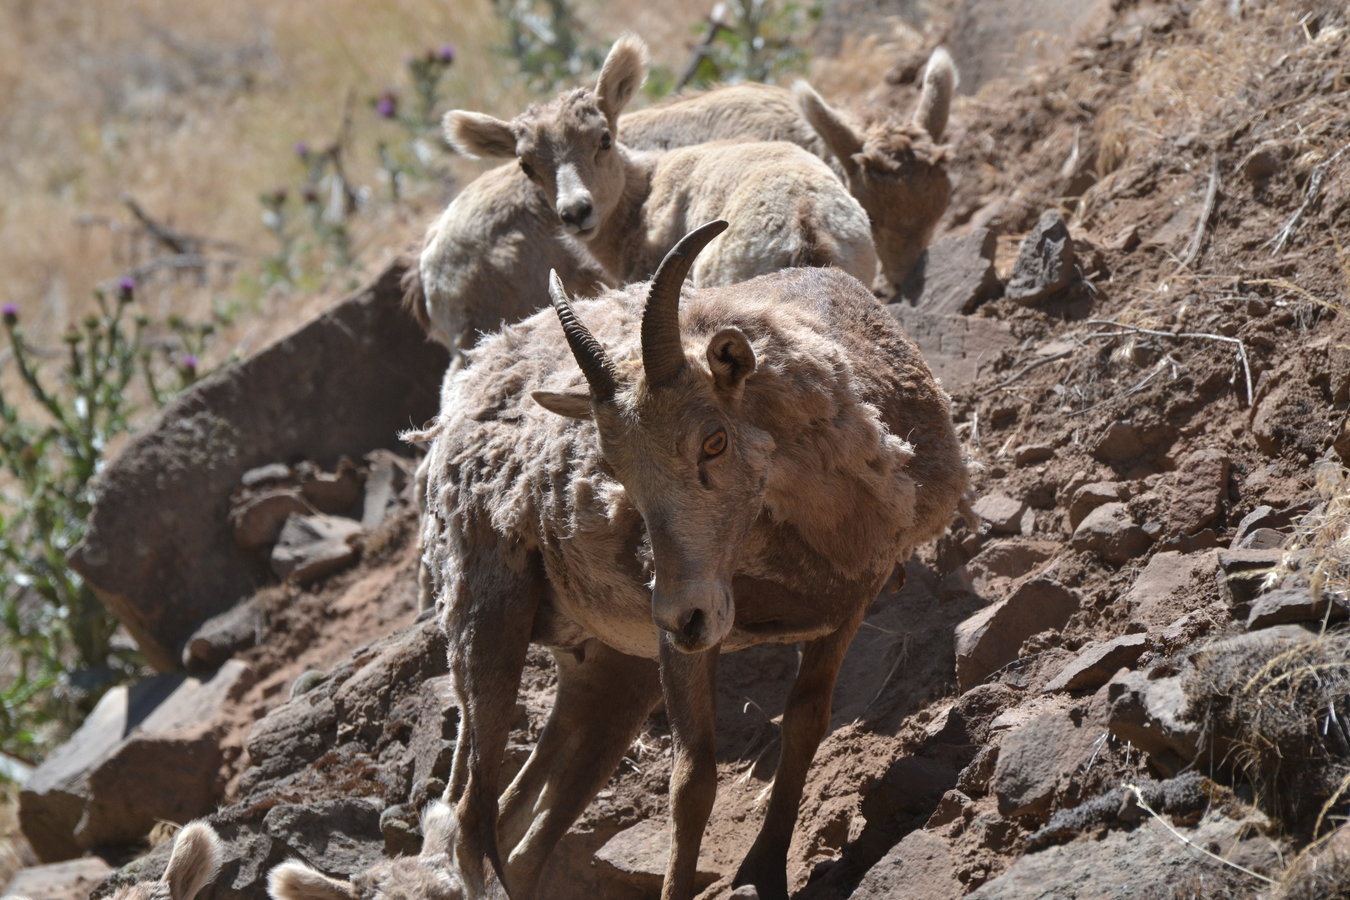
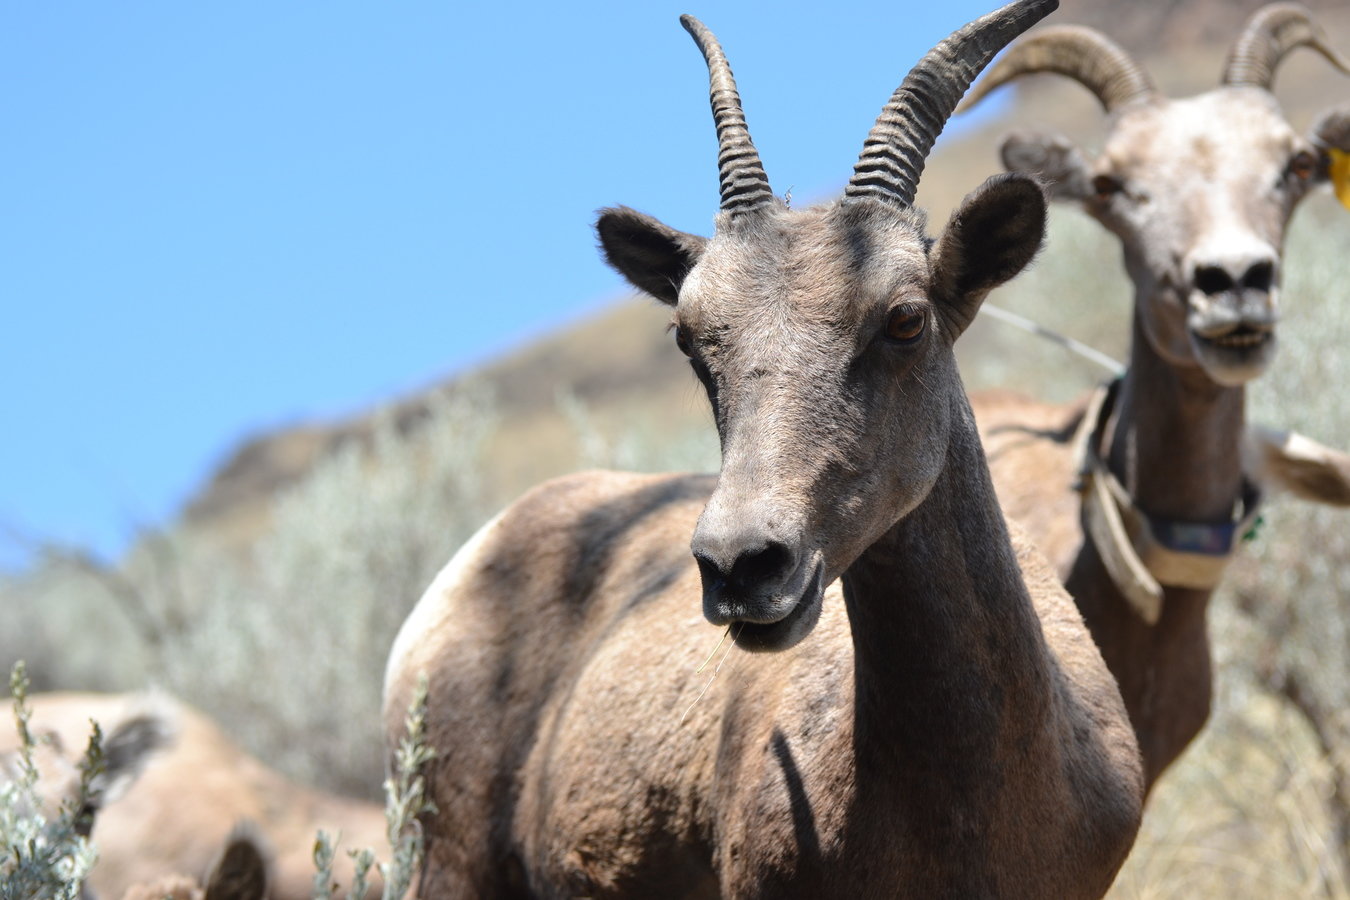
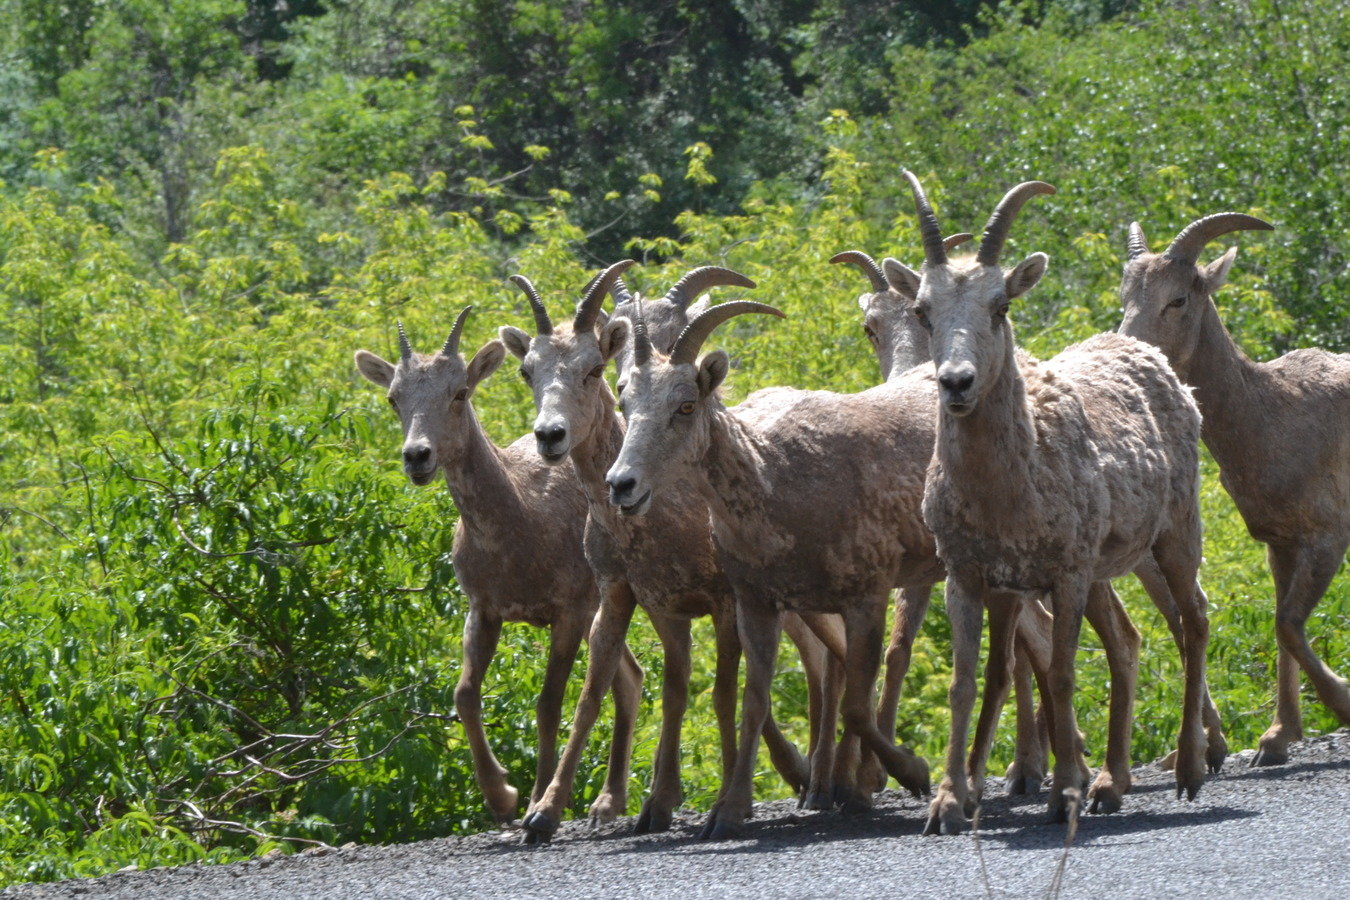
Bighorn sheep pneumonia
Bighorn life history and ecology
long-lived, large-bodied
sexually dimorphic/live in sexually segregated groups
breed during fall rut
primiparity at age 2 (usually)
~170-day gestation period
rarely twin
diverged from Old World sheep ~ 5.6 mya


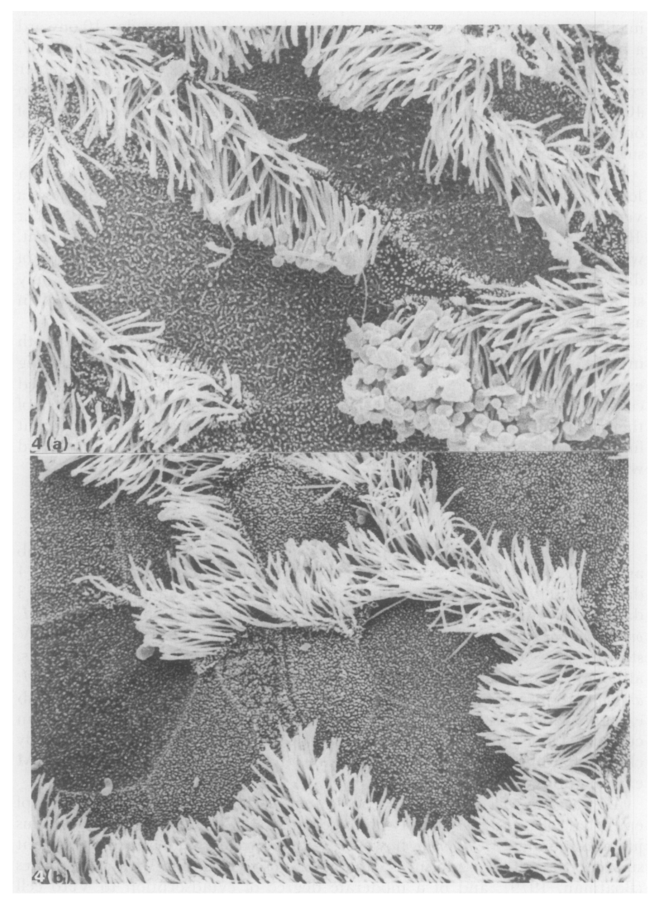
Healthy cilia
Cilia 10 dpi
Jones et al. (1985) Jo Comp Pathol

Besser et al. (2013) Prev Vet Med
Etiology and disease progression
Mycoplasma ovipneumoniaeExposure
Carriage
Upper
respiratory
tract
Lower respiratory tract
Clearance
Downward invasion
LRT
clearance
Between-host disease dynamics
Carrier
May 1
Sept 1
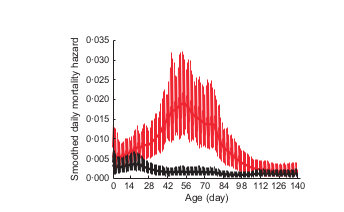
Daily lamb mortality hazard
Cassirer, Manlove et al. (2013) Jo Anim Ecol
0.035
0.000
Years with transmission
Years without transmission
Bighorn sheep status
Source: Wild Sheep Foundation
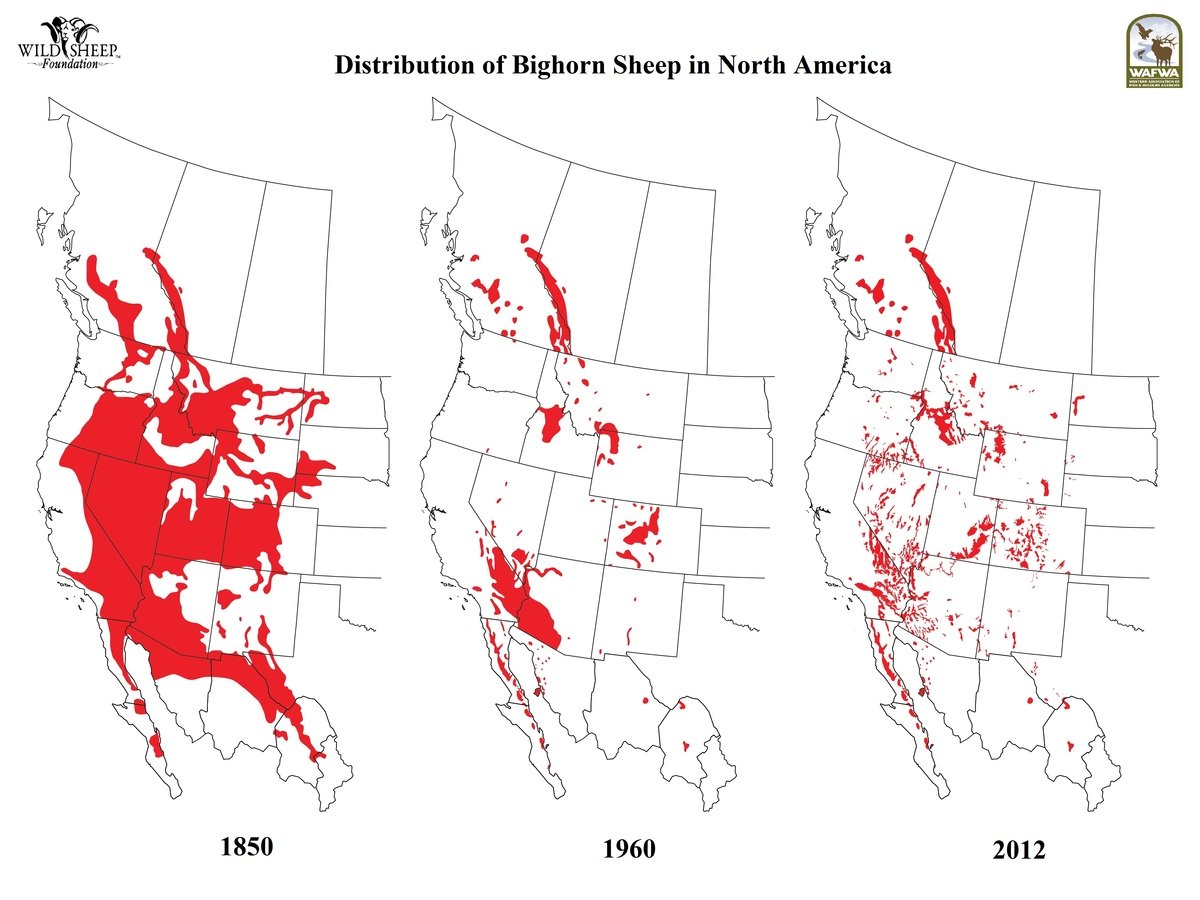
Hells Canyon


Early analyses
Some protective immunity in adults...

Plowright, Manlove et al. (2013) PLoS One
More exposure = lower risk

Raina Plowright
...but this does not transfer to lambs
Frances Cassirer
May 1
Sept 1
Daily lamb mortality hazard
Cassirer, Manlove et al. (2013) Jo Anim Ecol
0.035
0.000
Years with transmission
Years without transmission
Limited cross-stain immunity
Cassirer, Manlove et al. (in press) Jo Wildife Manage


Photo: Jo Ohm
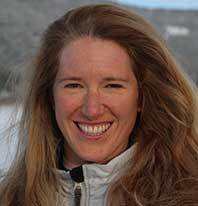
Novel strain introduction into herd


Mike Lerch
Jo Ohm


previously infected
Frances Cassirer
Observed; no symptoms
Observed with symptoms
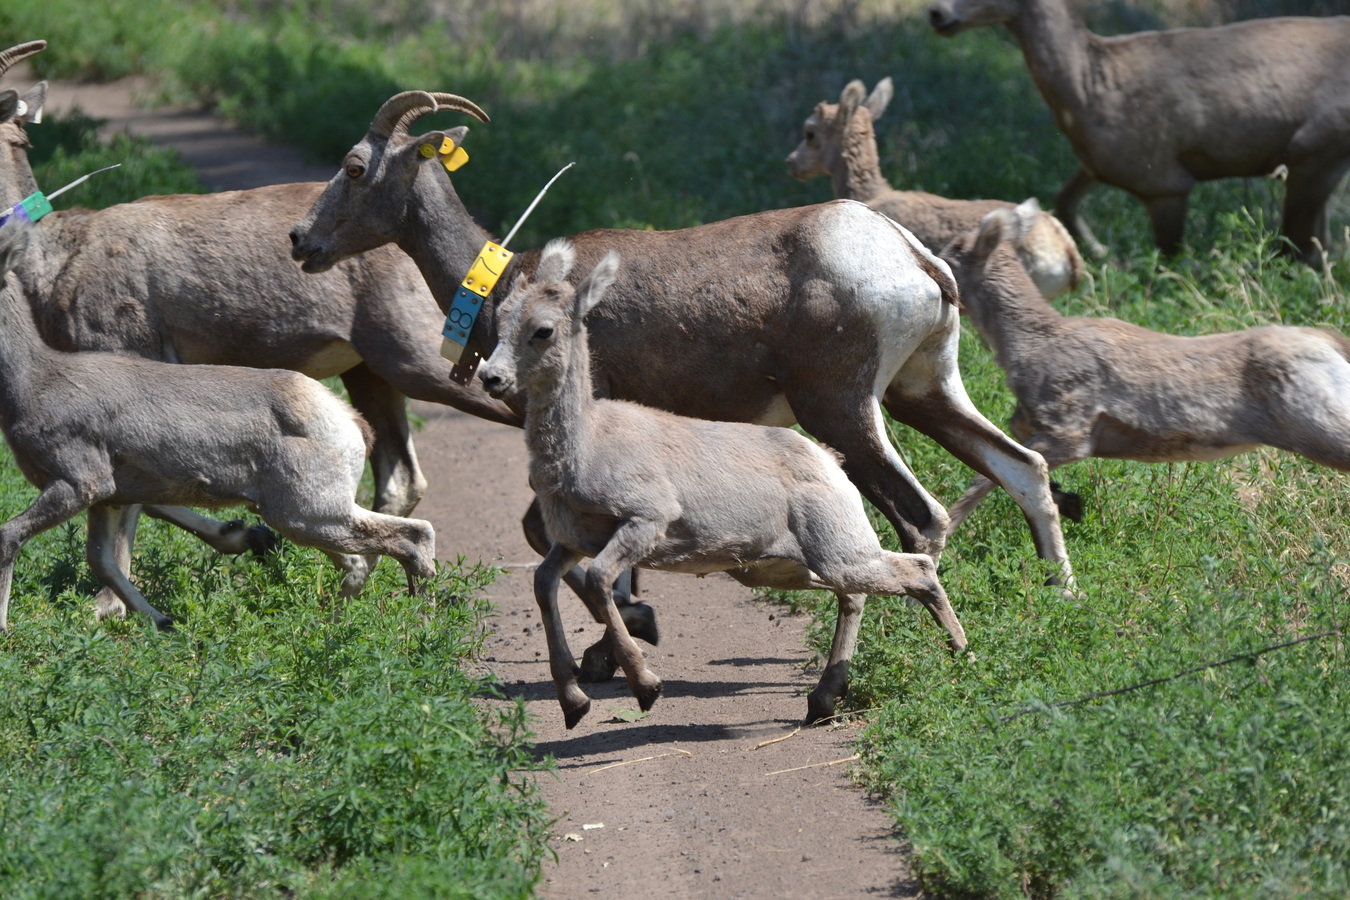
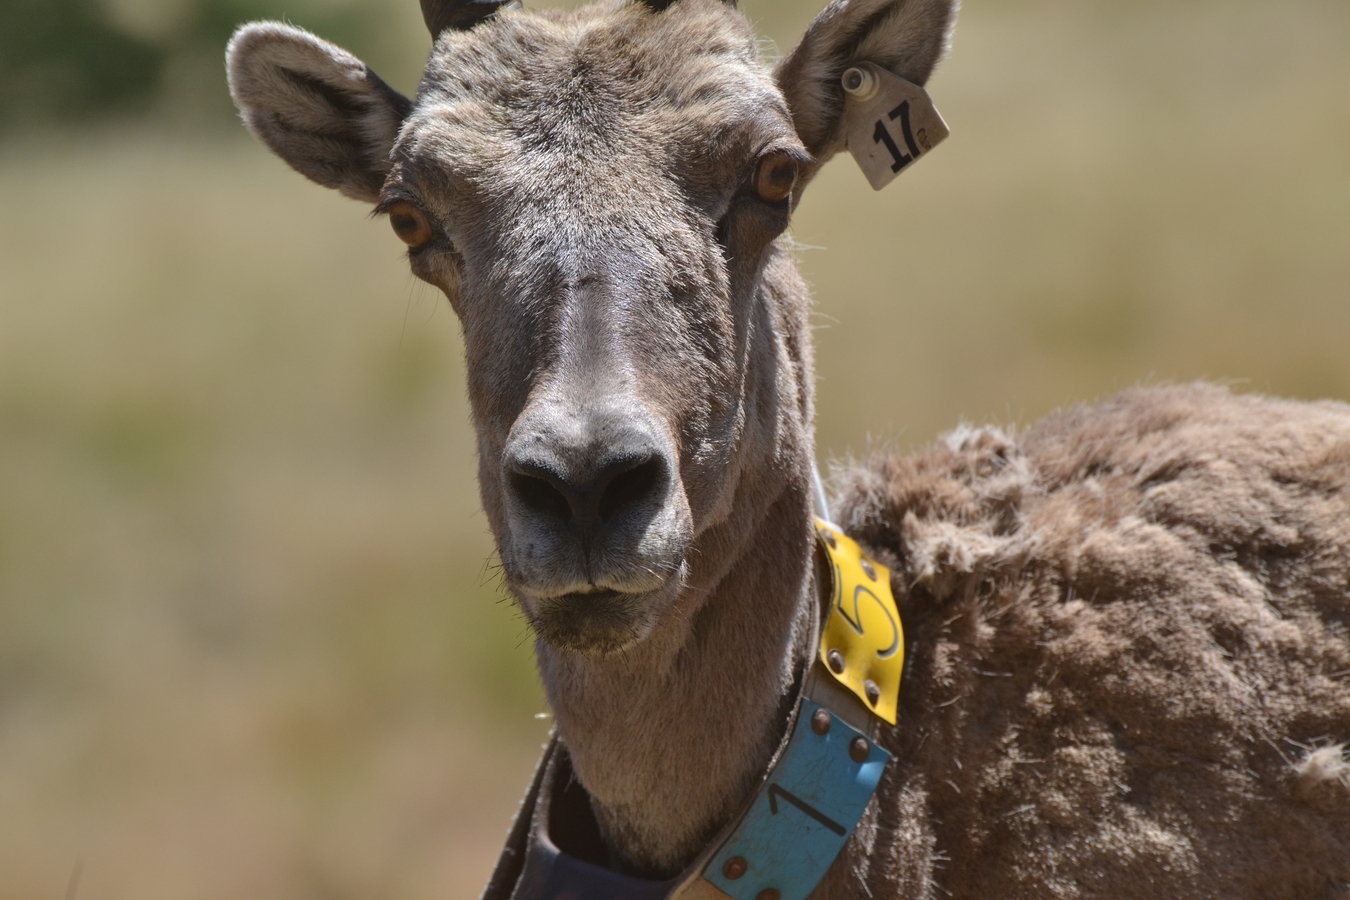
Carriage and infectious period
Plowright, Manlove et al. (in prep)

Lostine sheep trap
Raina Plowright

"Chronic carriers"
"Resistant"
Frances Cassirer
Carriers are crucial for
pathogen persistence
Animals sampled 3 or more times
My Questions
1. How do die-offs and persistent disease compare in terms of population effects?
2. Is transmission frequency- or density-dependent?
3. Do all infected animals pose similar risks to lambs?
4. What would have made learning more efficient?
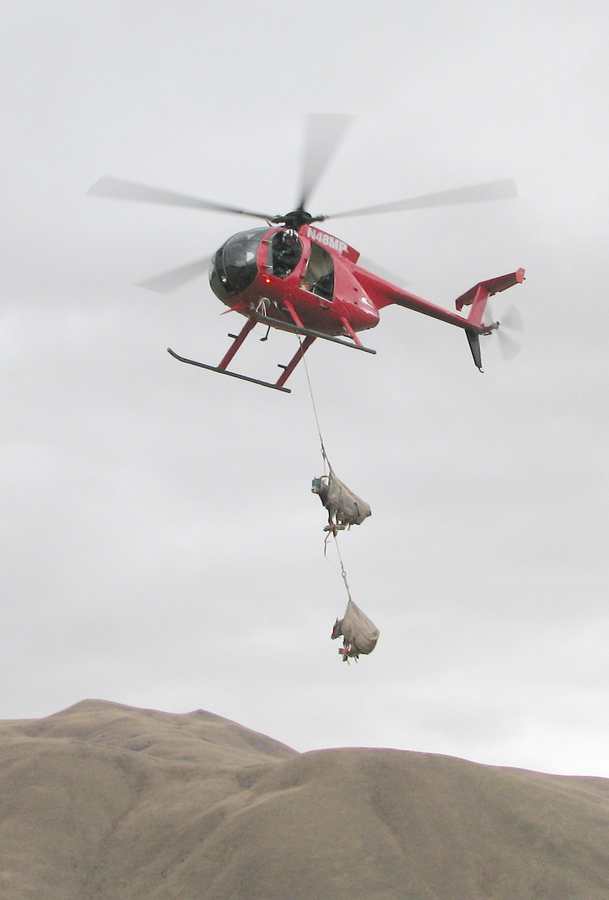
Field work

~4500 locations
(10% of full dataset)
4 states / 4 pops/ 4 years
~1130 focal follows
2013: Mike Lerch
2014: Jo Ohm

2015-2016:
Logan Weyand
1. How do die-offs and persistent disease compare?


Immediate fade-out vs. pathogen persistence


Return to original state
No return


Scheffer et al. (2001) Nature
Timeseries with phase transitions
Sahara-derived dust
Years before present
Oceanic "state"
Manlove et al. (2016) Ecology


Manlove et al. (2016) Ecology


Manlove et al. (2016) Ecology
Persistence produces a phase-transition.


Die-offs = occassional shock; no change in attractor
My Questions
1. How do die-offs and persistent disease compare in terms of population effects?
2. Is transmission frequency- or density-dependent?
3. Do all infected animals pose similar risks to lambs?
4. What would have made this easier?
Persistence = phase-transition
2. Is transmission frequency- or density-dependent?
What is the scale of transmission during lamb events?
Do number contacts change with population "density"?


Scale of transmission
Low between-group variance
High between-group variance
=> System-wide transmission
=> Local transmission
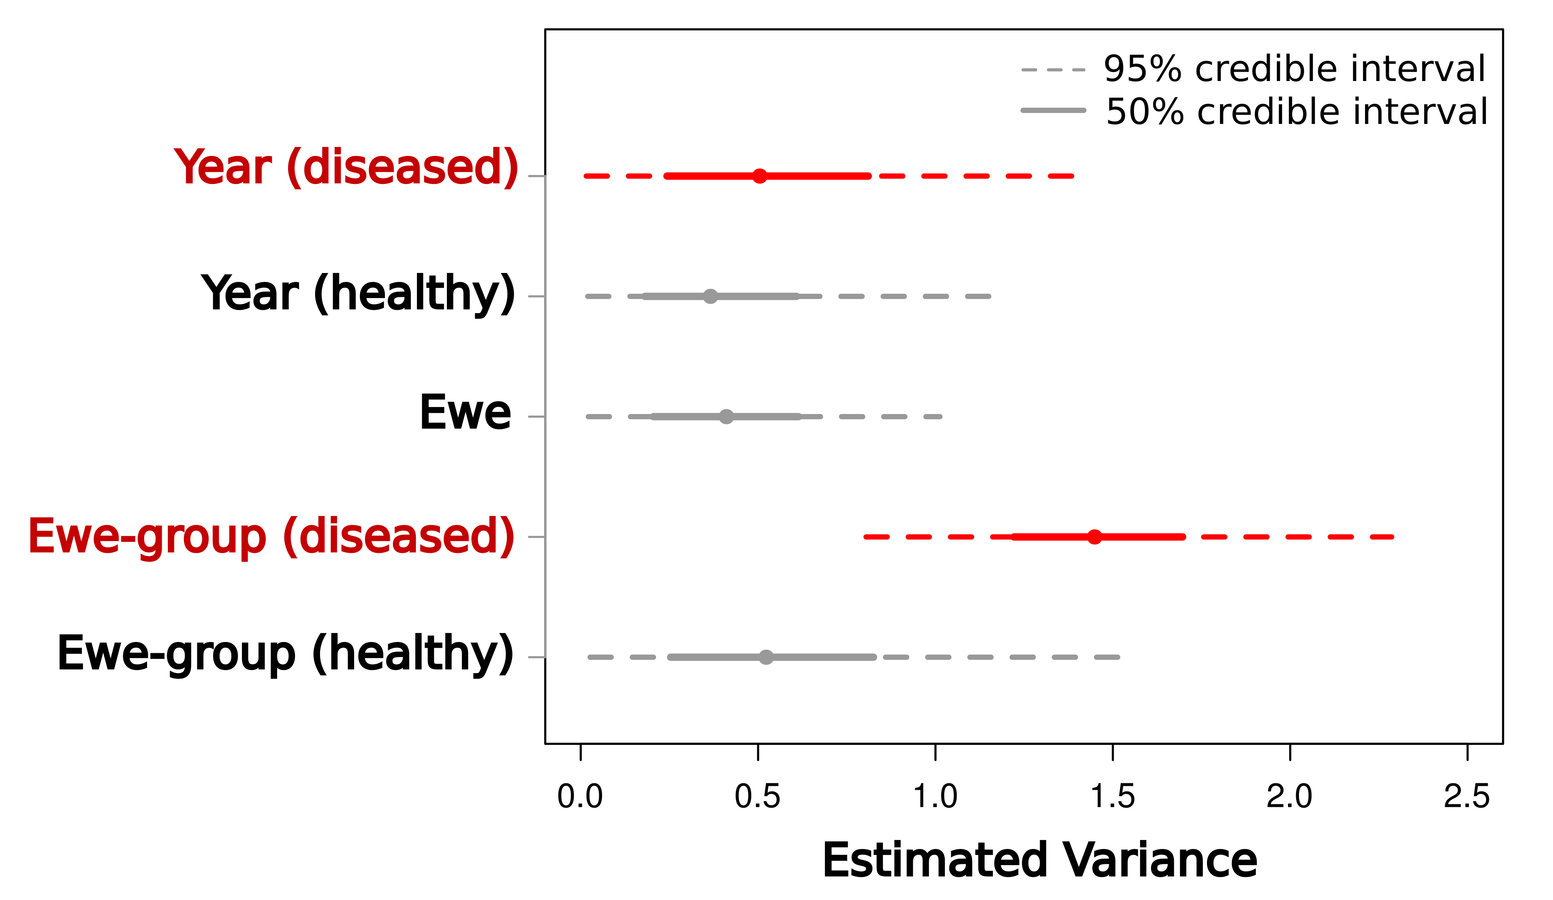
Manlove et al. (2014) Proc R Soc B
Transmission localized within ewe-groups
Group size
Manlove et al. (2014) Proc R Soc B


Contact rate doesn't scale with population size
=> Frequency-dependent transmission
Population size
My Questions
1. How do die-offs and persistent disease compare in terms of population effects?
2. Is transmission frequency- or density-dependent?
3. Do all infected animals pose similar risks to lambs?
4. What would have made this easier?
Frequency-dependent during persistence
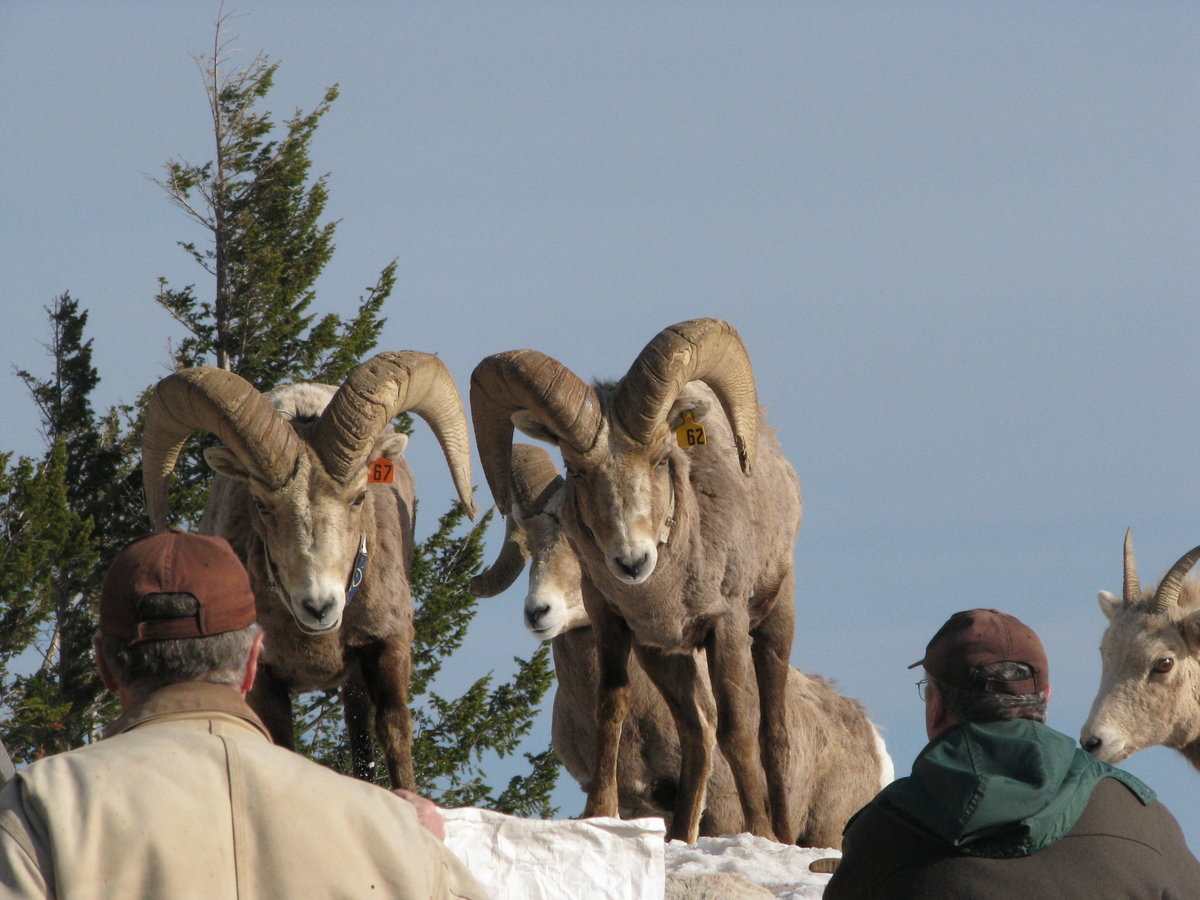
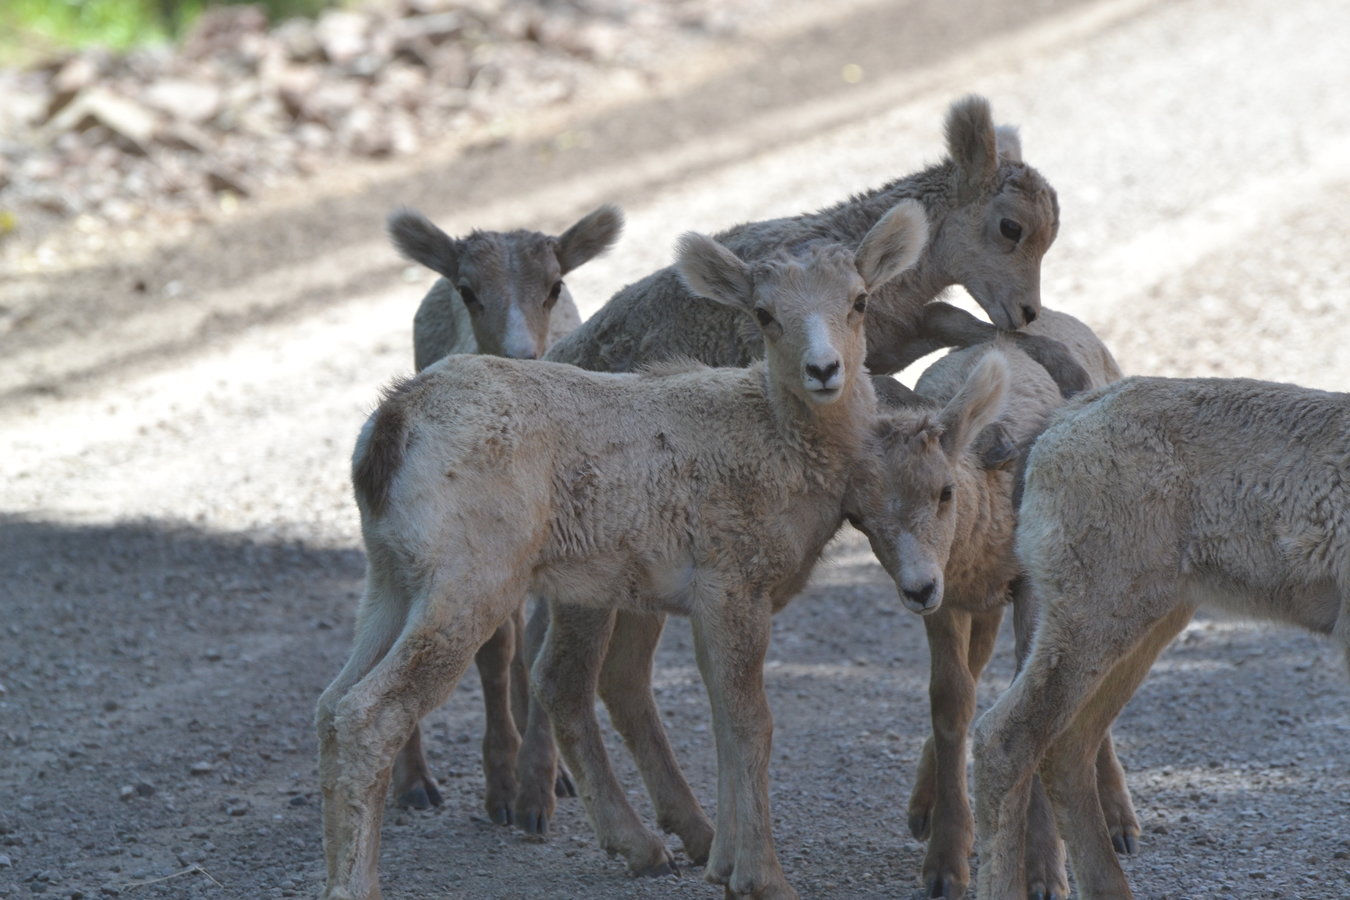
3. Do all infected animals pose similar risks to lambs?
Who contacts who, when?
How does contact map to transmission?
P(transmission | contact)
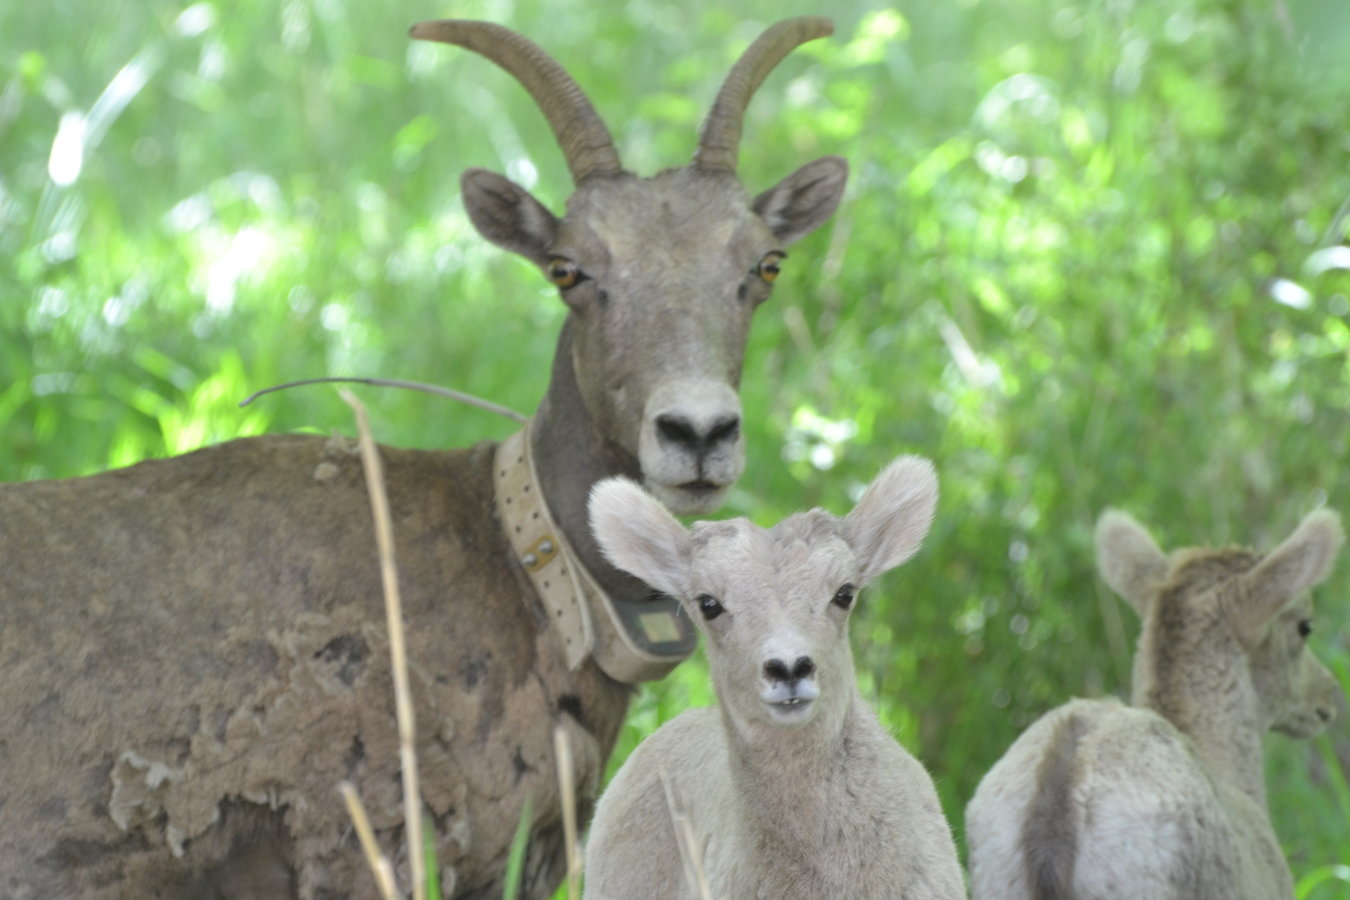

Ewes with lambs ("dams")
Lambs
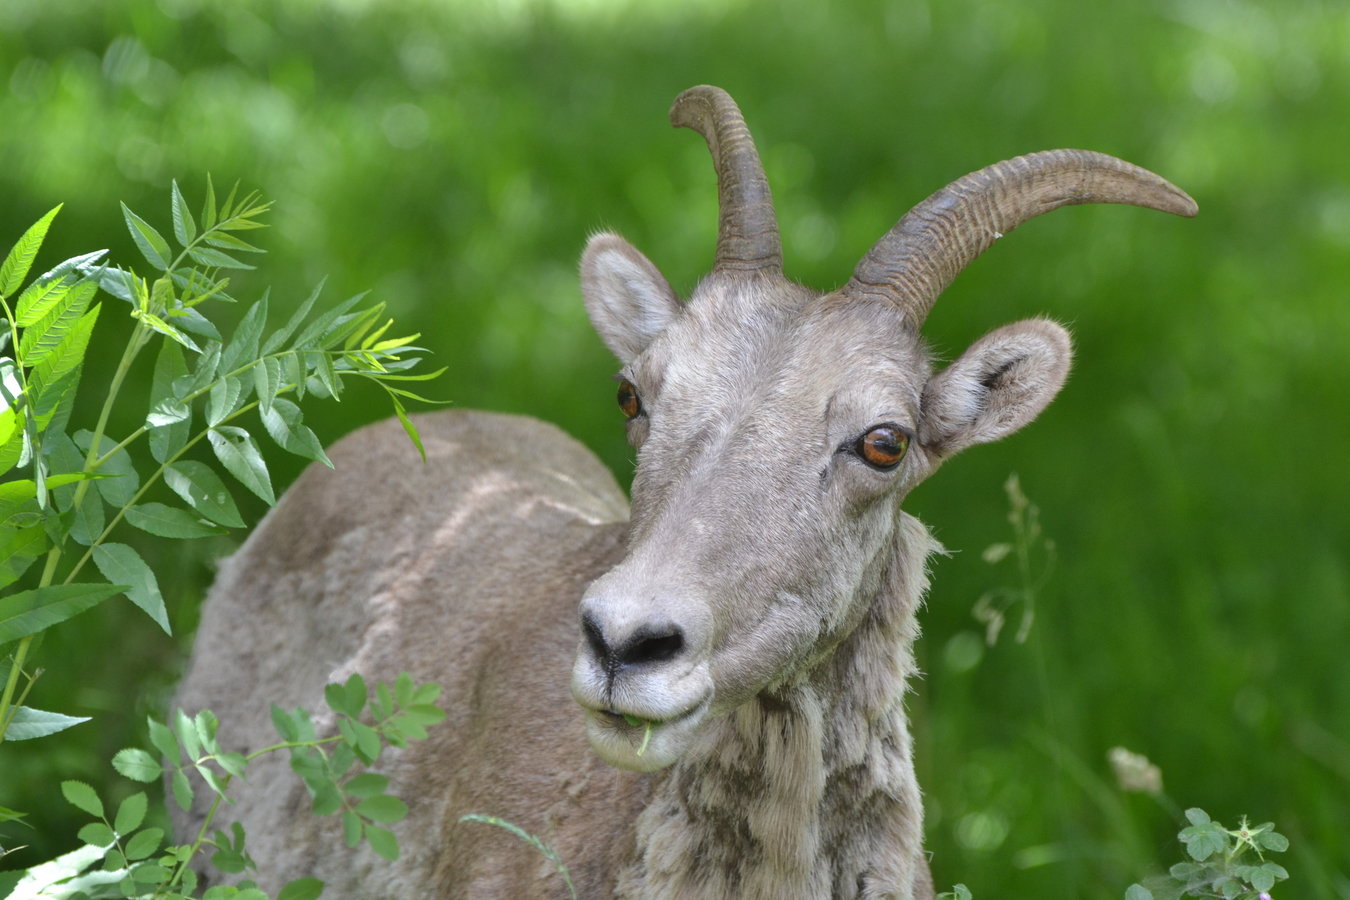
Yearlings


Yearlings are reservoirs for infection

logit(Movi-positive)
Age
Manlove et al. (in review)
Dams, yearlings, dry ewes all have similar mixing patterns.


Manlove et al. (in review)
Direct touch concentrated in lambs/dams.


Manlove et al. (in review)


+ \beta_{1} \sum X_{\text{Ewes with lambs}}
+ \beta_{2}\sum X_{\text{Ewes without lambs}}
+ \beta_{3} \sum X_{Yearlings}
logit(P(\text{Lamb survival})) =
\beta_{0}


Yearlings are reservoirs for infection, but not transmission
My Questions
1. How do die-offs and persistent disease compare in terms of population effects?
2. Is transmission frequency- or density-dependent?
3. Do all infected animals pose similar risks to lambs?
4. What would have made this more efficient?
No. Highest transmission risk from reproductive ewes
What would have made this more efficient?
Improvement #1
Better cross-disciplinary communication.
Manlove et al. (2016) PLoS Biology


Improvement #2
Better comparative frameworks
for contact patterns


Animal movement histories have three components:
Individual identifier
Spatial coordinates
Timestamp
(I,S,T)
I \in {1,...,N}
S \in D_{S}
T \in D_{T}
Network constructions rely on intersections of marginalizations of
Nodes = levels of variable between which intersections are calculated
Edges = relative frequency of intersection occurrence
(I,S,T)
Other metrics can proxy for social contacts if I, S, T are redundant

High mutual information in S and I
High mutual information in I, S, and T


Spatial networks = good proxies
Group networks = good proxies
Mutual information between Individual identity, space, time

Fission-fusion/
big groups
Territorial/
small home-ranges


Fission-fusion/
big groups
Territorial/
small home-ranges
Improvement #2
Better comparative frameworks
for disease structures
Can we project population epidemiology from within-host processes?
What within-host categorizations make sense for management?
S
I
R
S
I
R
C
S
I
My Questions
1. How do die-offs and persistent disease compare in terms of population effects?
2. Is transmission frequency- or density-dependent?
3. Do all infected animals pose similar risks to lambs?
4. What would have made this more efficient?
Better cross-disciplinary communication
Stronger comparative frameworks
Big messages
Persistence is extremely costly
Transmission is frequency-dependent
Transmission is likely driven by a few chronically infected dams
Need more synthesis

Thanks!

Michael Lerch
Johanna Ohm
Logan Weyand
K.C. Hill
Paul Wik
Bob Dice
Sonja Andersen
Frances
Tom
Pete
Raina
Paul
Andrew Read
Ottar Bjornstad
Ephraim Hanks
Matt Ferrari
Mary Poss
In Lewiston and Lewistown
In State College
Christina Aiello
Kurt Vandegrift
Nina Wale
Amelia McKee
Lauren Quevillon
CIDD affiliates
In Bozeman
Emily Almberg
Angela Brennan
Pauline Kamath
Bzn Disease Lab members
Elizabeth Fulton
Carson Butler
Bob Garrott
Penn State Academic Computing Fellows Program
Thanks!

Use
Model processes that require host interactions
Problems
Cost
Inferential limitations
How do we compare methods?
Alternative
Spatial information
Biases from partial sampling
Home range overlap networks
Spatial networks
Aggregation information (group size)
When do we need social contact networks?
Latent
Easily
Observed
Hard to observed
For some animal movement processes, easy- and hard-metrics share information.
Claim:
Predictable relationships?
Could guide network construction?
Obstacles
1. How do we quantify arrows?
2. If the relationships exist in silico, how do we test them in vivo?
Network basics
Show relationships (edges) between actors (nodes)
Metrics describe structure of relationships
Degree = How many relationships an actor has
Modularity = Extent to which relationships substructure into particular groups
Social contact networks
Nodes = individuals
Edges = in same group
Spatial networks
Nodes = locations in space (e.g., traps on a grid, waterholes, corners of a transect)
Edges = 1) spatial distance between points; 2) animals observed at both locations
Home-range overlap networks
Nodes = individuals
Edges = extent to which home-ranges overlap
Contact network constructions

A little formalism: Animal movements
Animal movement histories have three components:
Individual identifier
Spatial coordinates
Timestamp
(I,S,T)
I \in {1,...,N}
S \in D_{S}
T \in D_{T}
(All?) models in population biology rely on some aspect of
(I,S,T)
| Analysis | Variable aggregated out | Marginal used |
|---|---|---|
| Individual home-range | ||
| Population-level movements | ||
| Individual survival |
f_{I,S} = \int_{t \in T}f_{(I,S,T)}dt
f_{S,T} = \sum_{i \in I}f_{(I,S,T)}
f_{I,T} = \int_{s \in S}f_{(I,S,T)}ds
T
I
S
Case 1: Social contact network
First claim
All network constructions rely on intersections of some marginal distribution of
(I,S,T)
Nodes = levels of variable between which intersections are calculated
Edges = relative frequency of intersection occurrence
Two individuals, and
I_{1}
I_{2}
, with movement paths and
X_{1} = (I = I_{1}, S, T)
X_{2} = (I = I_{2}, S, T)
X_{1} \cap X_{2}
, contains all points
where and co-occur in
I_{1}
I_{2}
(S,T)
(aka their "contacts")
Case 2: Spatial networks
Two sites, and
S_{1}
, with visit histories and
X_{S1} = (I, S = S_{1}, T)
X_{S2} = (I, S = S_{2}, T)
X_{S1} \cap X_{S2}
The set of path intersections,
is empty.
S_{2}
BUT, not empty if we aggregate over (= marginalize out) time
X_{S1} = (I, S = S_{1})
X_{S2} = (I, S = S_{2})
and
X_{S1} \cap X_{S2}
= frequency with which and share animals
S_{1}
S_{2}
Forward
Why sheep?
What else?
Model for how to learn about an EID with limited, realistic data.


Luke Manlove


Almberg, Manlove et al. in prep
S
E
I
C
R
birth
\lambda
3 weeks
16 weeks
lifelong
lifelong

Emily Almberg
Main findings
3. Yearlings were disproportionately infected, but appeared to rarely transmit
1. Yearlings, dry ewes, and dams all had similar group-level association patterns
2. Direct touch was concentrated around lambs, and dams with lambs
While yearlings may be a reservoir for infection, they are not a reservoir for transmission


Main Findings
1. Disease introduction is associated with a long-term shift in bighorn population dynamics.
2. Phase-transition is driven by disease-induced mortality in lambs.
3. Persistence rapidly overtakes all-age die-offs as major driver of pop. dynamics

"One Health" or Three?
Is disease modeling becoming more cross-disciplinary?

Manlove et al. (2016) PLoS Biology
Motivating question:

Manlove et al. (2016) PLoS Biology

Manlove et al. (2016) PLoS Biology

Manlove et al. (2016) PLoS Biology

Manlove et al. (2016) PLoS Biology

Main points
1. Lamb pneumonia transmission is localized into ewe groups
2. As populations get larger, more groups appear, but group size remains relatively constant
...so, number of infectious contacts probably doesn't scale with density.
Pathogen could drive host extinct.
Objectives
1. Document long-term population dynamics in Hells Canyon following die-off events
2. Estimate vital rates in the presence and absence of disease
3. Compare demographic costs of all-age die-offs vs. persistent lamb disease
Why does population structure matter?
If transmission scales with population density, disease can't drive host extinct.
Question
How does lamb pneumonia transmission relate to density?

Field methods
Associations
- located marked animals every 1-3 days
- group membership, lamb and health status, group size and composition
Interactions
- ~1600 10-minute group focal follows
- identity, duration, form of direct contacts
Scope
- 3 populations
- 3 summers
- 60% of adults/yearlings marked


A framework relating network constructions
Motivating question
Was it necessary to find all those animals every day?
When are spatial networks good proxies for social contacts?

Network basics
Show relationships (edges) between actors (nodes)
Metrics describe structure of relationships
Degree = How many relationships an actor has
Modularity = Extent to which relationships substructure into particular groups
Social contact networks
Nodes = individuals
Edges = in same group
Spatial networks
Nodes = locations in space (e.g., traps on a grid, waterholes, corners of a transect)
Edges = 1) spatial distance between points; 2) animals observed at both locations
Home-range overlap networks
Nodes = individuals
Edges = extent to which home-ranges overlap
Contact network constructions
Disease ecologists use both spatial and social networks
No clear framework for how spatial and social networks relate to one another
Decision-making process remains ad hoc
Spatial
Social
Gerbils
Prairie dogs
Cholera in humans
"Fission-fusion" societies
Lions
Tasmanian devils
When are spatial networks good proxies of social contacts?
A little formalism: Animal movements
Animal movement histories have three components:
Individual identifier
Spatial coordinates
Timestamp
(I,S,T)
I \in {1,...,N}
S \in D_{S}
T \in D_{T}
(All?) models in population biology rely on some aspect of
(I,S,T)
| Analysis | Variable aggregated out | Marginal used |
|---|---|---|
| Individual home-range | ||
| Population-level movements | ||
| Individual survival |
f_{I,S} = \int_{t \in T}f_{(I,S,T)}dt
f_{S,T} = \sum_{i \in I}f_{(I,S,T)}
f_{I,T} = \int_{s \in S}f_{(I,S,T)}ds
T
I
S
Case 1: Social contact network
First claim
All network constructions rely on intersections of some marginal distribution of
(I,S,T)
Nodes = levels of variable between which intersections are calculated
Edges = relative frequency of intersection occurrence
Two individuals, and
I_{1}
I_{2}
, with movement paths and
X_{1} = (I = I_{1}, S, T)
X_{2} = (I = I_{2}, S, T)
X_{1} \cap X_{2}
, contains all points
where and co-occur in
I_{1}
I_{2}
(S,T)
(aka their "contacts")
Case 2: Spatial networks
Two sites, and
S_{1}
, with visit histories and
X_{S1} = (I, S = S_{1}, T)
X_{S2} = (I, S = S_{2}, T)
X_{S1} \cap X_{S2}
The set of path intersections,
is empty.
S_{2}
BUT, not empty if we aggregate over (= marginalize out) time
X_{S1} = (I, S = S_{1})
X_{S2} = (I, S = S_{2})
and
X_{S1} \cap X_{S2}
= frequency with which and share animals
S_{1}
S_{2}
Second claim
Network constructions can proxy for one another under appropriate correlations of
I, S, \text{ and } T
First claim
All network constructions rely on intersections on some marginal distribution of
(I,S,T)
Nodes = levels of variable between which intersections are calculated
Edges = relative frequency of intersection occurrence
Third claim
Correlations in can be predicted from animal behaviors
I, S, \text{ and } T
Do these claims hold (in silico, or in vivo)?
In silico
Simulated movement trajectories for
N = 50 animals over
T = 100 timesteps on an
S = 10x10 grid
Three governing movement parameters (varied systematically on log-scale)
Social affinity (desire to stay with current associates)
Spatial affinity (desire to stay within a particular territory)
Habitat heterogeneity (desirability of particular sites for all animals)
Recorded
Social contact network metrics (degree, modularity, transitivity, average distance)
Spatial network metrics (using animal-visits-multiple-sites as edges)
Home-range and defensibility (= day-range:home-range)
Group size distributions (fit with a Poisson model; summarize with )
\lambda
\gamma =
\delta =
\rho =


In vivo
Do group size and defensibility vary systematically with one another?
Have network studies used construction methods that vary with group size/defensibility?

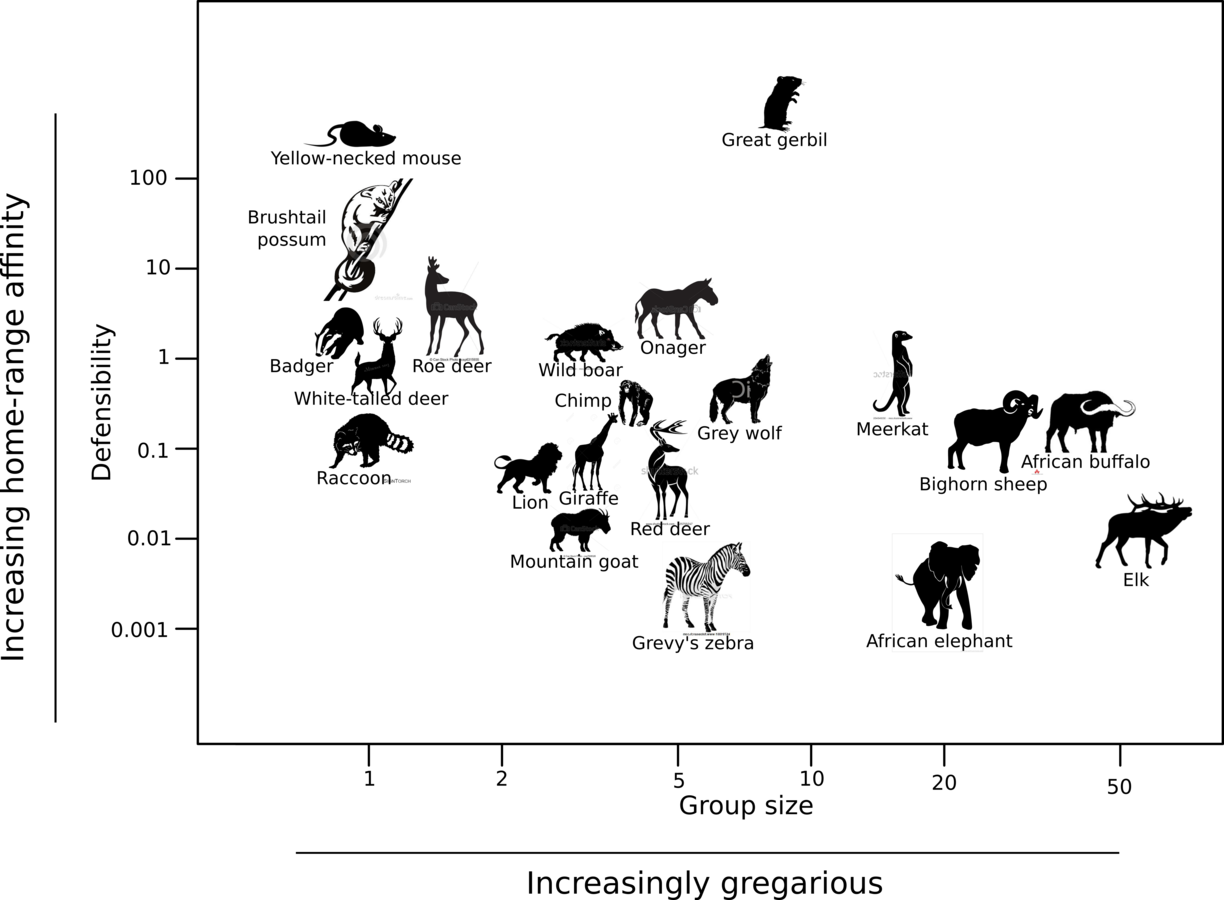
Main points
Network constructions have consistent probabilistic relationships that we don't formally use.
In some cases, spatial networks are good proxies for social networks
- Matriarchal societies with stable group membership
In some cases, social networks can be collapsed to groups
- Territorial species living on well-defined home-ranges
Theory needs calibration and validation on the ground
Acknowledgements
Pneumonia dynamics in bighorn sheep
By Kezia Manlove


