






























He Wang PRO
Knowledge increases by sharing but not by saving.
He Wang (王赫)
hewang@ucas.ac.cn
International Centre for Theoretical Physics Asia-Pacific (ICTP-AP), UCAS
Taiji Laboratory for Gravitational Wave Universe (Beijing/Hangzhou), UCAS
on behave of LVK collaboration
July 3, 2025 @南开大学
Interpretable Gravitational Wave Data Analysis with Deep Learning and Large Language Models
GW
AI for GW
LLM for GW
hewang@ucas.ac.cn
GW Characteristics
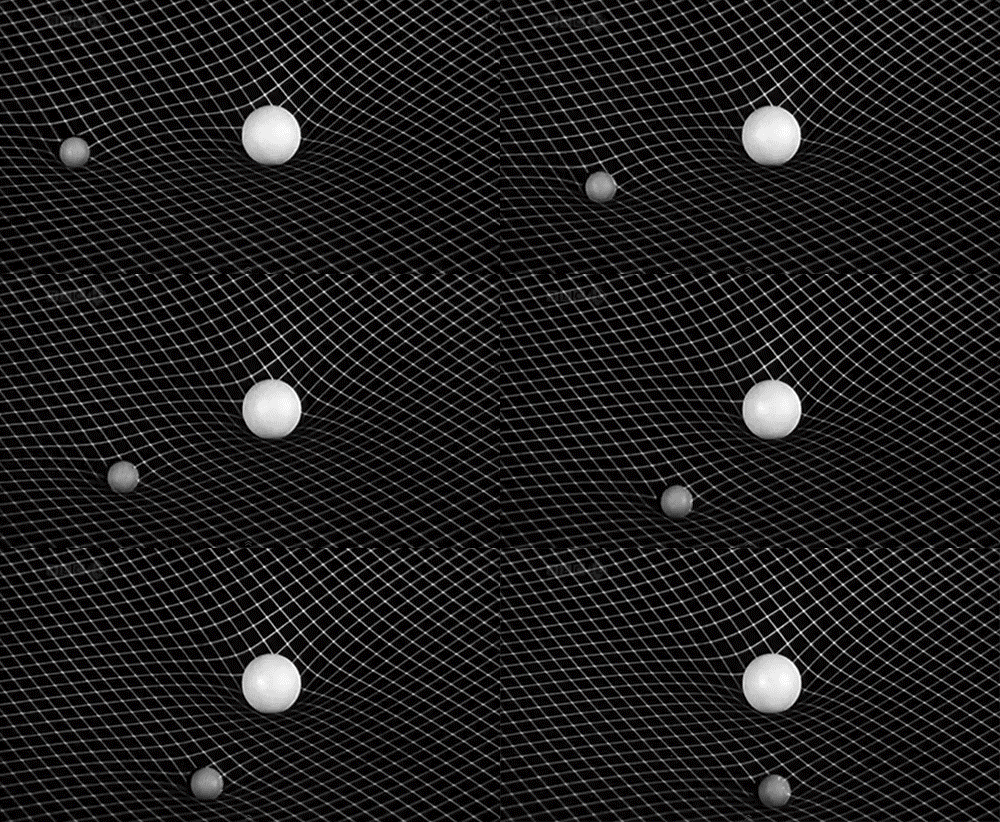
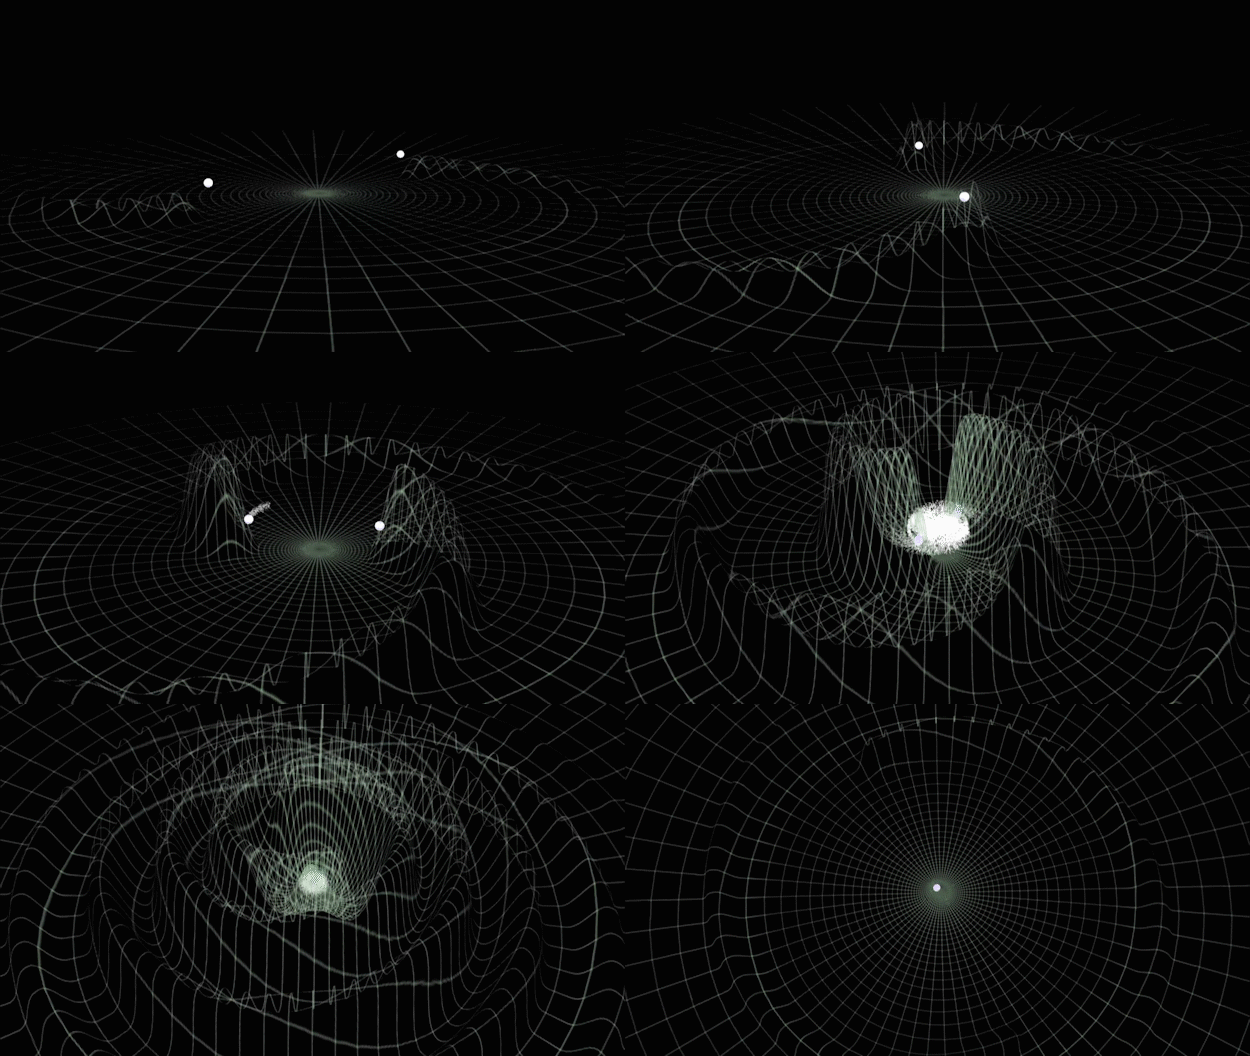
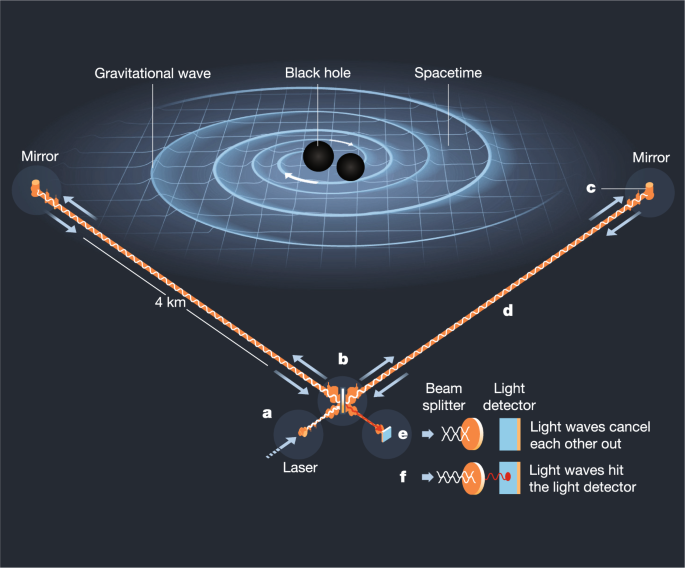
引力波是时空的涟漪。
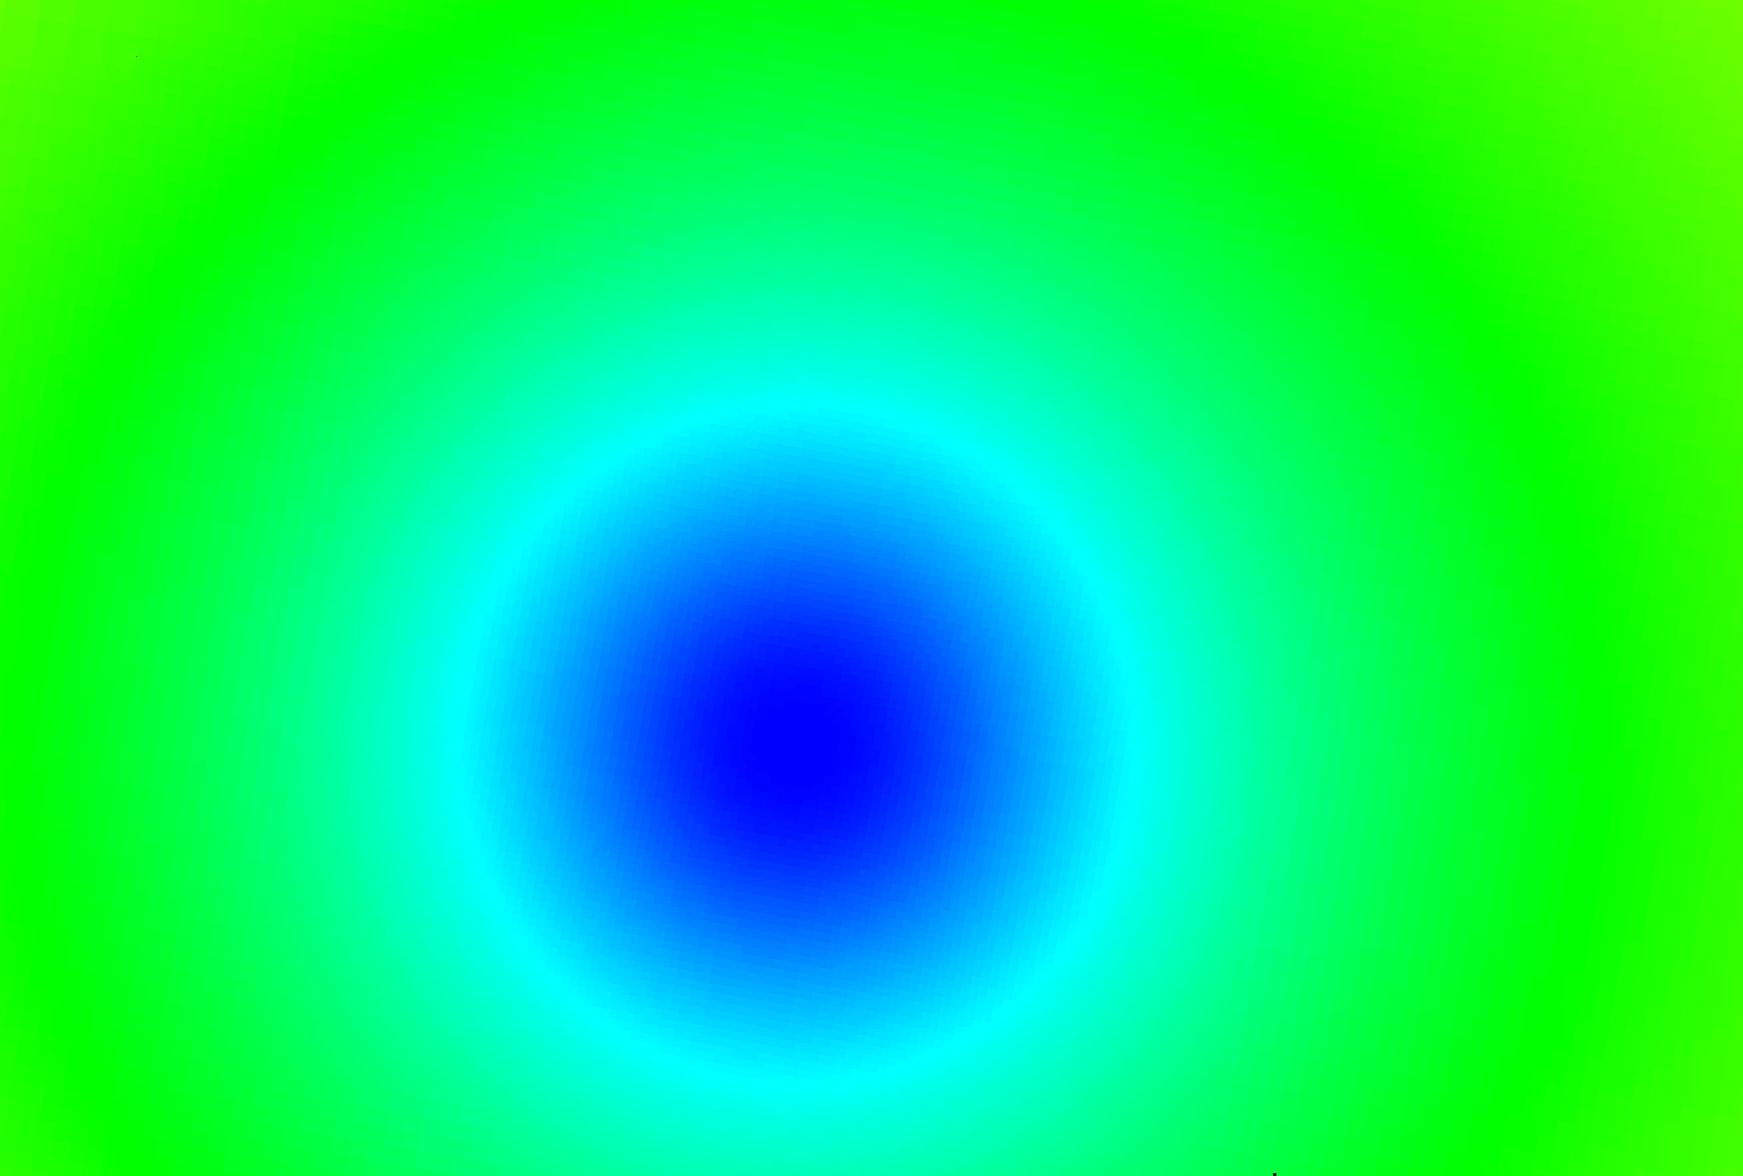
大物体的引力扭曲空间和时间,或称为“时空”,就像保龄球在弹跳床上滚动时改变其形状一样。较小的物体因此会以不同的方式移动——就像弹跳床上朝向保龄球大小的凹陷螺旋而去的弹珠,而不是坐在平坦的表面上。
Interpretable Gravitational Wave Data Analysis with DL and LLMs
hewang@ucas.ac.cn
Gravitational waves (GW) are a strong field effect in General Relativity, ripples in the fabric of spacetime caused by accelerating massive objects.
双星并合系统产生的引力波波源
引力波振幅的测量
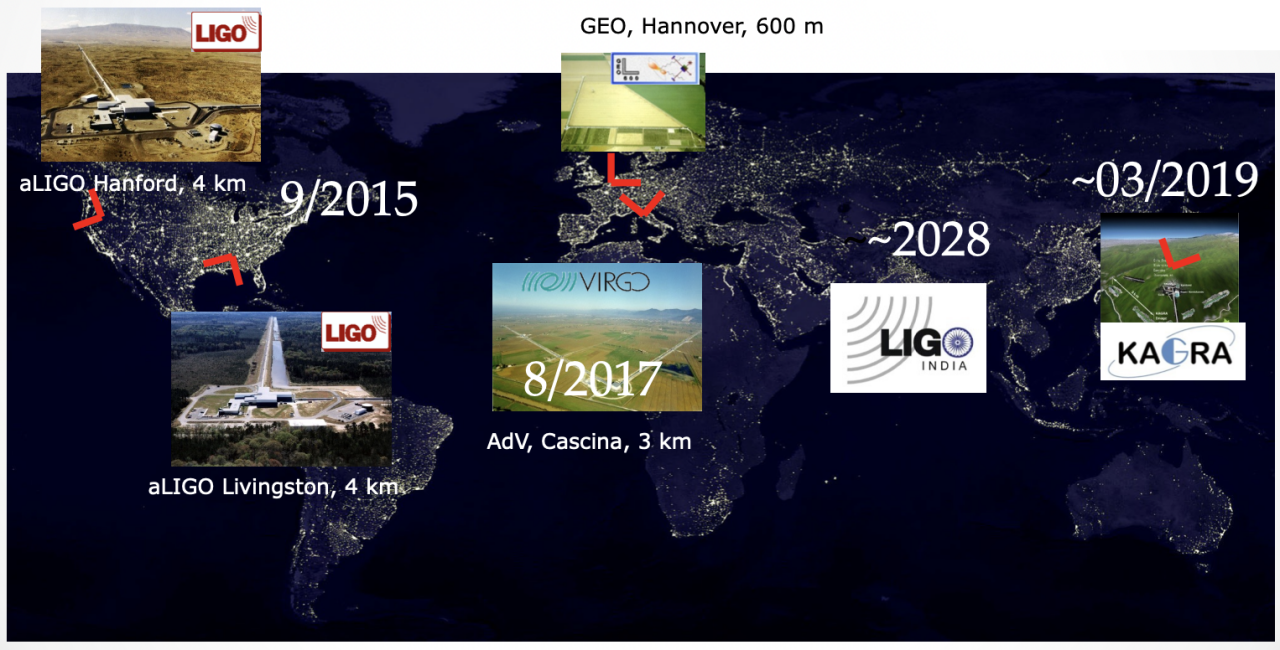
地面引力波探测器网络
GW Detection
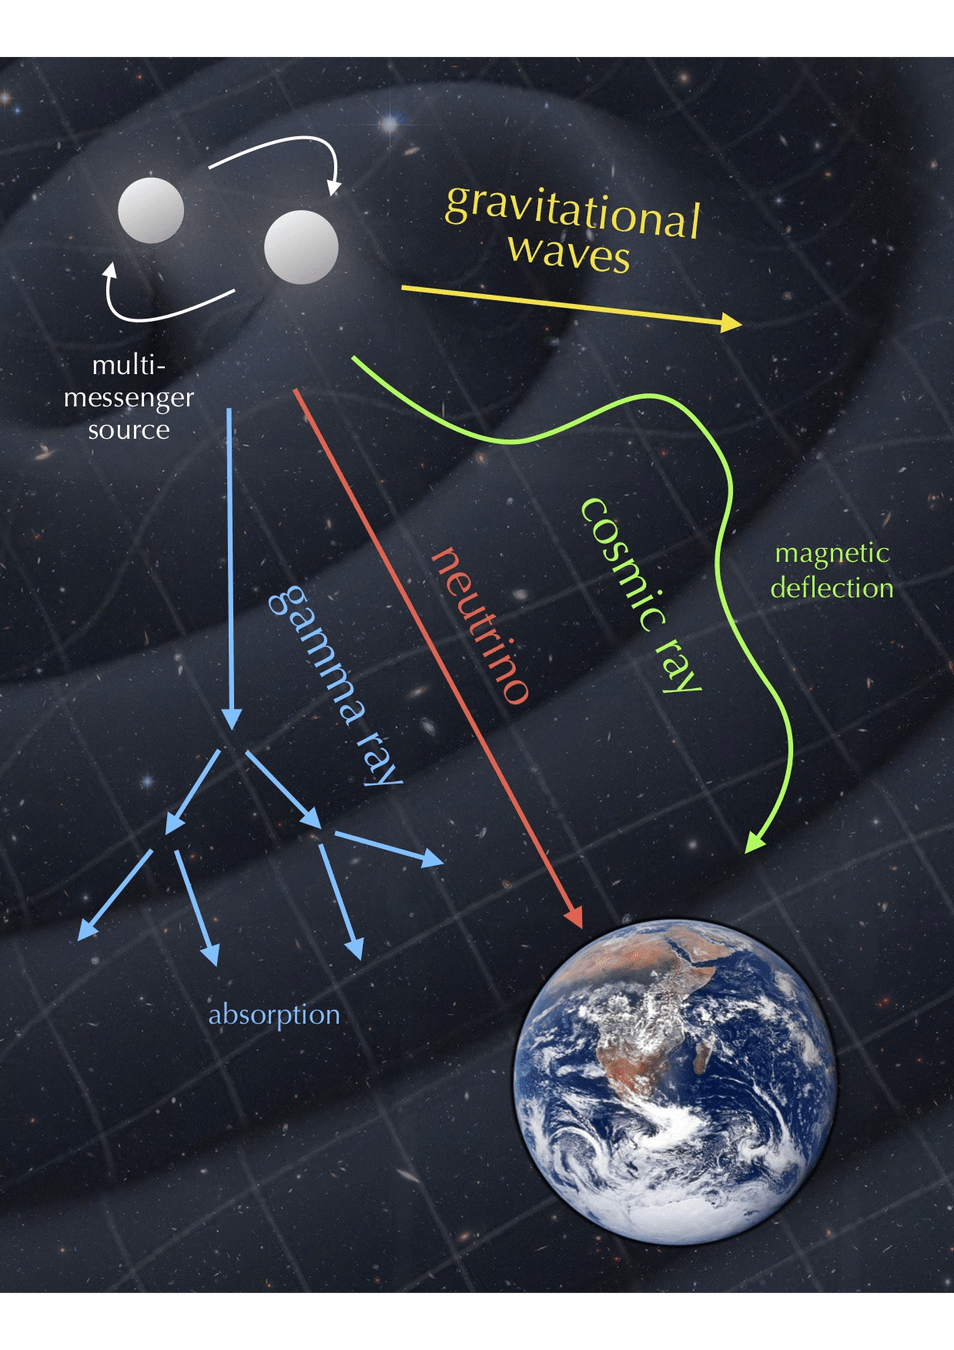
引力波探测打开了探索宇宙的新窗口
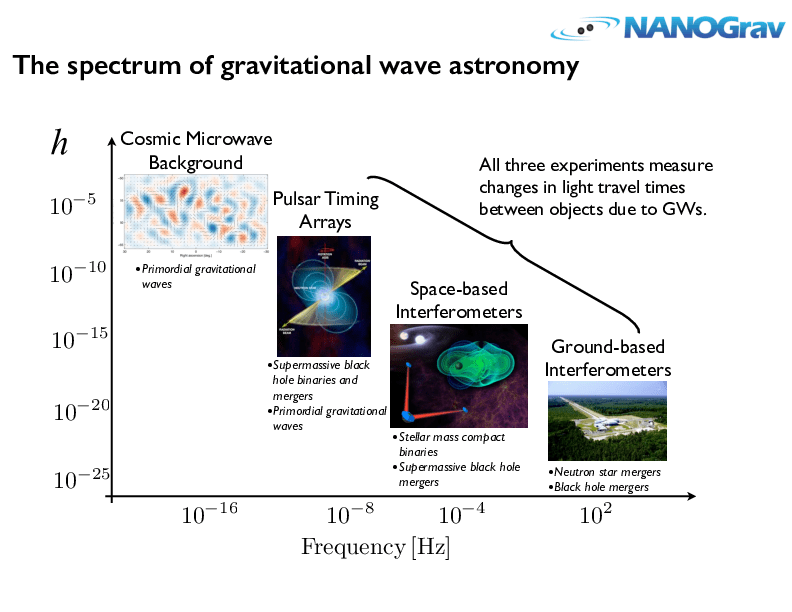
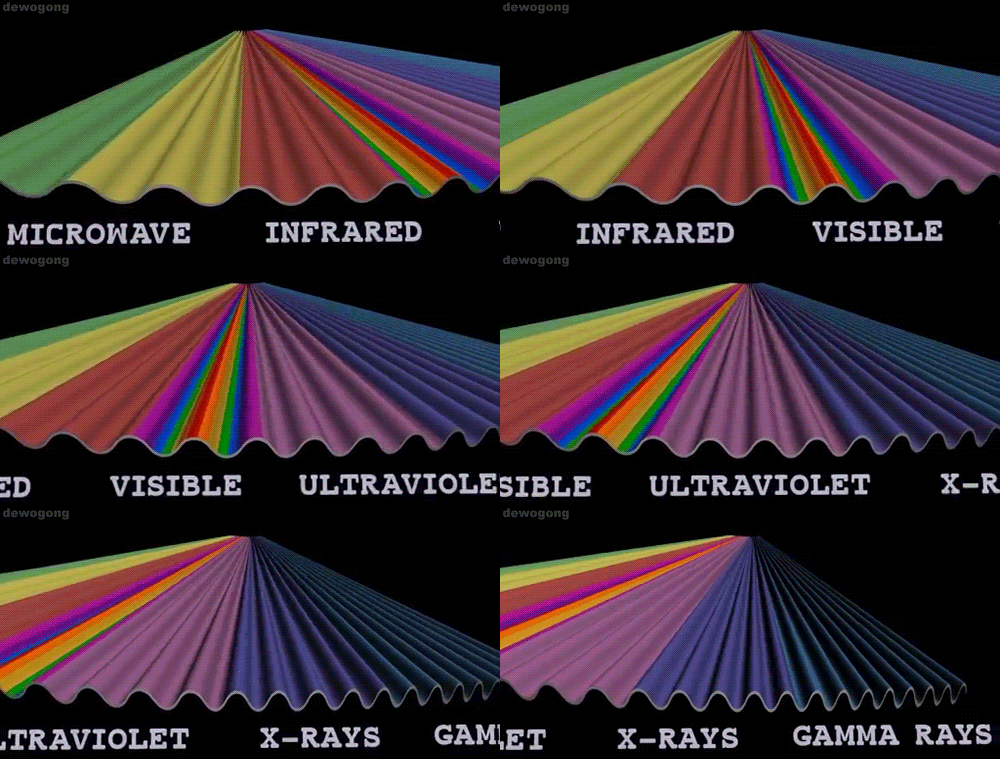
不同波源,频率跨越 20 个数量级,不同探测器
Interpretable Gravitational Wave Data Analysis with DL and LLMs
hewang@ucas.ac.cn
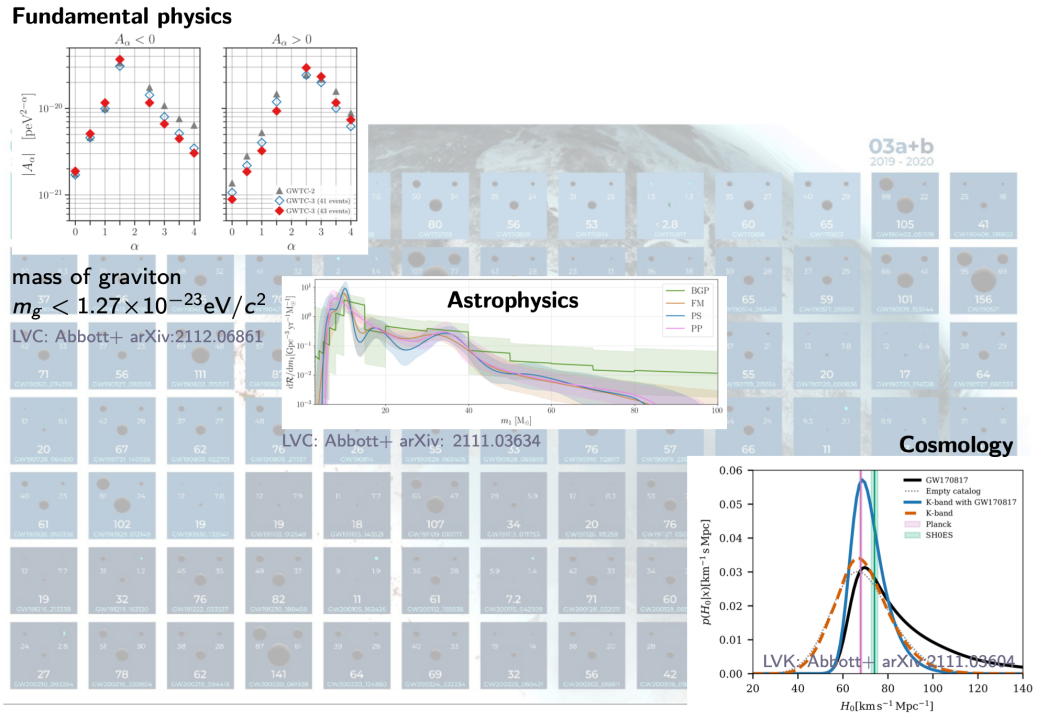
基础物理学
引力子是否有质量
引力波的传播速度
...
Interpretable Gravitational Wave Data Analysis with DL and LLMs
天体物理学
大质量恒星演化模型
恒星级双黑洞的形成机制
...
宇宙学
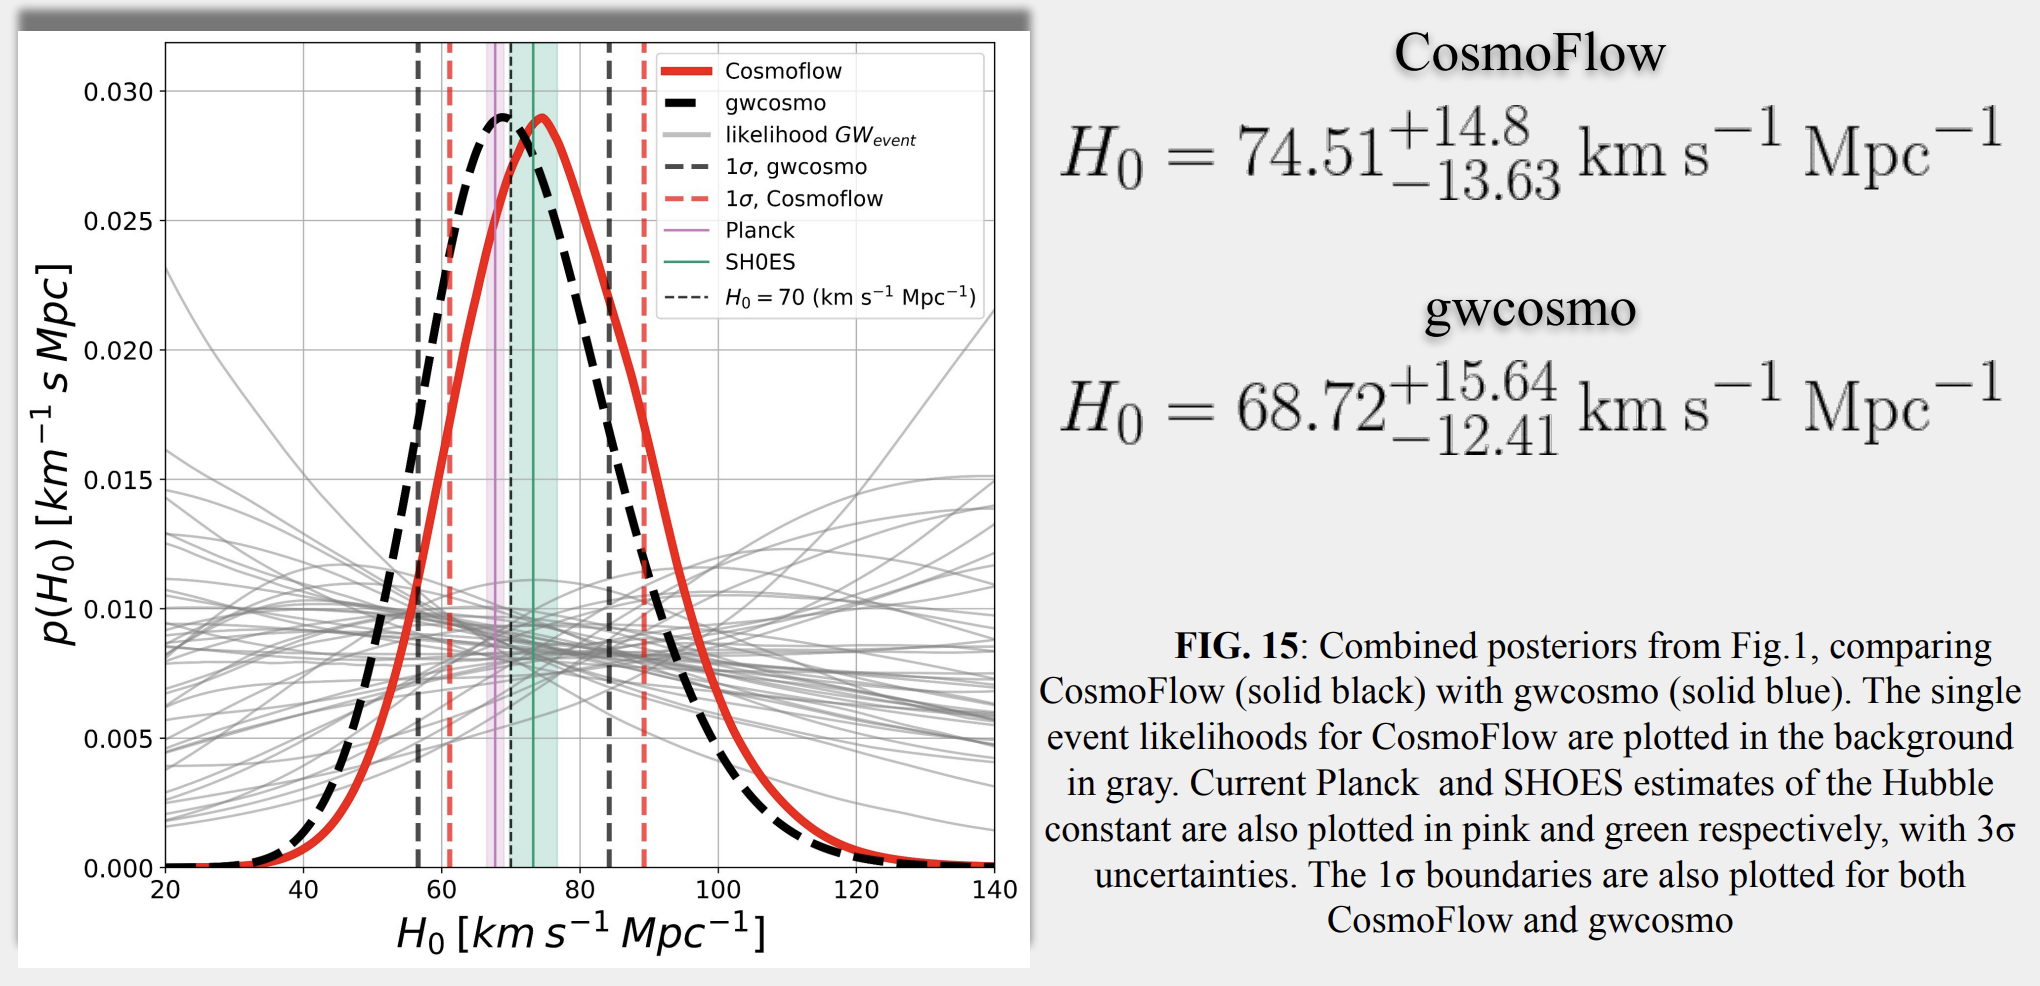
哈勃常数的测量
暗能量
...
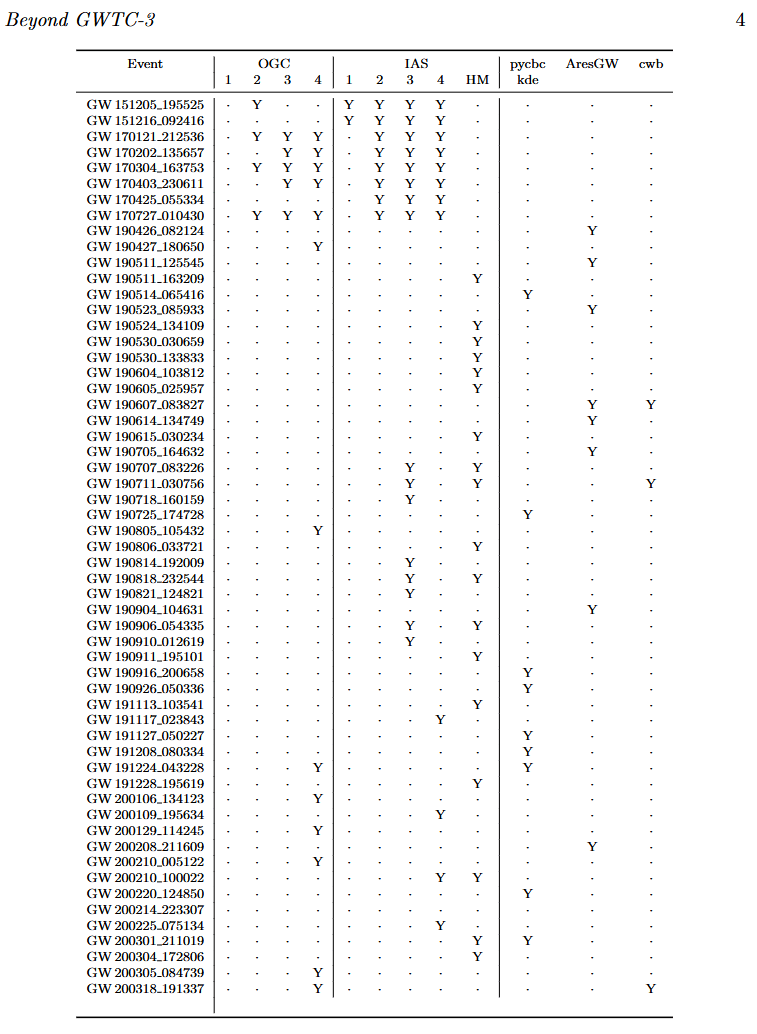
引力波暂现源星表 (GWTC-3)
hewang@ucas.ac.cn
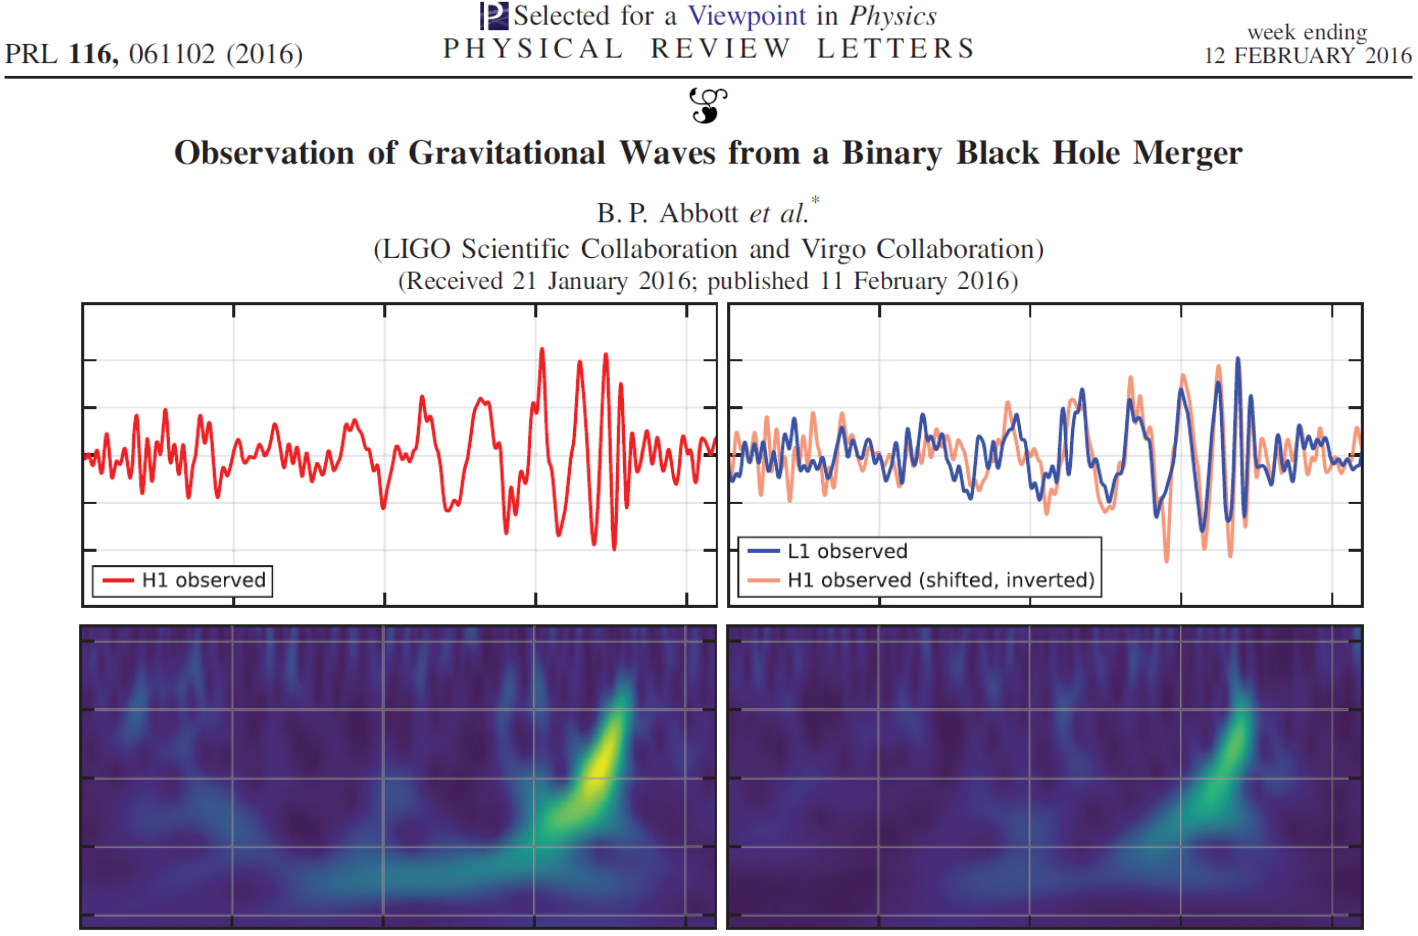
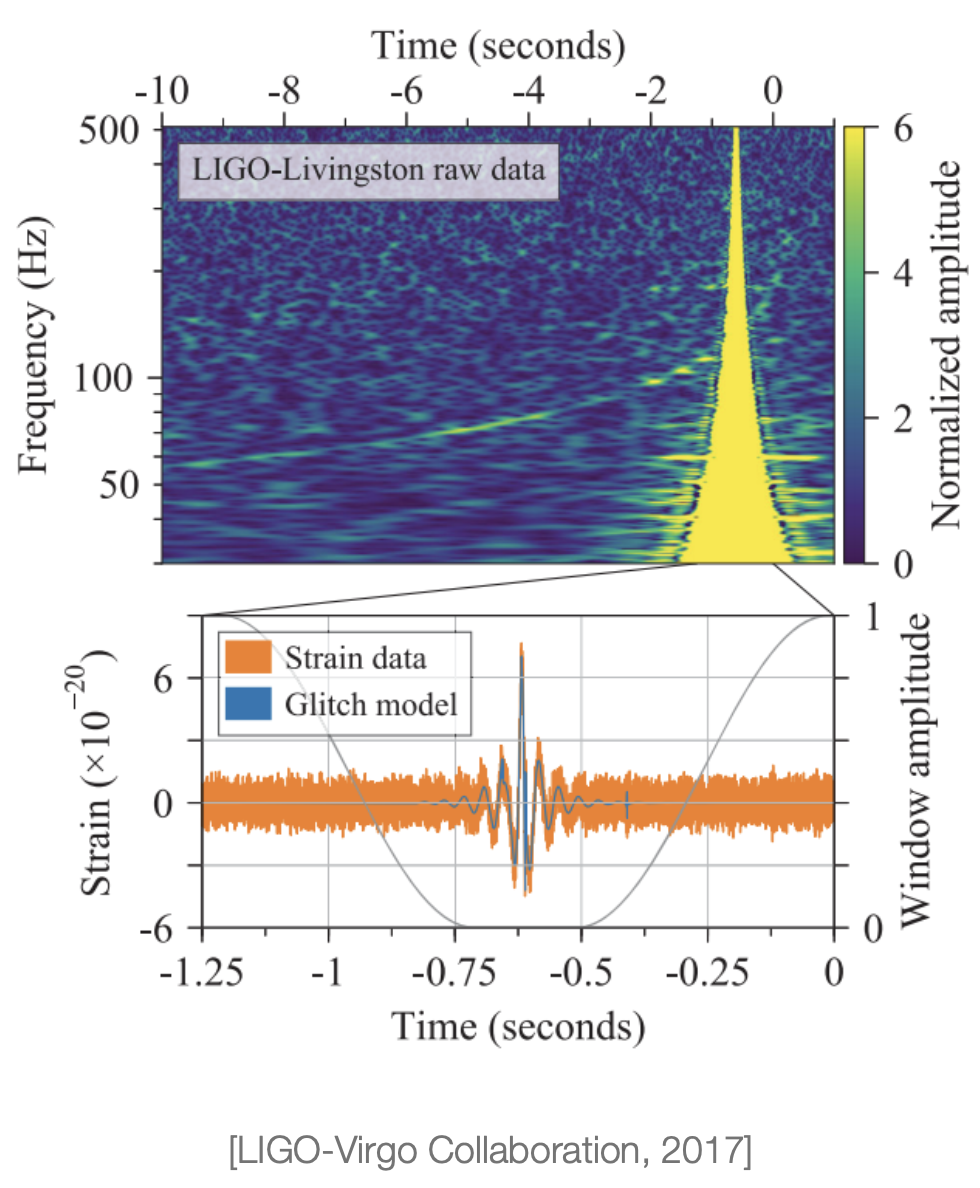
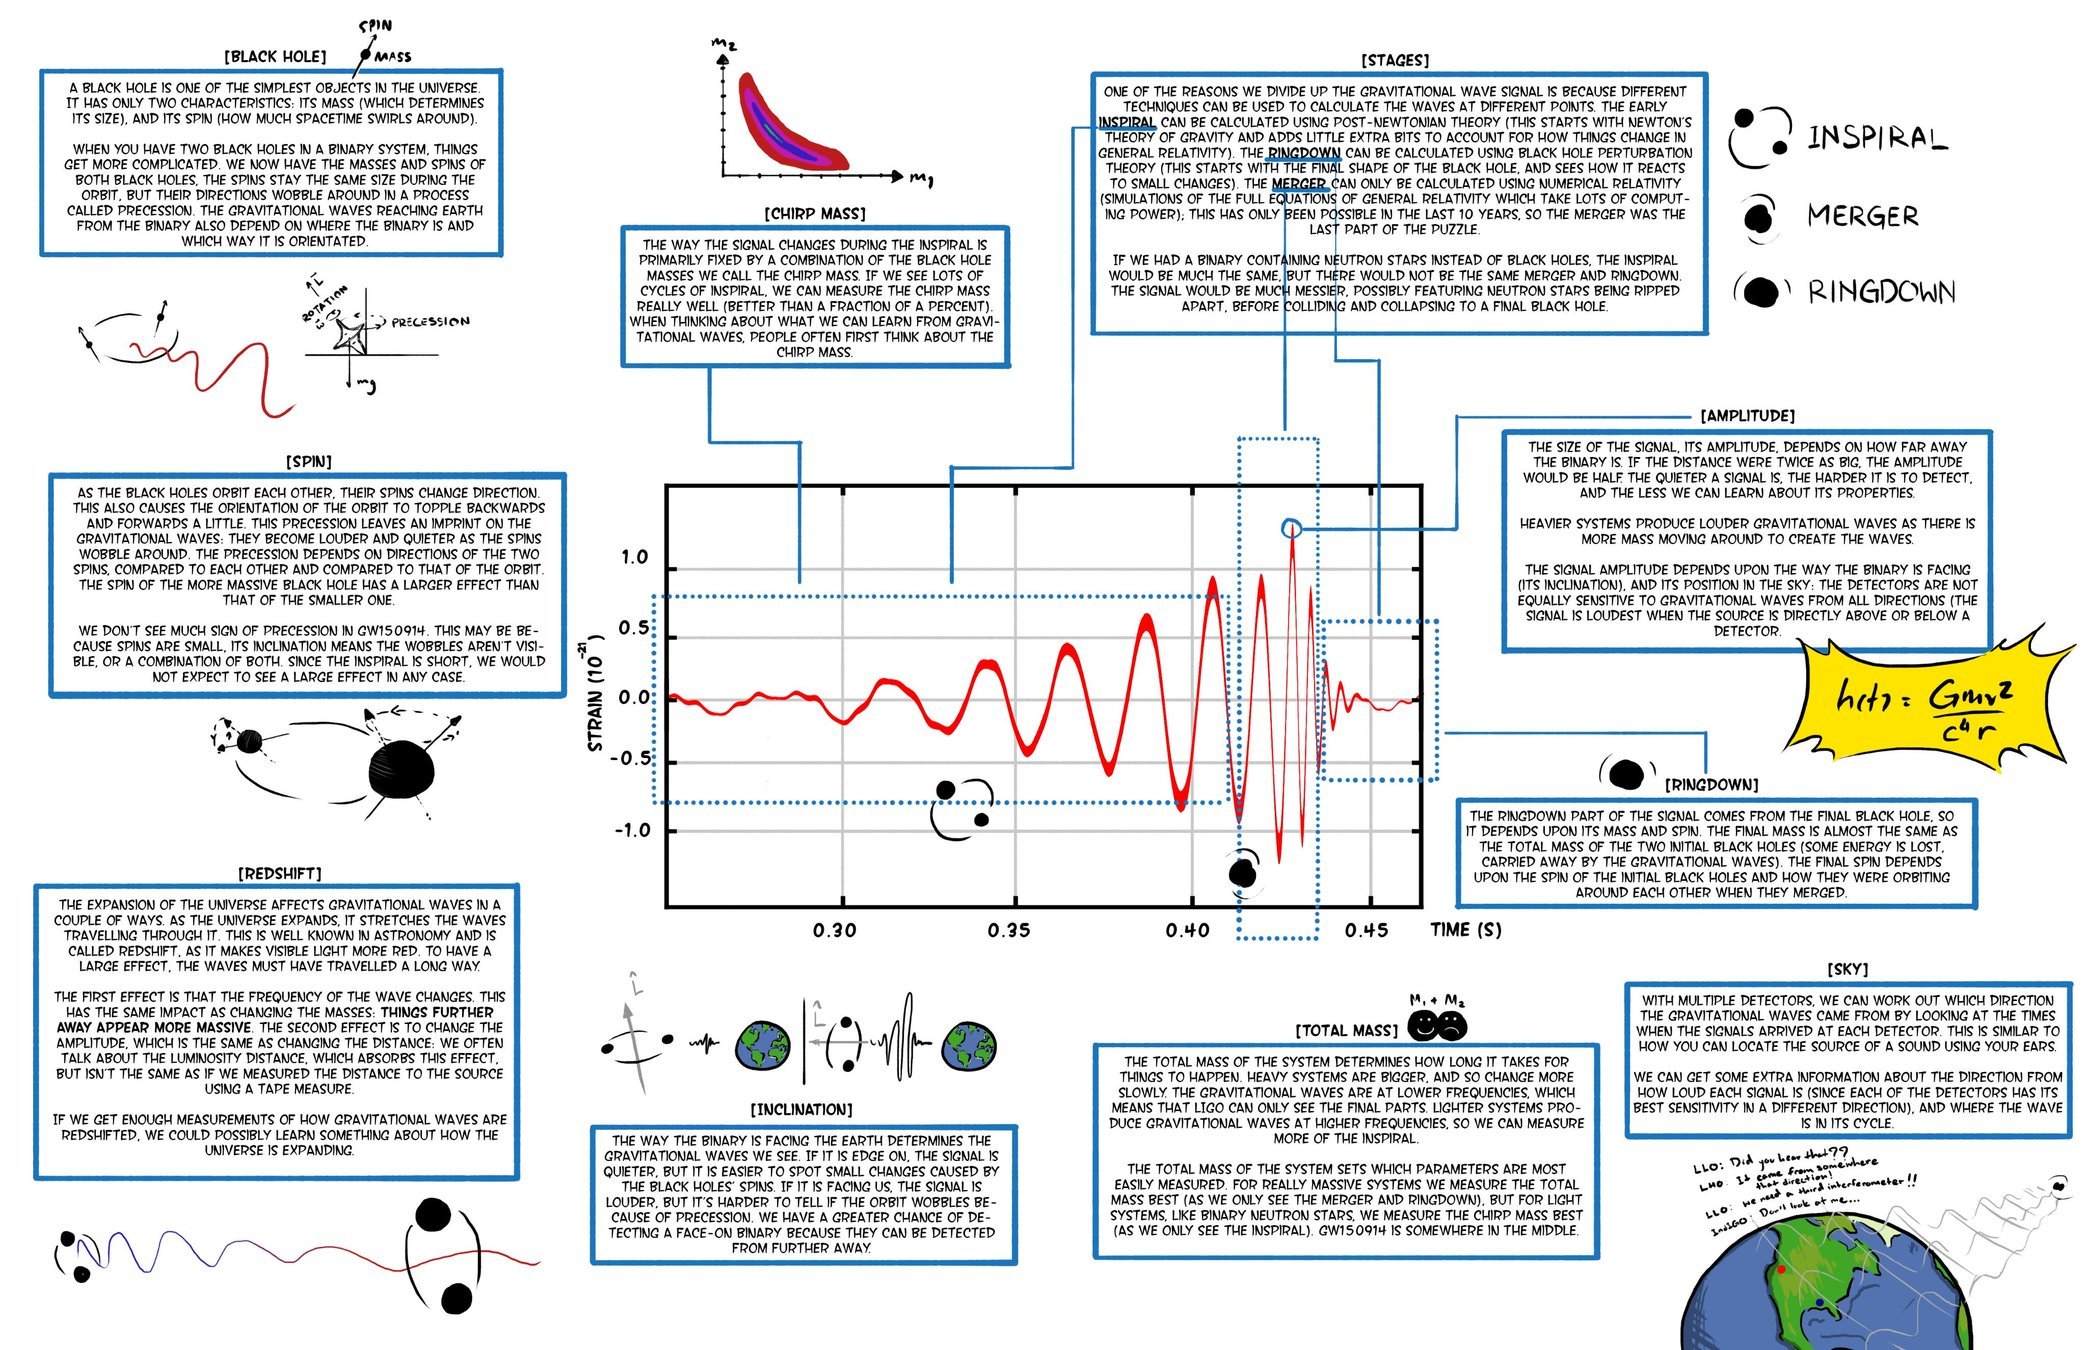
首次探测双黑洞并合引力波事件 GW150914
人类成功观测到引力波的五条关键要素:
- 良好的探测器技术
- 良好的波形模板
- 良好的数据分析方法和技术
- 多个独立探测器间的一致性观测
- 引力波天文学和电磁波天文学的一致性观测
DOI:10.1063/1.1629411
– 伯纳德·舒尔茨
GW Data Characteristics
LIGO-VIRGO-KAGRA
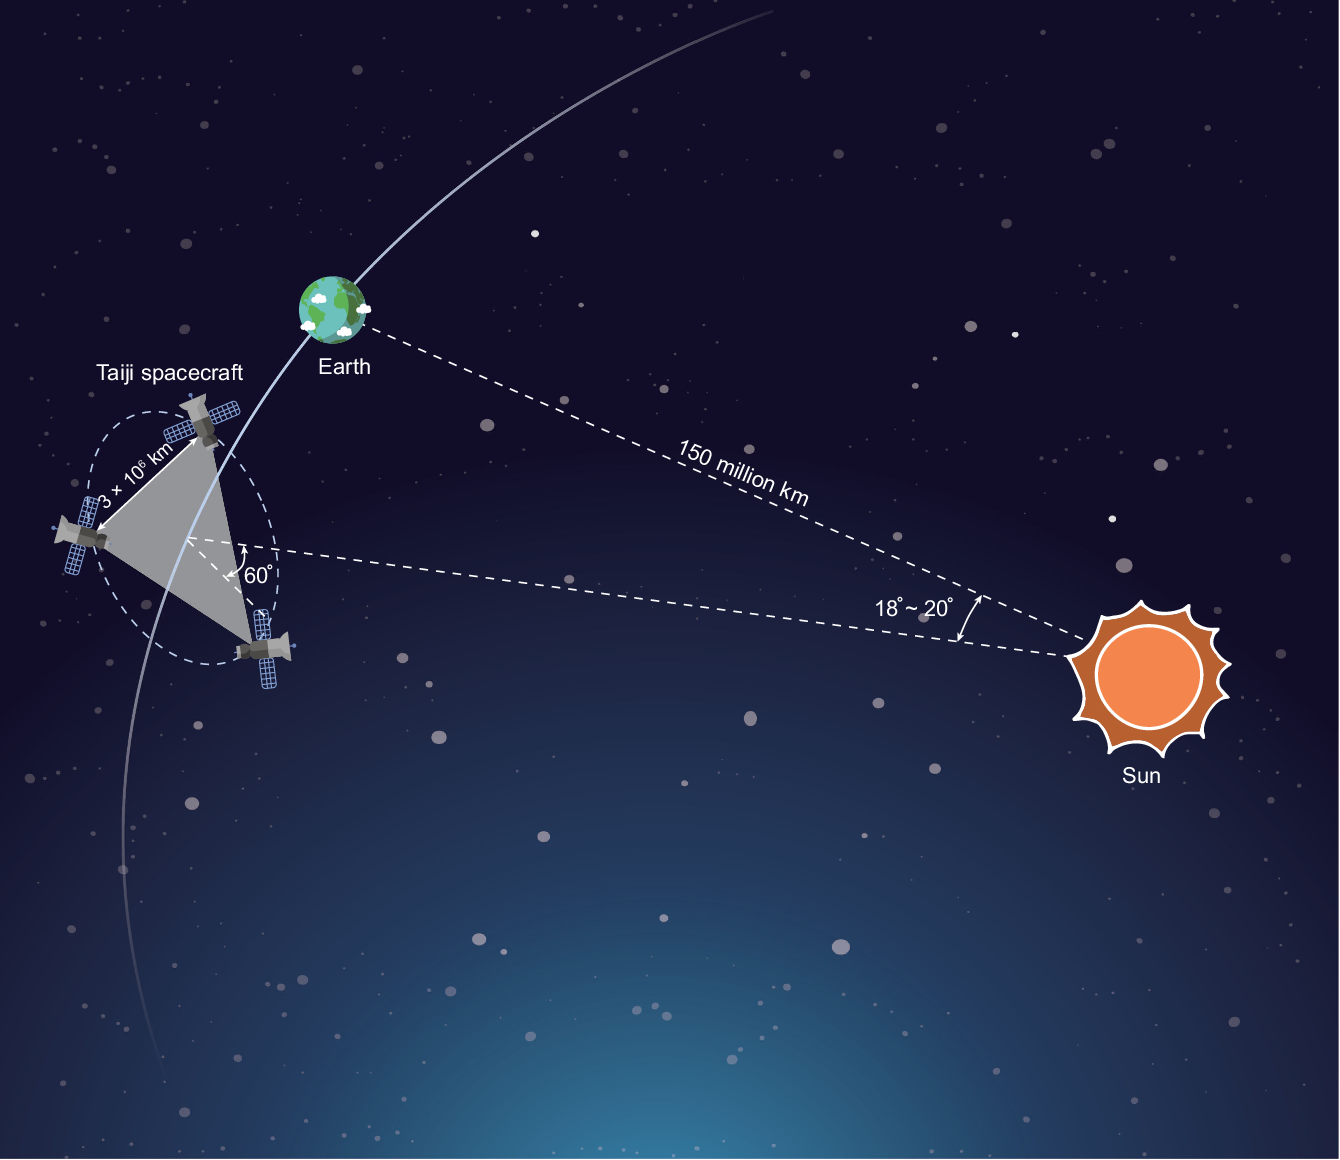
LISA Project
Noise: non-Gaussian and non-stationary
Signal challenges:
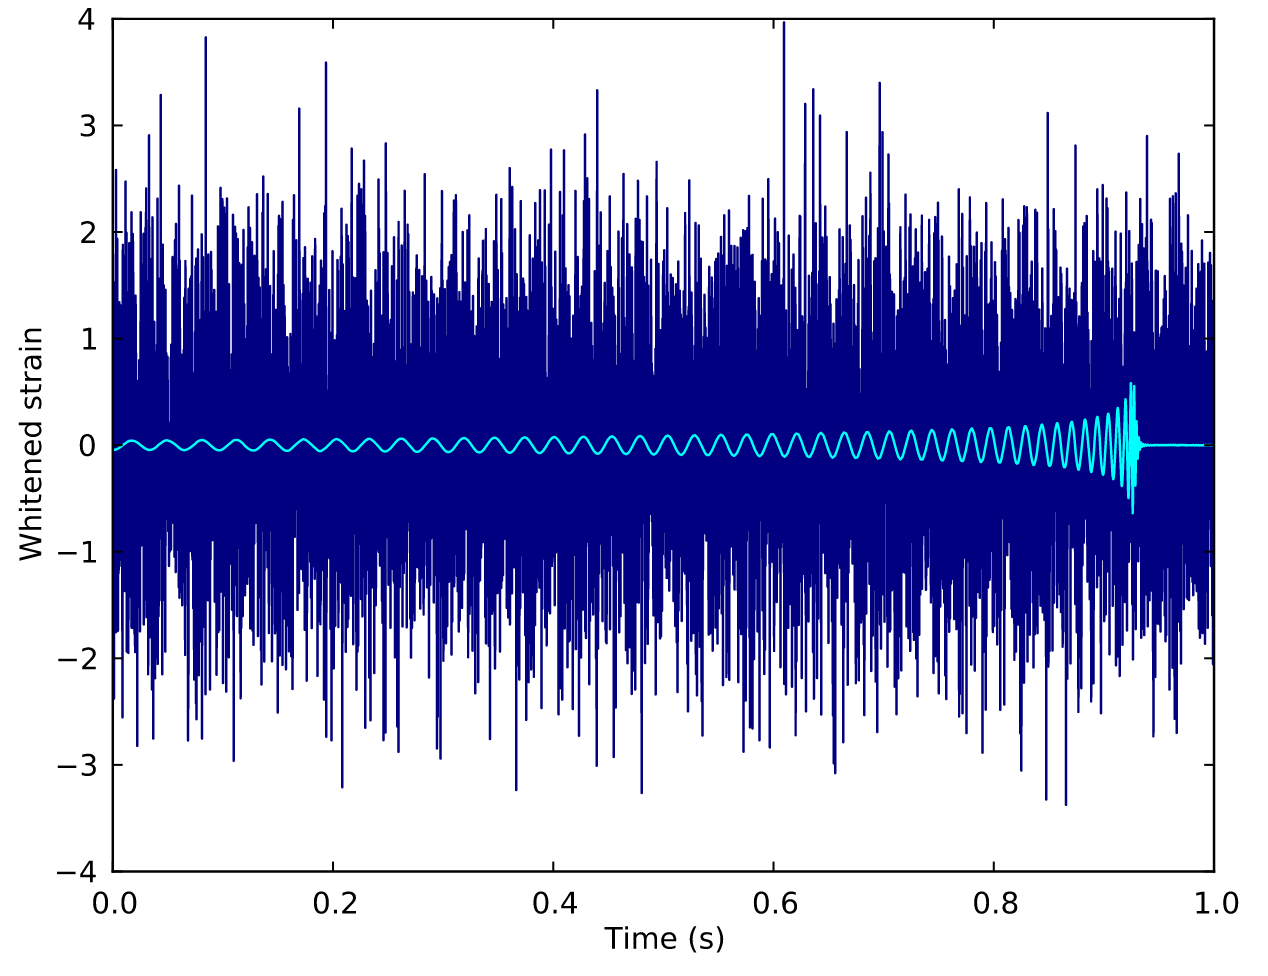
(Earth-based) A low signal-to-noise ratio (SNR) which is typically about 1/100 of the noise amplitude (-60 dB).
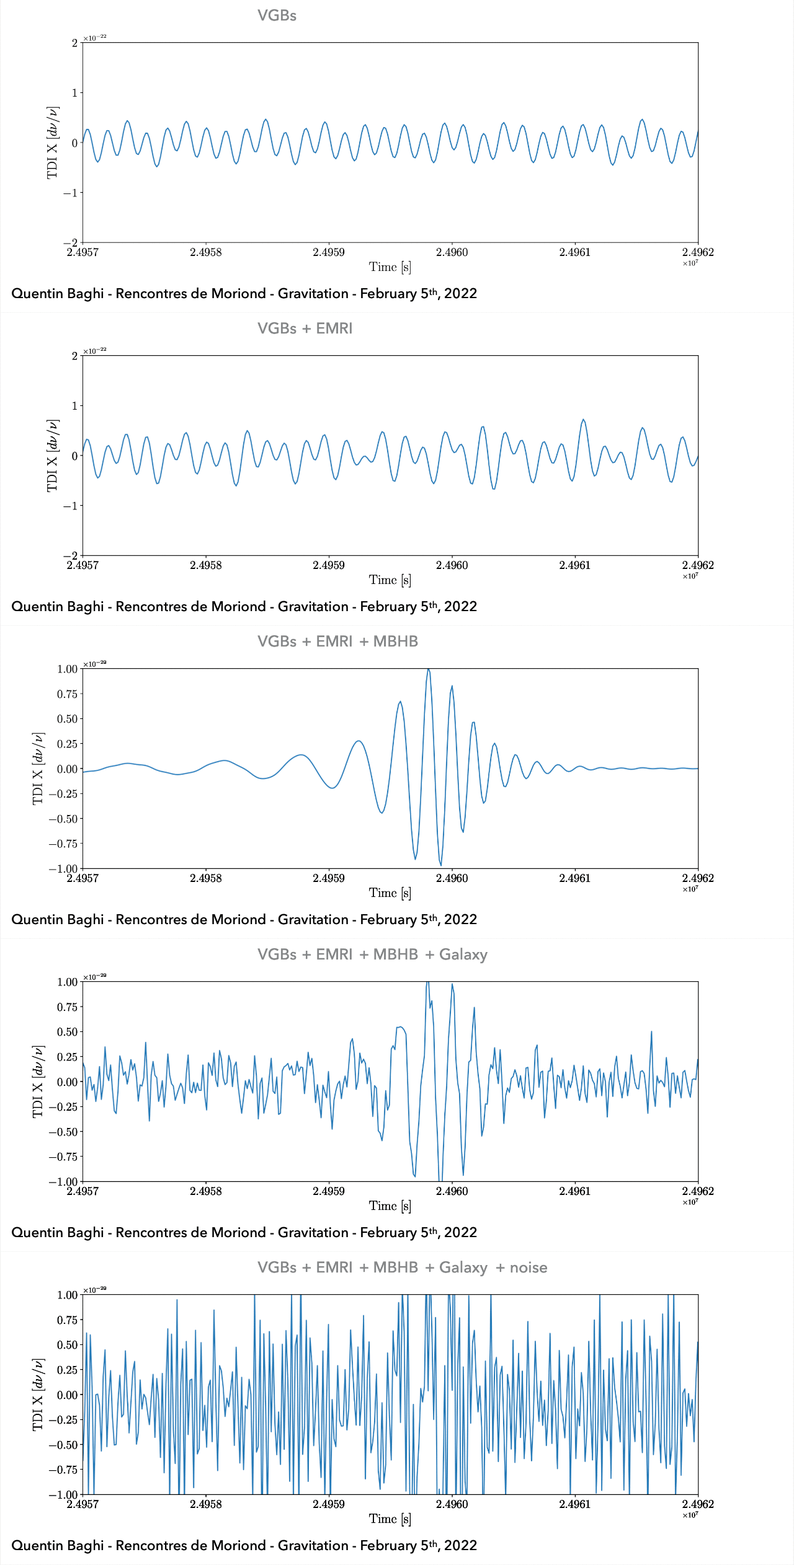
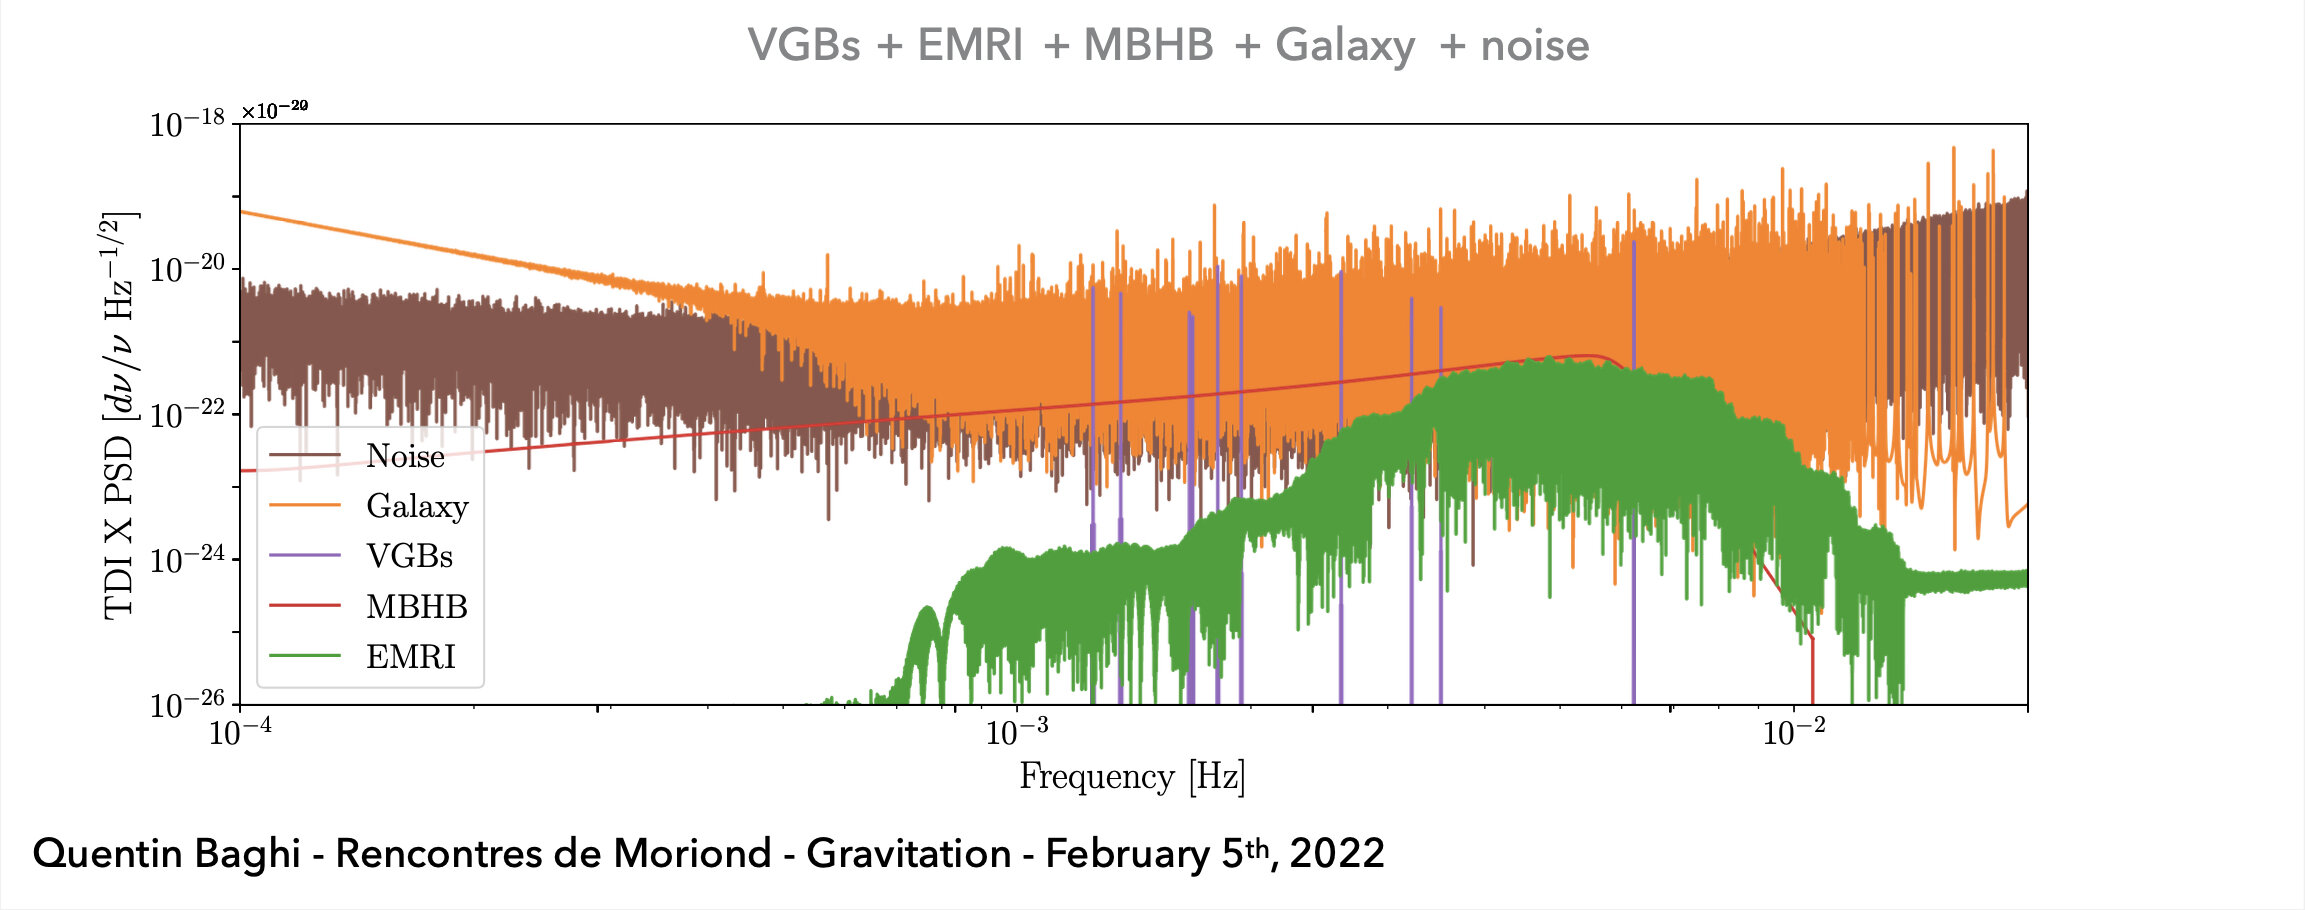
(Space-based) A superposition of all GW signals (e.g.: 104 of GBs, 10~102 of SMBHs, and 10~103 of EMRIs, etc.) received during the mission's observational run.
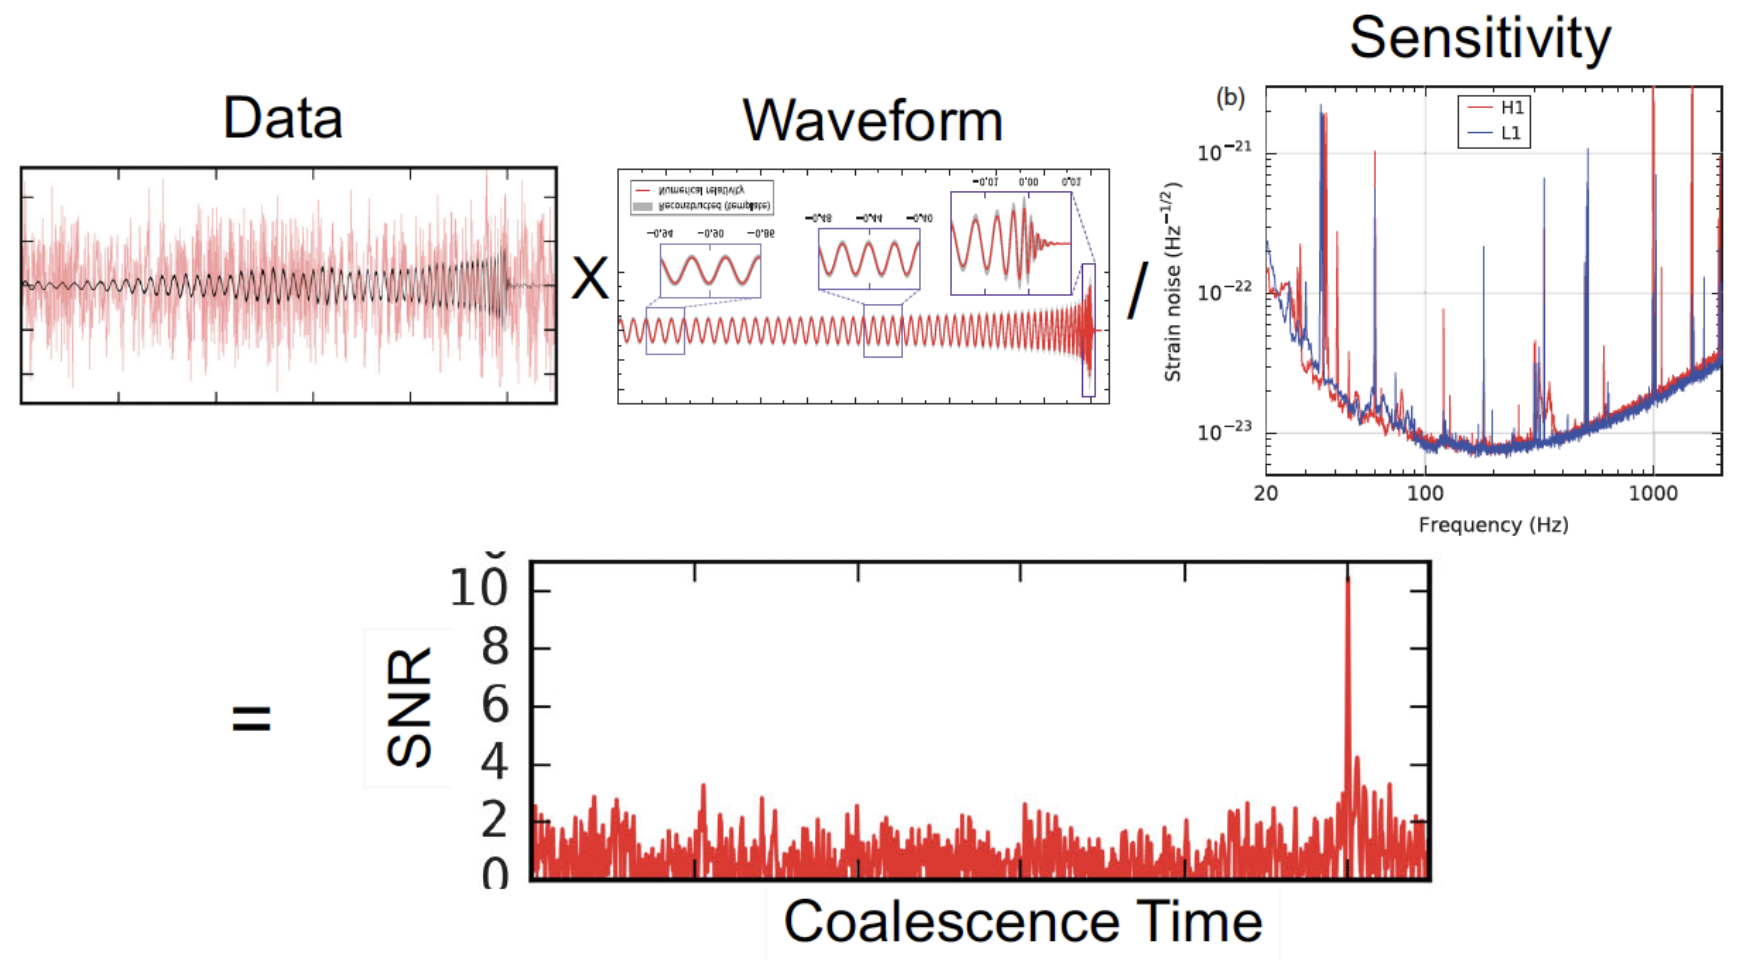
Matched Filtering Techniques (匹配滤波方法)
In Gaussian and stationary noise environments, the optimal linear algorithm for extracting weak signals
Statistical Approaches
Frequentist Testing:
Bayesian Testing:
Interpretable Gravitational Wave Data Analysis with DL and LLMs
hewang@ucas.ac.cn
Matched Filtering Techniques (匹配滤波方法)
In Gaussian and stationary noise environments, the optimal linear algorithm for extracting weak signals
Statistical Approaches
Frequentist Testing:
Bayesian Testing:
Interpretable Gravitational Wave Data Analysis with DL and LLMs
线性滤波器
输入序列
输出序列
脉冲响应函数:
hewang@ucas.ac.cn
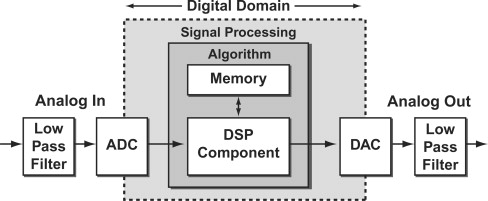
Digital Signal Processing
地基引力波探测科学数据的特点
噪声特点:非高斯 + 非稳态
信号特点:信噪比低 (约噪声幅度的1/100,约 -60dB )
Interpretable Gravitational Wave Data Analysis with DL and LLMs
波形模板库的局限性
需要大量的精确波形模板以确保无遗漏,至少百万数量级
受限于已知引力理论预言的波形模板,难以搜寻超越经典广相引力理论 的引力波信号
多信使天文学的兴起 + 引力波探测技术的进步
低(负)延迟 的引力波信号搜寻
海量的 累积数据和 成批的 引力波事件,有待高效的仔细分析
真实引力波数据的非高斯性
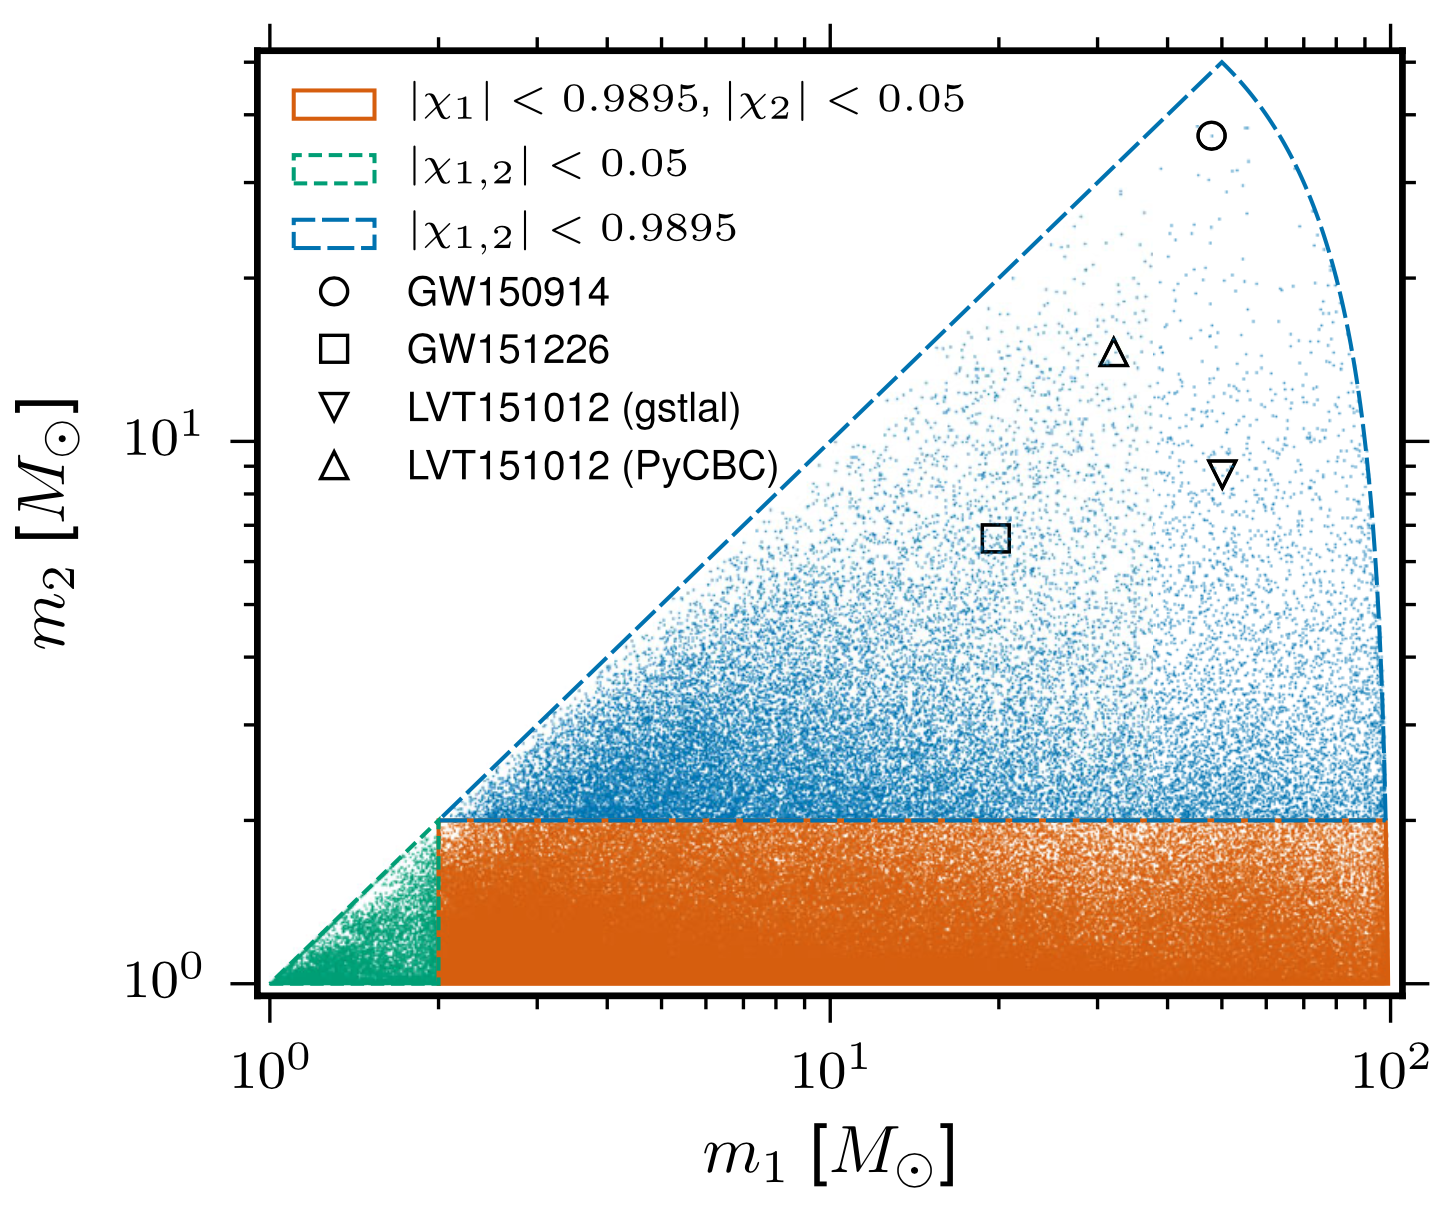
O1 观测运行时用的波形模板库
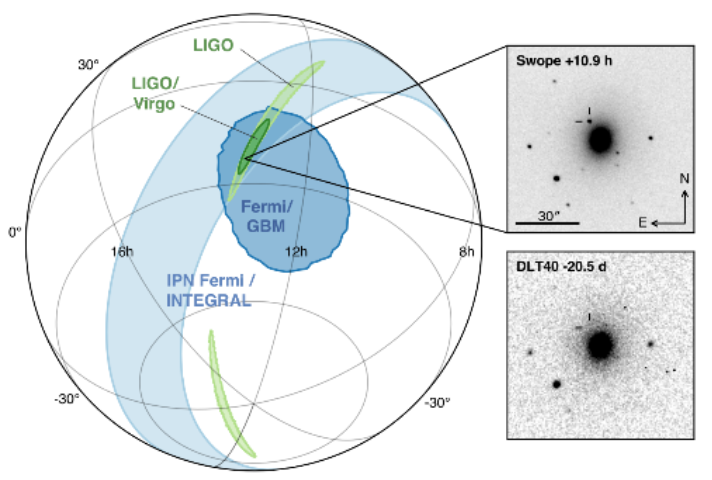
在 GW170817 事件后 1.74\(\pm\)0.05s 的伽玛暴 GRB 170817A
hewang@ucas.ac.cn
Interpretable Gravitational Wave Data Analysis with DL and LLMs
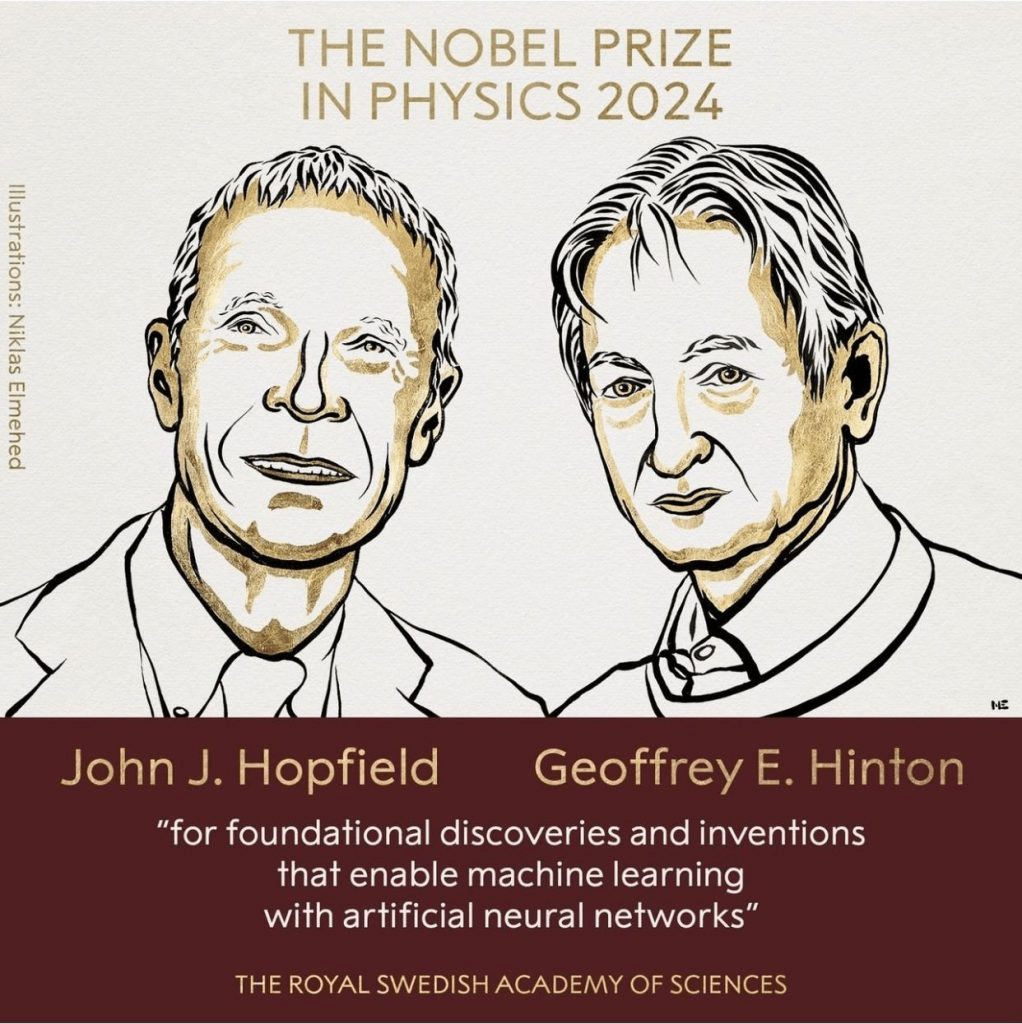
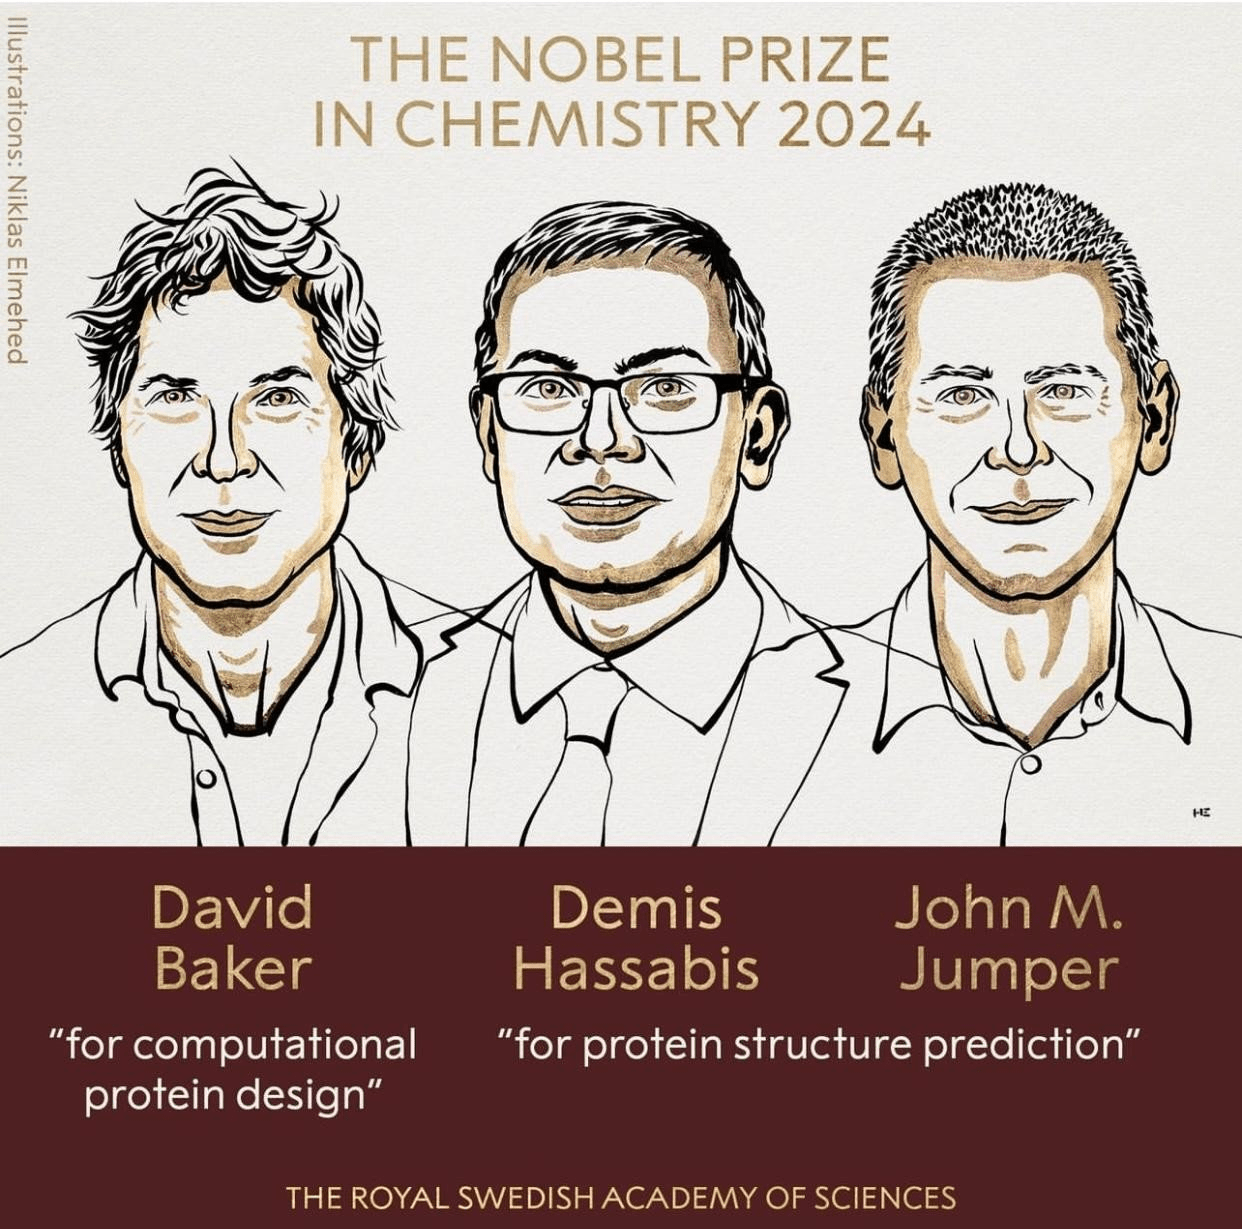
AlphaGo
围棋机器人
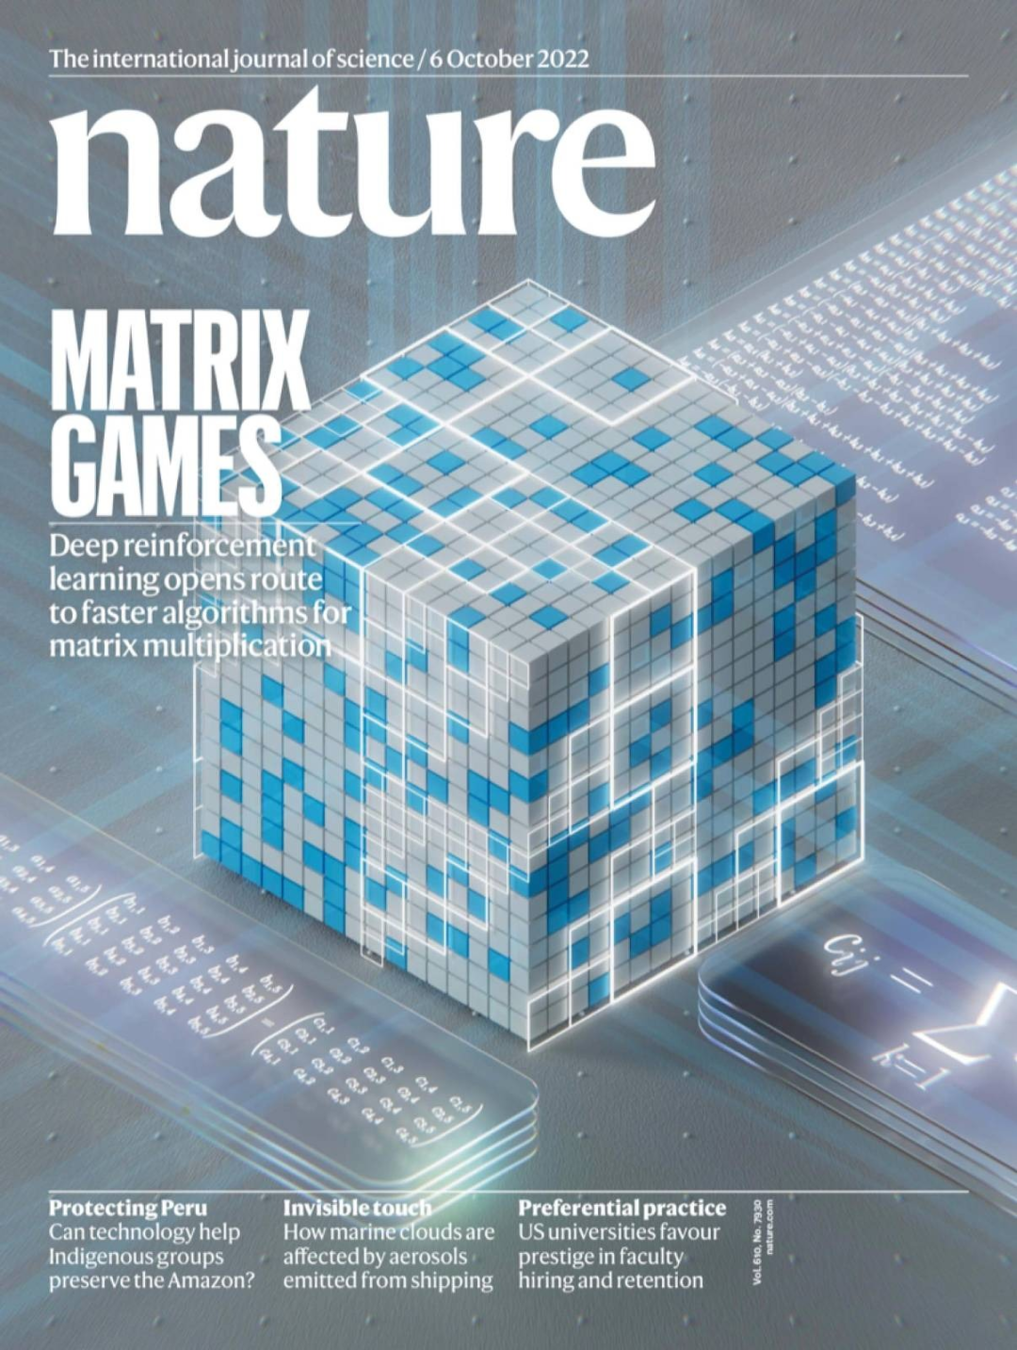
AlphaTensor
发现矩阵算法
AlphaFold
蛋白质结构预测
验证数学猜想
hewang@ucas.ac.cn
Interpretable Gravitational Wave Data Analysis with DL and LLMs
AlphaGo
围棋机器人
AlphaTensor
发现矩阵算法
AlphaFold
蛋白质结构预测
验证数学猜想
hewang@ucas.ac.cn
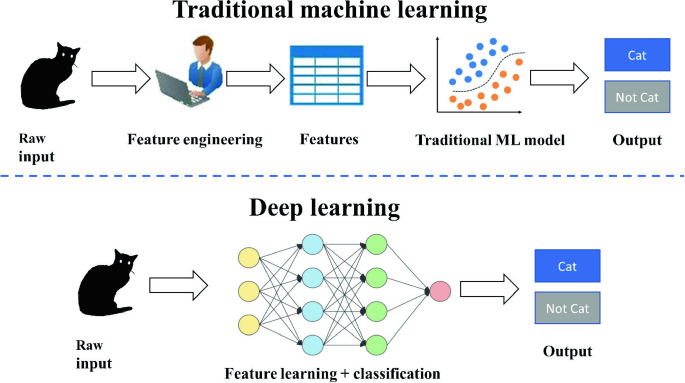
传统机器学习
深度学习
输入
特征提取
输入
特征
传统机器学习算法
输出
输入
自动特征提取 + 分类
输出
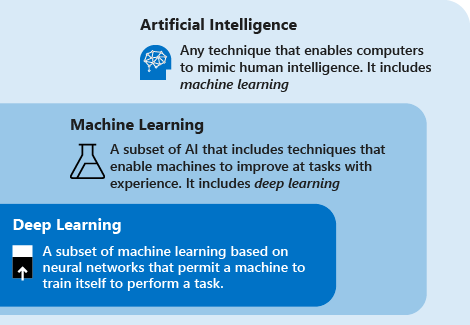
人工智能
机器学习
深度学习
人工智能的一个分支。机器学习是用数据或以往的经验,以此优化计算机程序的性能标准
机器学习的一个分支。基于神经网络结构实现端到端的一种建模方法
任何能实现以人类智能相似的方式做出反应的技术
机器学习:
线性回归模型、决策树模型、支撑向量机、马尔科夫链-蒙特卡洛方法 (MCMC) ...
深度学习:
用神经网络实现自动特征提取的模型
深度神经网络是一个万能的函数拟合器,可以表征任意复杂度的非线性函数映射
特点:端到端、数据驱动、过参数化 ...
传统引力波数据分析方法 ~ 传统机器学习方法
AI is taking over the world... literally everywhere
Let's be honest about our motivations... 😉
The perfectly valid "scientific" reasons:
Credit: Chris Messenger (MLA meeting,, Jan 2025)
The core motivations behind nearly all AI+GW research
So much data, so little time!
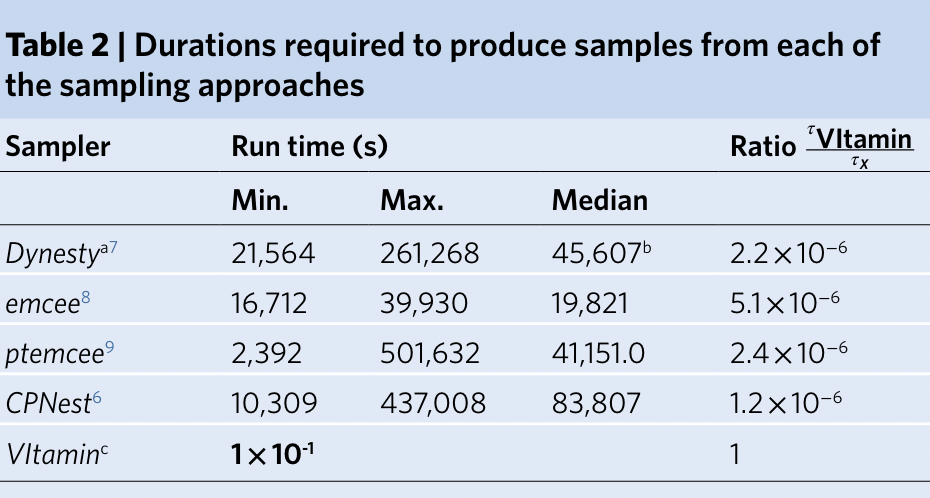
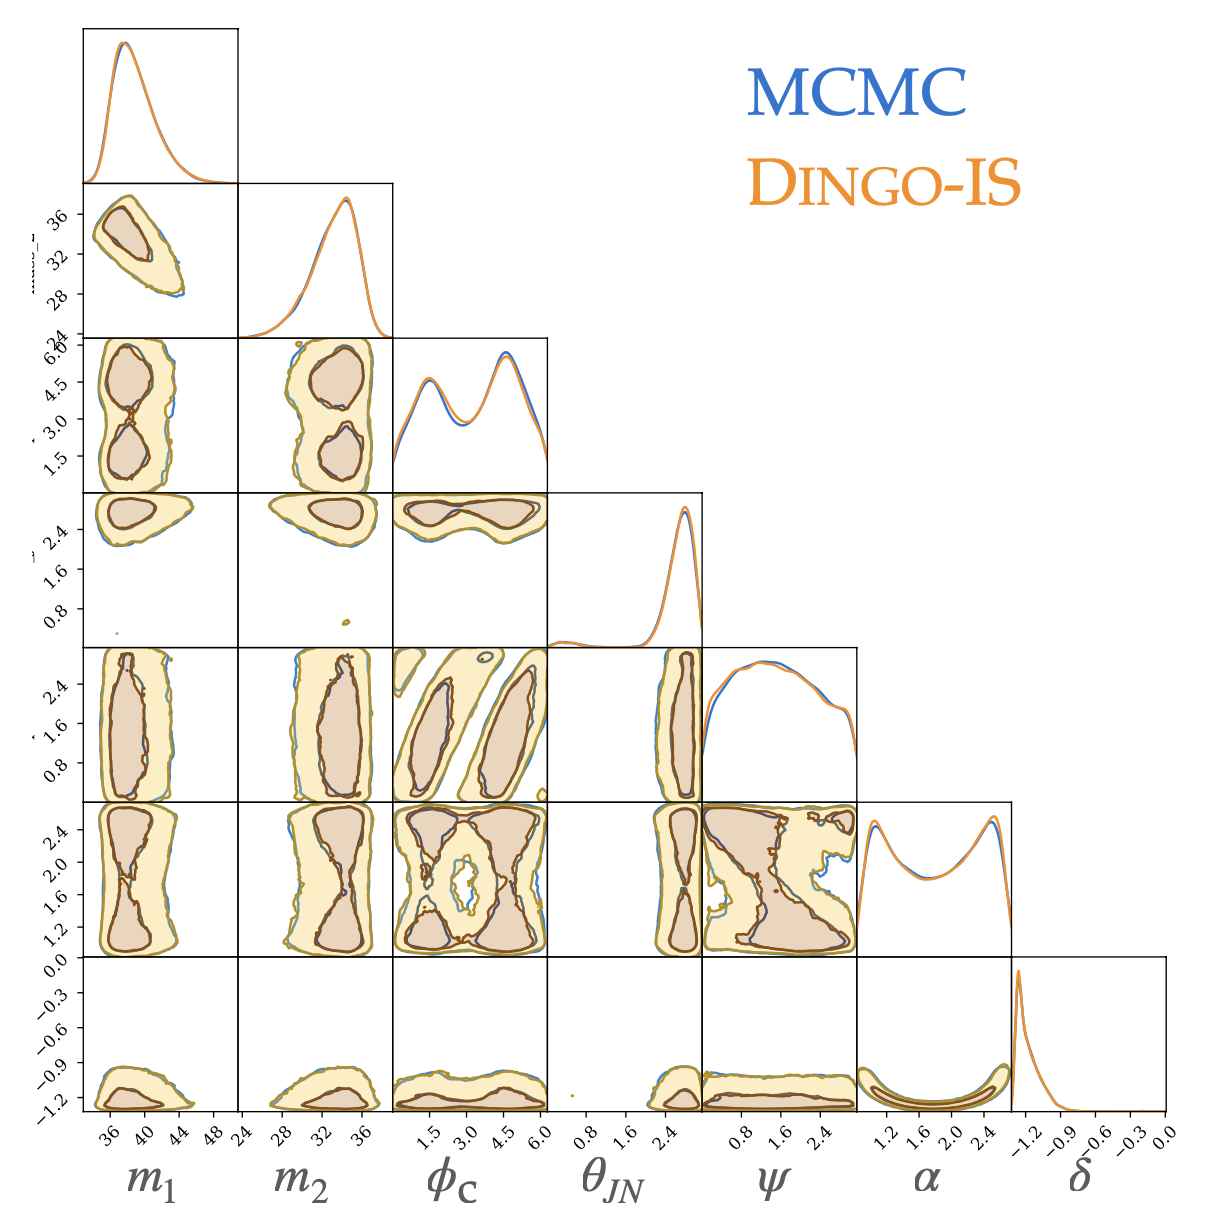
• Bayesian parameter estimation
• Replaces computationally intensive components
Consistently outperforms traditional approaches
• Unmodelled burst searches
• Continuous GW searches
Provides deeper insights into complex problems
• Reveals patterns through interpretability
• Enables previously impractical approaches
* When properly trained and validated on appropriate datasets
Credit: Chris Messenger (MLA meeting,, Jan 2025)
GW
AI for GW
LLM for GW
hewang@ucas.ac.cn
Uncovering the "black box" to reveal
how AI actually processes GW strain data
Interpretable Gravitational Wave Data Analysis with DL and LLMs
hewang@ucas.ac.cn
Core Insight from Computer Vision
Performance Analysis
Pioneering Research Publications
PRL, 2018, 120(14): 141103.
PRD, 2018, 97(4): 044039.
Interpretable Gravitational Wave Data Analysis with DL and LLMs
hewang@ucas.ac.cn
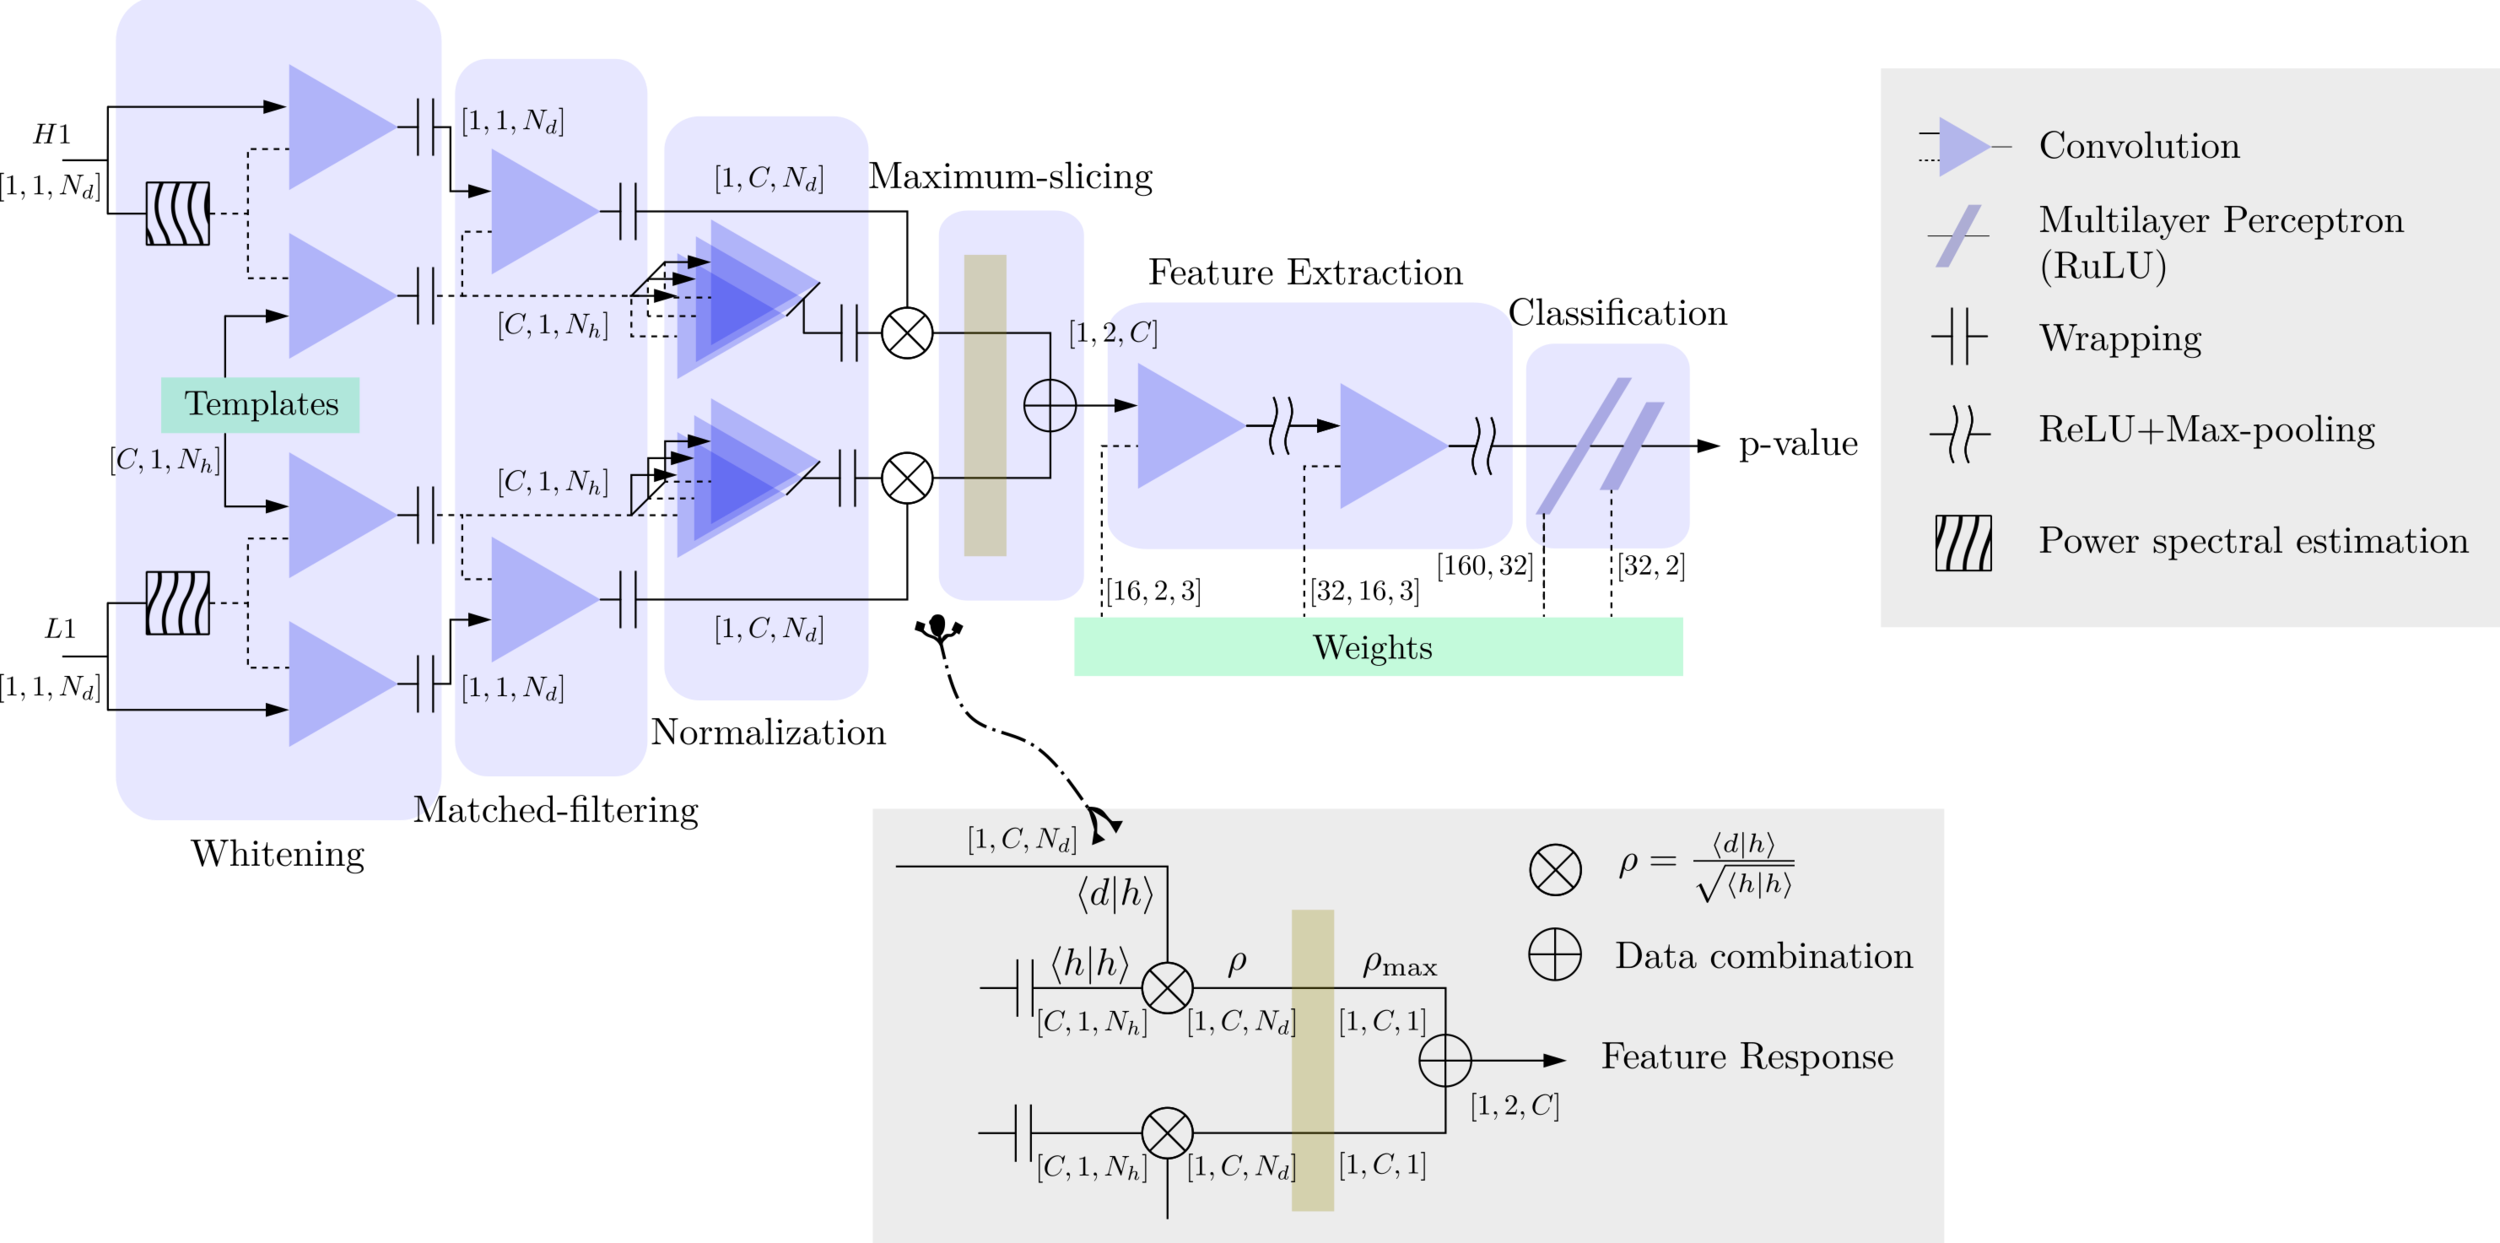
Matched-filtering Convolutional Neural Network (MFCNN)
HW, SC Wu, ZJ CAO, et al. PRD 101, 10 (2020): 104003
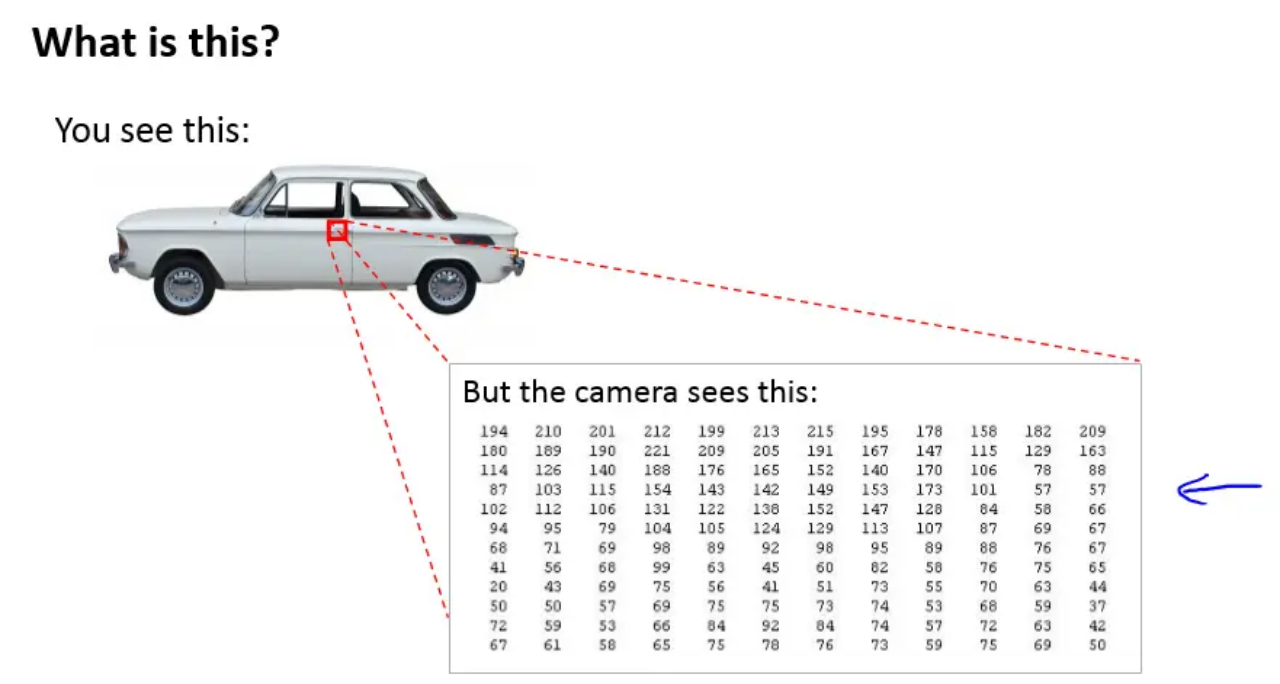
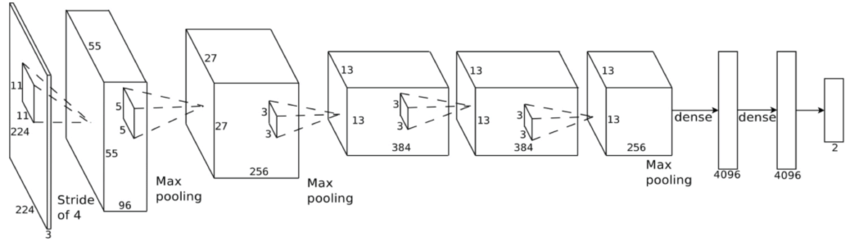
Convolutional Neural Network (ConvNet or CNN)
feature extraction
classifier
>> Is it matched-filtering ?
>> Wait, It can be matched-filtering!
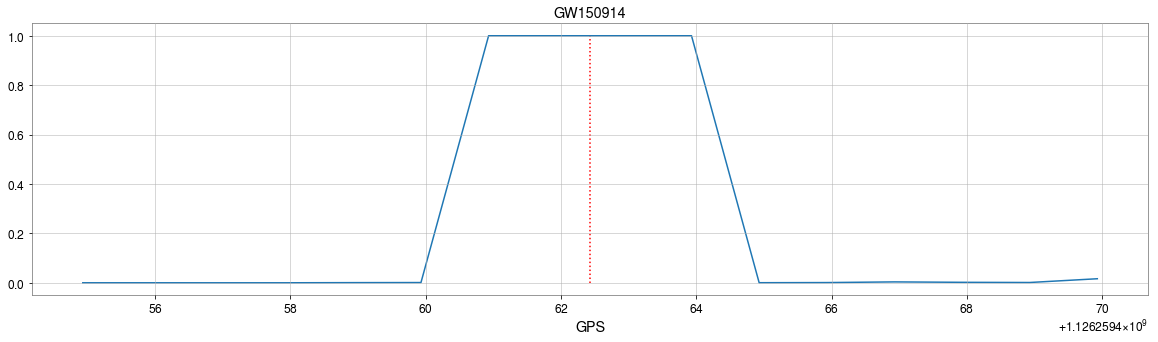
GW150914
GW150914
Interpretable Gravitational Wave Data Analysis with DL and LLMs
hewang@ucas.ac.cn
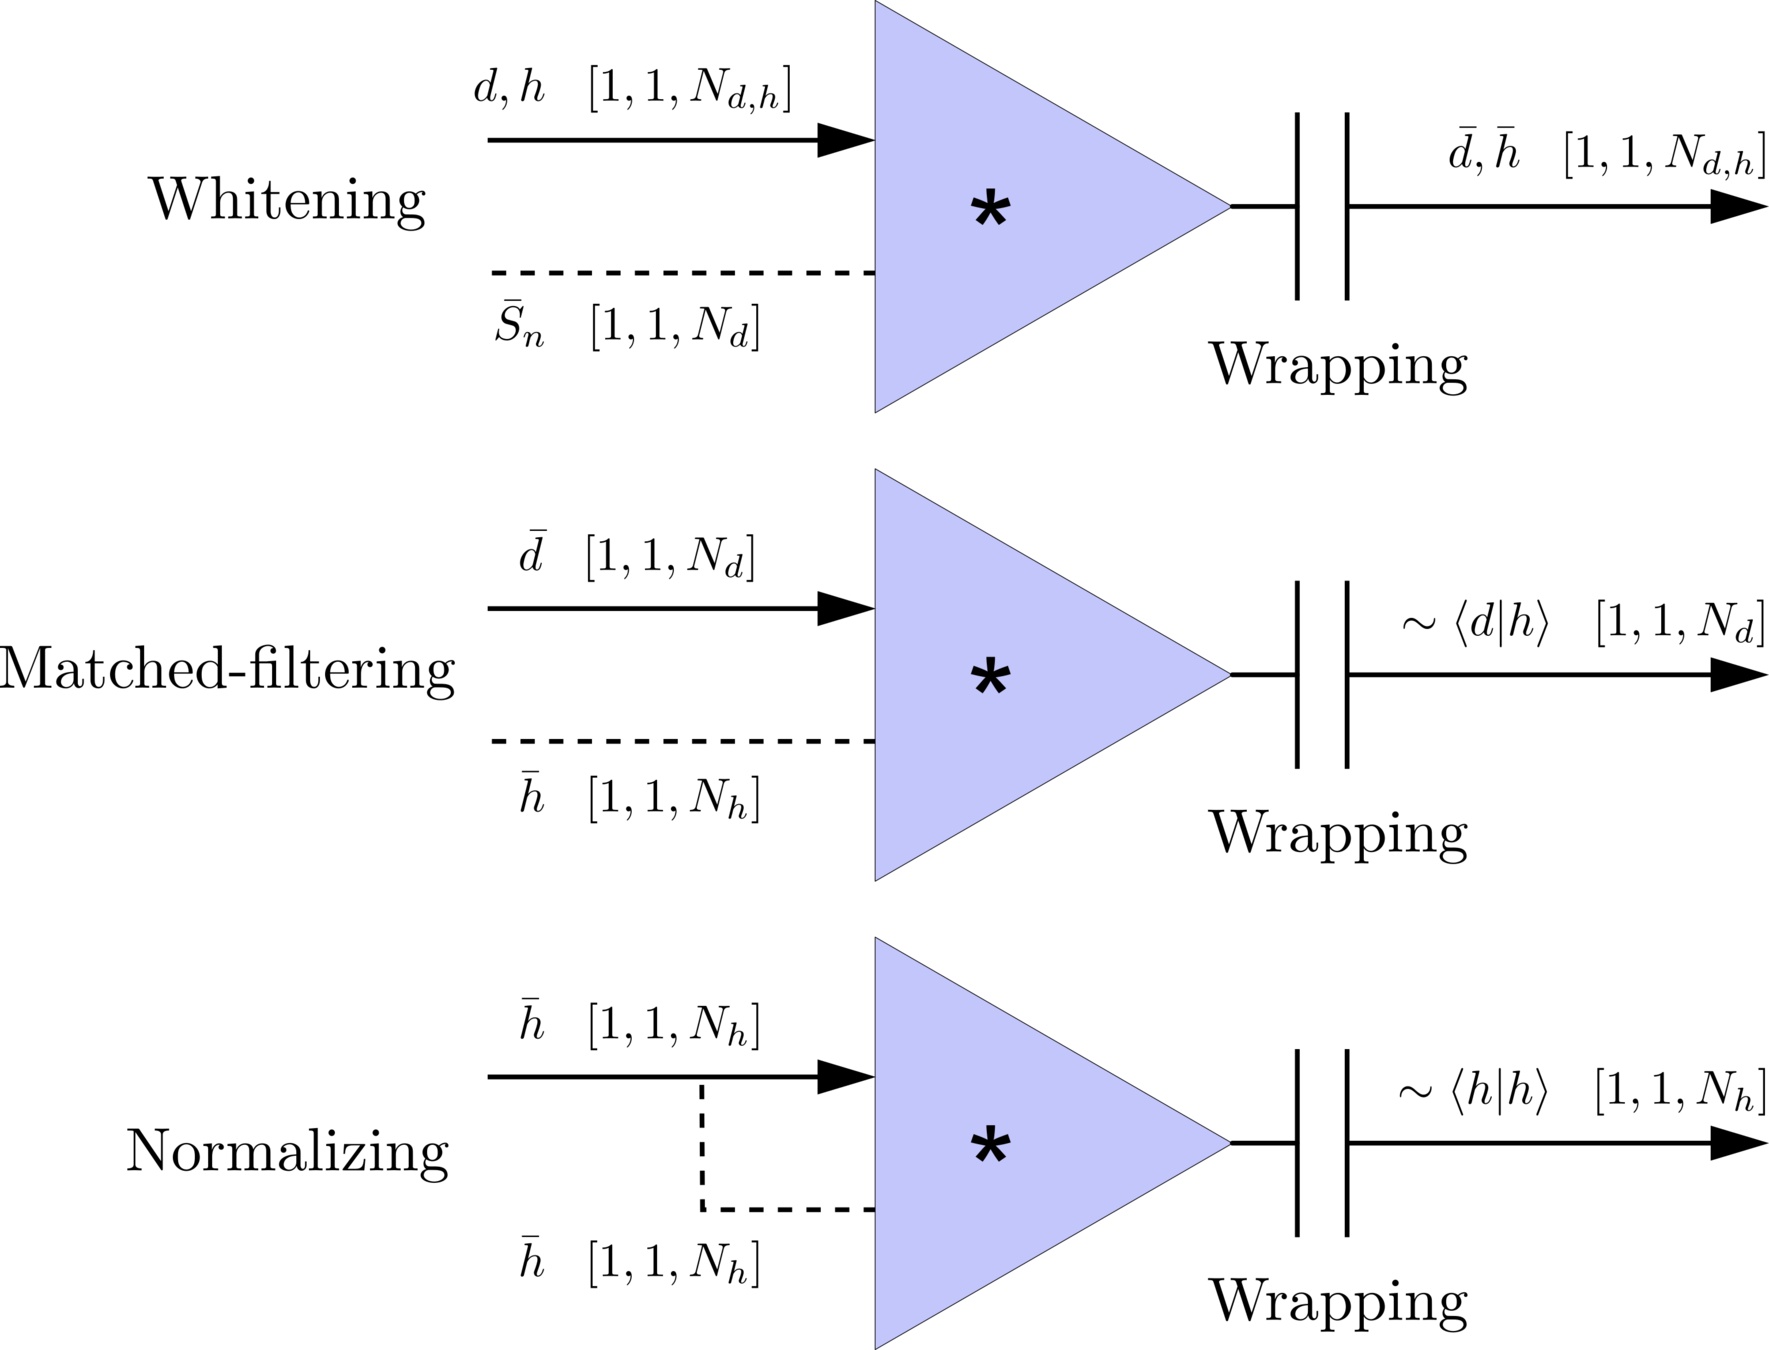
Transform matched-filtering method from frequency domain to time domain.
The square of matched-filtering SNR for a given data \(d(t) = n(t)+h(t)\):
\(S_n(|f|)\) is the one-sided average PSD of \(d(t)\)
where
Deep Learning Framework
Time Domain
(matched-filtering)
(normalizing)
(whitening)
Frequency Domain
Interpretable Gravitational Wave Data Analysis with DL and LLMs
hewang@ucas.ac.cn
Transform matched-filtering method from frequency domain to time domain.
The square of matched-filtering SNR for a given data \(d(t) = n(t)+h(t)\):
\(S_n(|f|)\) is the one-sided average PSD of \(d(t)\)
where
Deep Learning Framework
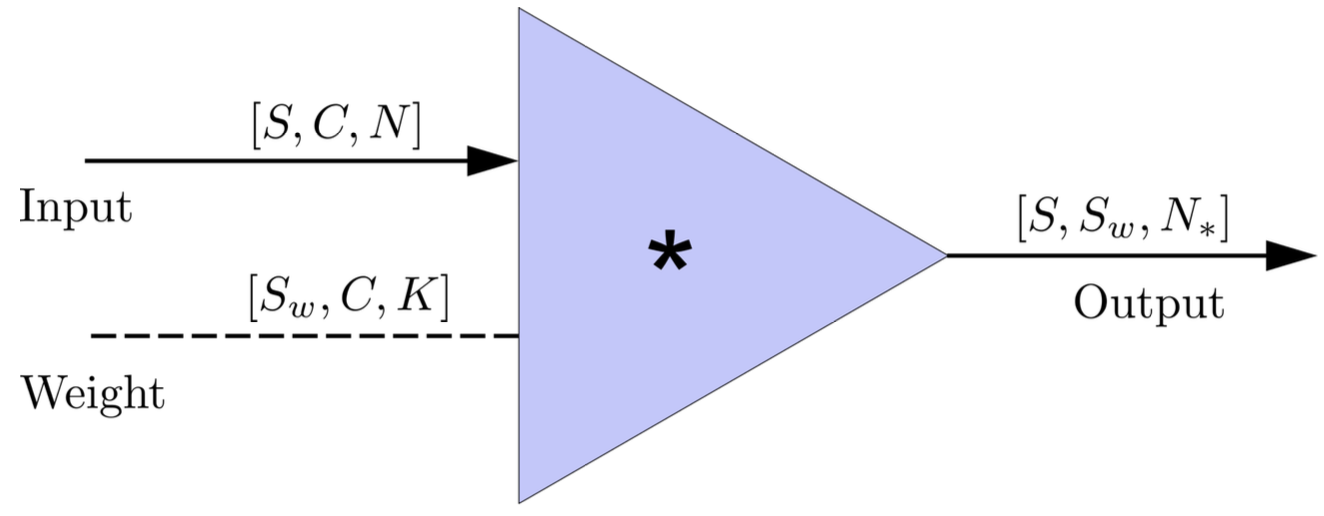
FYI: \(N_\ast = \lfloor(N-K+2P)/S\rfloor+1\)
(A schematic illustration for a unit of convolution layer)
Time Domain
(matched-filtering)
(normalizing)
(whitening)
Frequency Domain
Interpretable Gravitational Wave Data Analysis with DL and LLMs
hewang@ucas.ac.cn
import mxnet as mx
from mxnet import nd, gluon
from loguru import logger

def MFCNN(fs, T, C, ctx, template_block, margin, learning_rate=0.003):
    logger.success('Loading MFCNN network!')
    net = gluon.nn.Sequential()
    with net.name_scope():
        net.add(MatchedFilteringLayer(mod=fs*T, fs=fs,
                                      template_H1=template_block[:,:1],
                                      template_L1=template_block[:,-1:]))
        net.add(CutHybridLayer(margin = margin))
        net.add(Conv2D(channels=16, kernel_size=(1, 3), activation='relu'))
        net.add(MaxPool2D(pool_size=(1, 4), strides=2))
        net.add(Conv2D(channels=32, kernel_size=(1, 3), activation='relu'))
        net.add(MaxPool2D(pool_size=(1, 4), strides=2))
        net.add(Flatten())
        net.add(Dense(32))
        net.add(Activation('relu'))
        net.add(Dense(2))
	# Initialize parameters of all layers
    net.initialize(mx.init.Xavier(magnitude=2.24), ctx=ctx, force_reinit=True)
    return net
1 sec duration
35 templates used
Explainable AI Approach
Matched-filtering Convolutional Neural Network (MFCNN)
The available codes (2019): https://gist.github.com/iphysresearch/a00009c1eede565090dbd29b18ae982c
HW, SC Wu, ZJ CAO, et al. PRD 101, 10 (2020): 104003
Interpretable Gravitational Wave Data Analysis with DL and LLMs
hewang@ucas.ac.cn
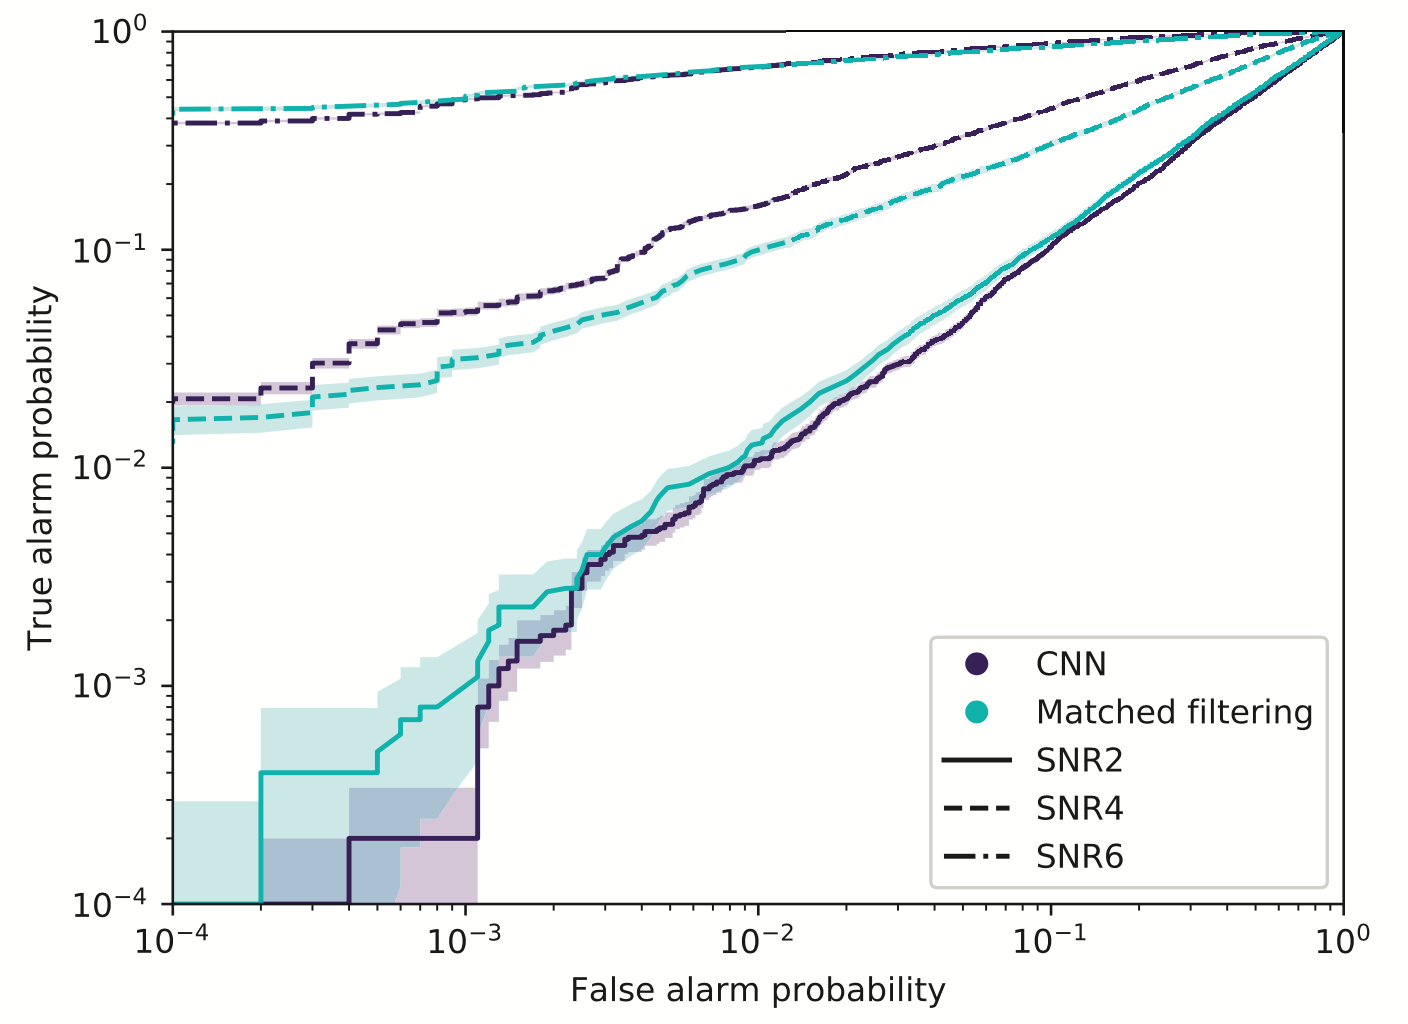
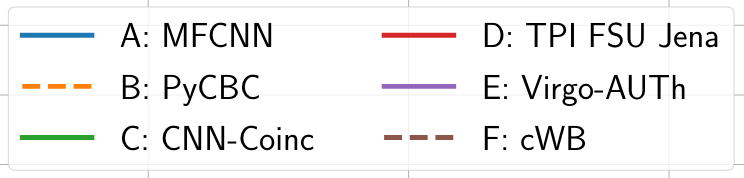
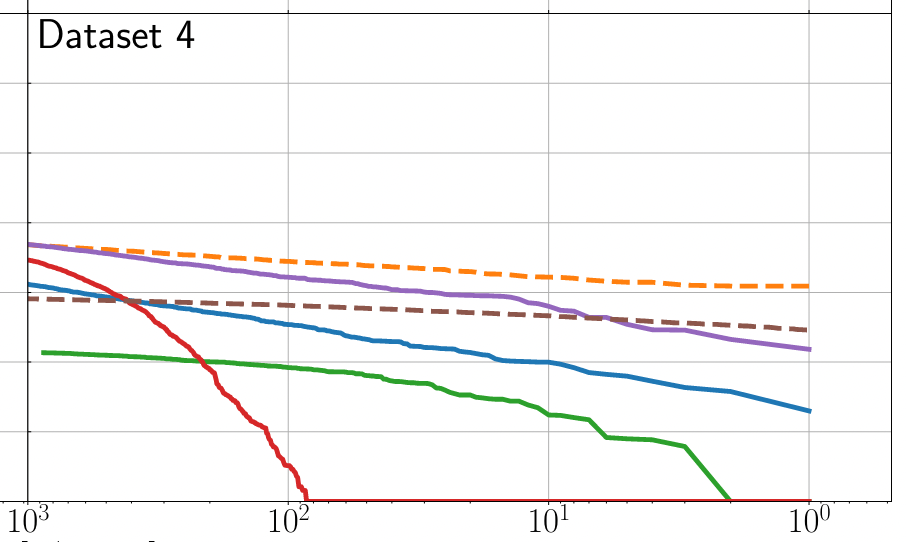
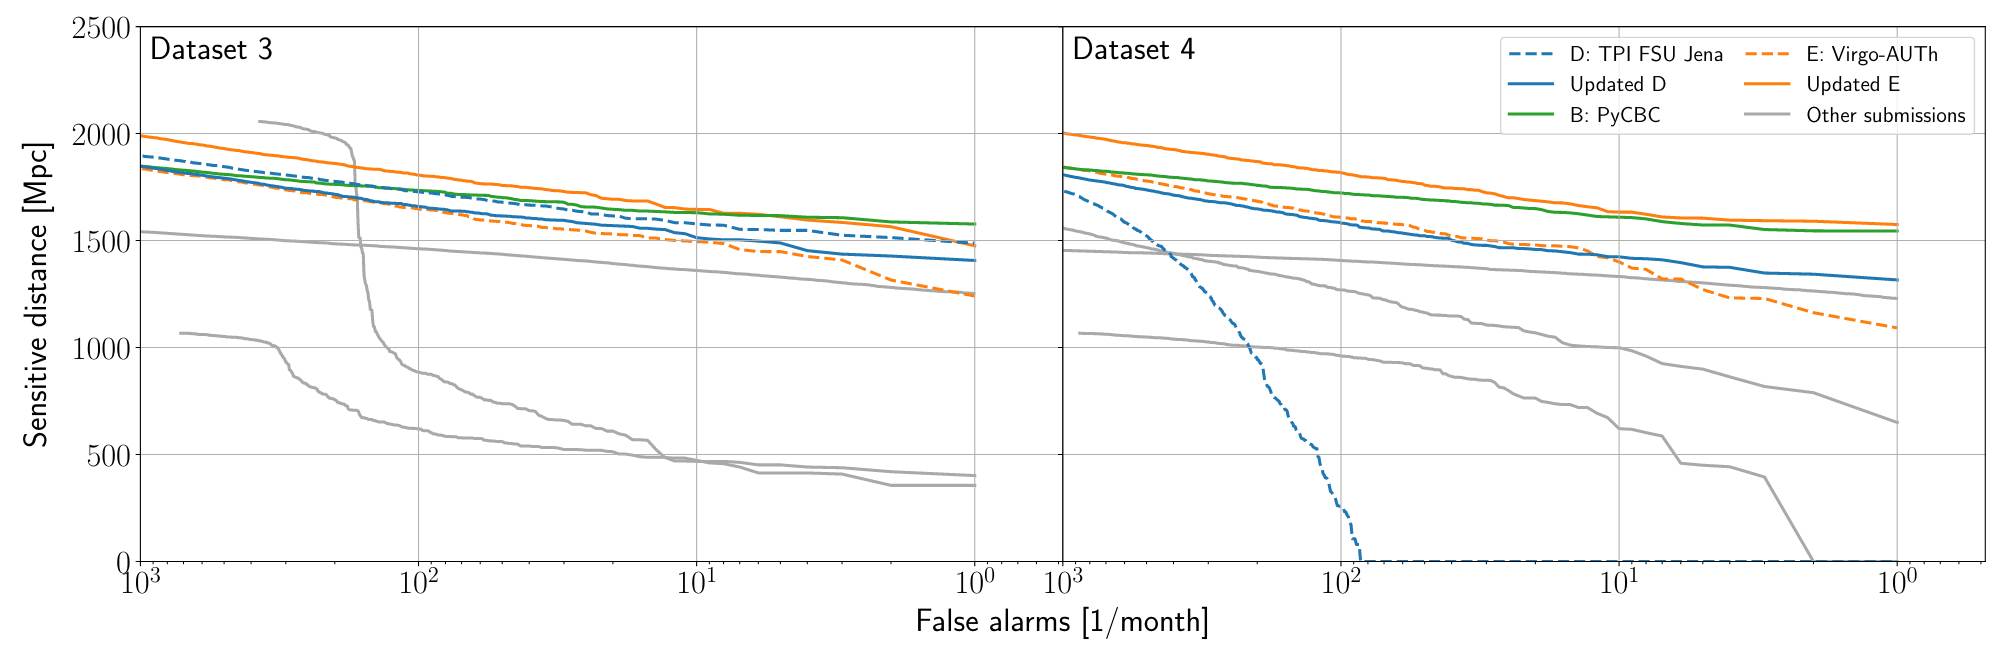
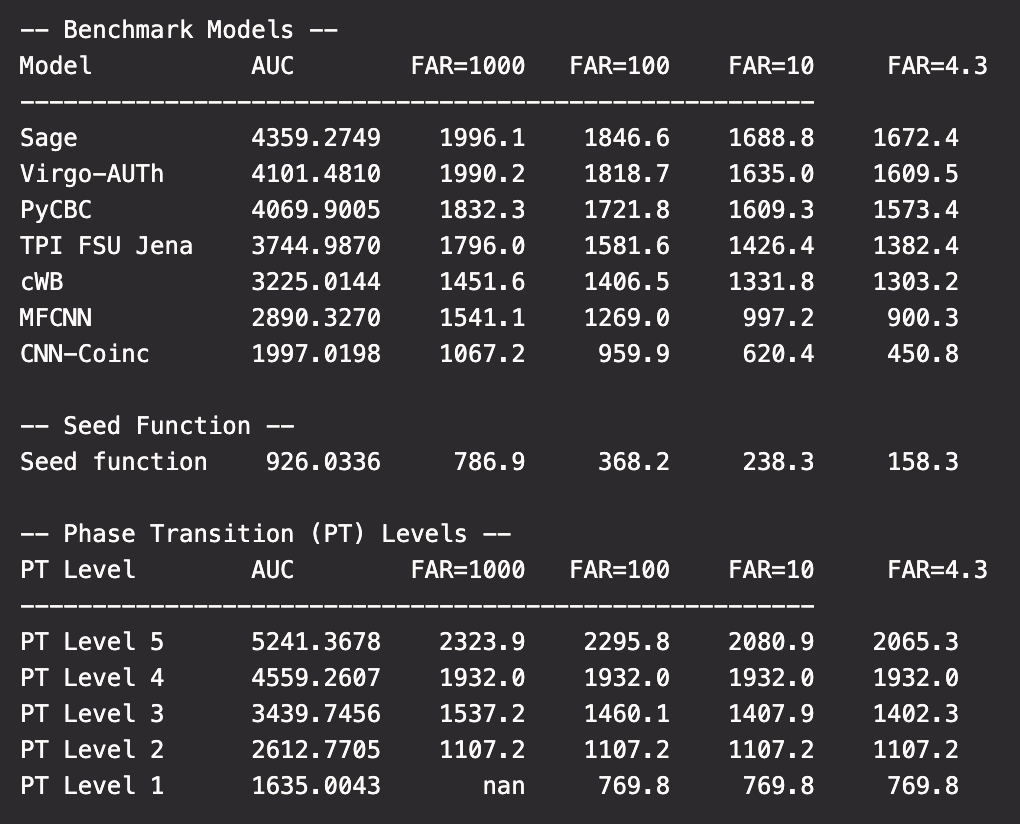
Benchmark Results
Publications
Key Findings
Note on Benchmark Limitations:
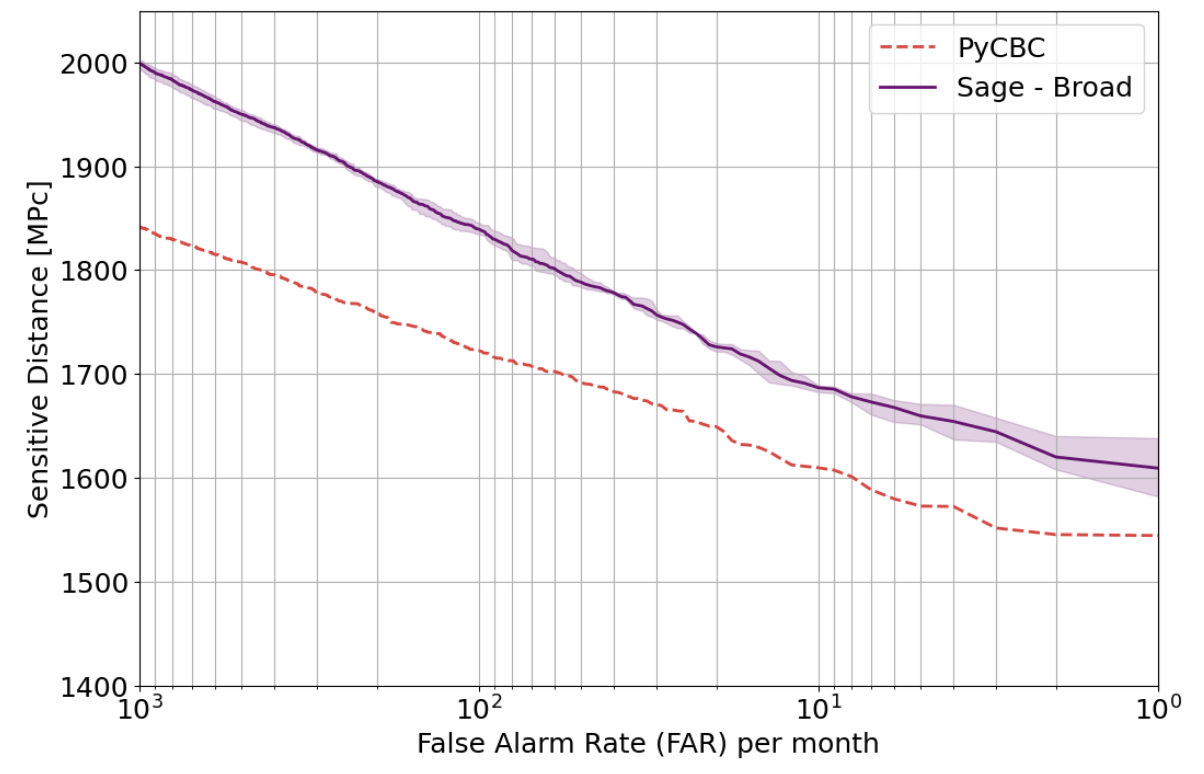
Outperforming PyCBC doesn't conclusively prove that matched filtering is inferior to AI methods. This is both because the dataset represents a specific distribution and because PyCBC settings could be further optimized for this particular benchmark.
arXiv:2501.13846 [gr-qc]
Phys. Rev. D 107, 023021 (2023)
Interpretable Gravitational Wave Data Analysis with DL and LLMs
hewang@ucas.ac.cn
AI Model Denoising
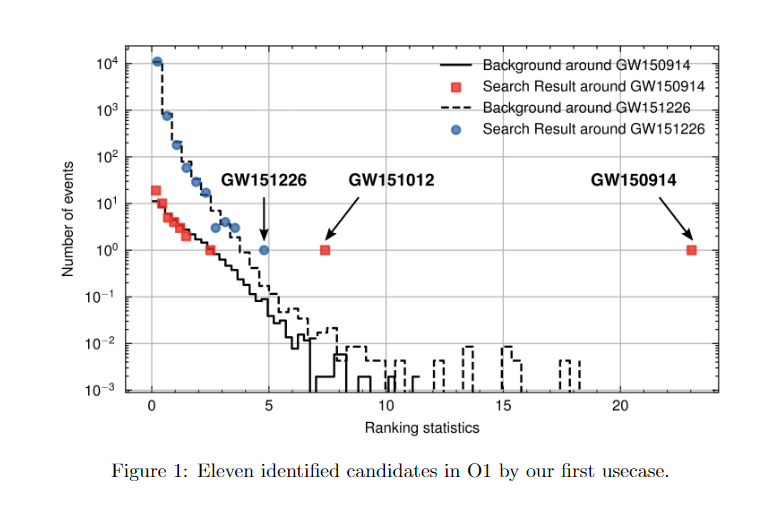
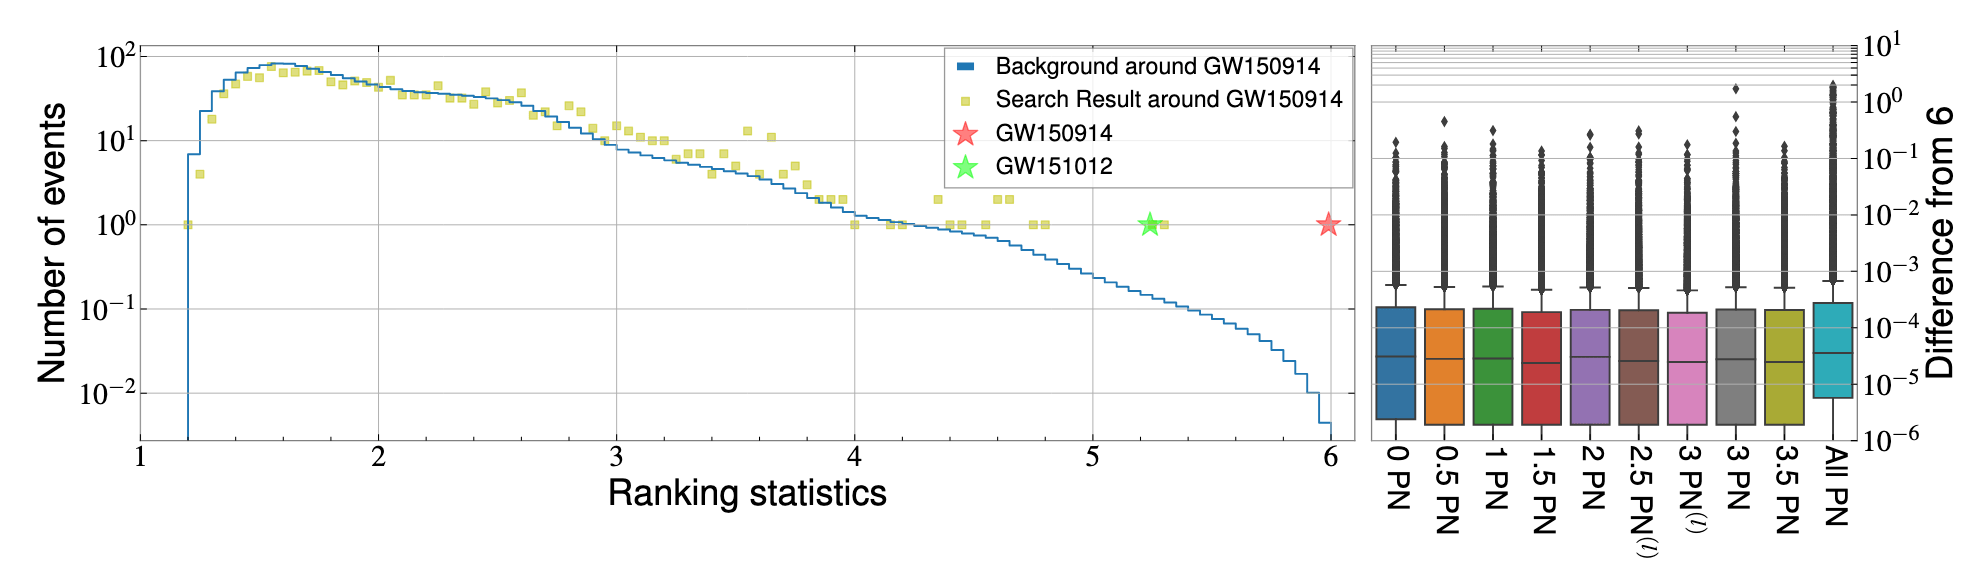
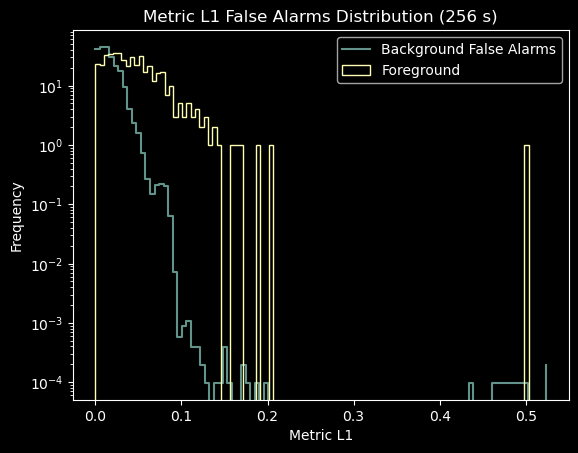
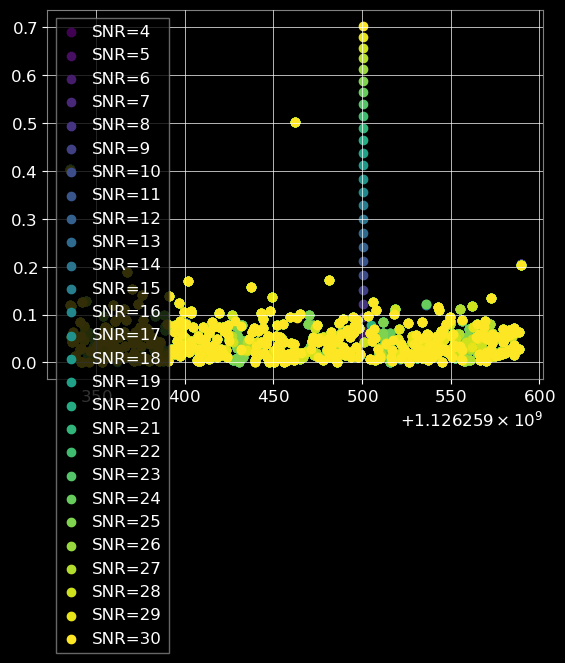
Our Model's Detection Statistics
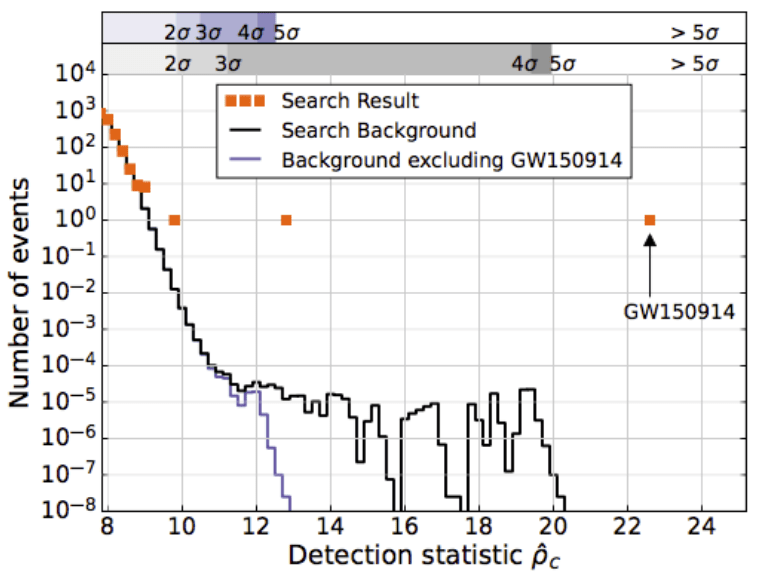
LVK Official Detection Statistics
Signal denoising visualization using our deep learning model (Transformer-based)
Detection statistics from our AI model showing O1 events
HW et al 2024 MLST 5 015046
GW151226
GW151012
Official detection statistics from LVK collaboration
LVK. PRD (2016). arXiv:1602.03839
Interpretable Gravitational Wave Data Analysis with DL and LLMs
hewang@ucas.ac.cn
Interpretable Gravitational Wave Data Analysis with DL and LLMs
hewang@ucas.ac.cn
B. P. Abbott et al. (LIGO-Virgo), PRD 100, 104036 (2019).
Yu-Xin Wang, Xiaotong Wei, Chun-Yue Li, Tian-Yang Sun, Shang-Jie Jin, He Wang*, Jing-Lei Cui, Jing-Fei Zhang, and Xin Zhang*. arXiv:2410.20129
PRD (2025)
arXiv:2407.07820 [gr-qc]
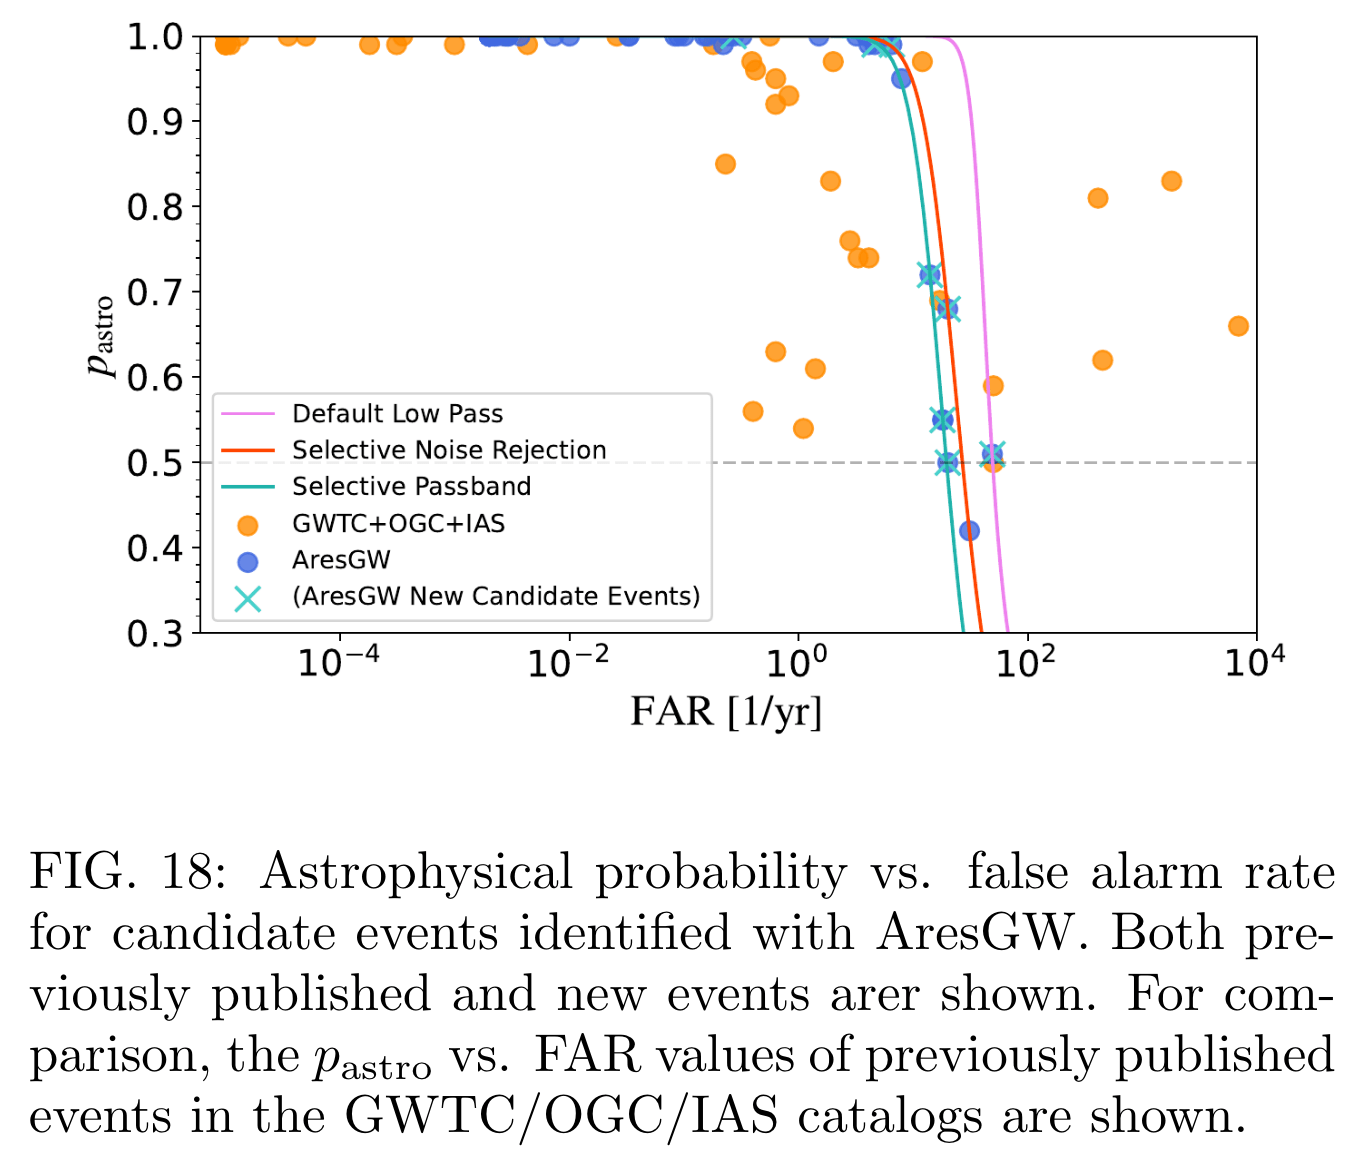
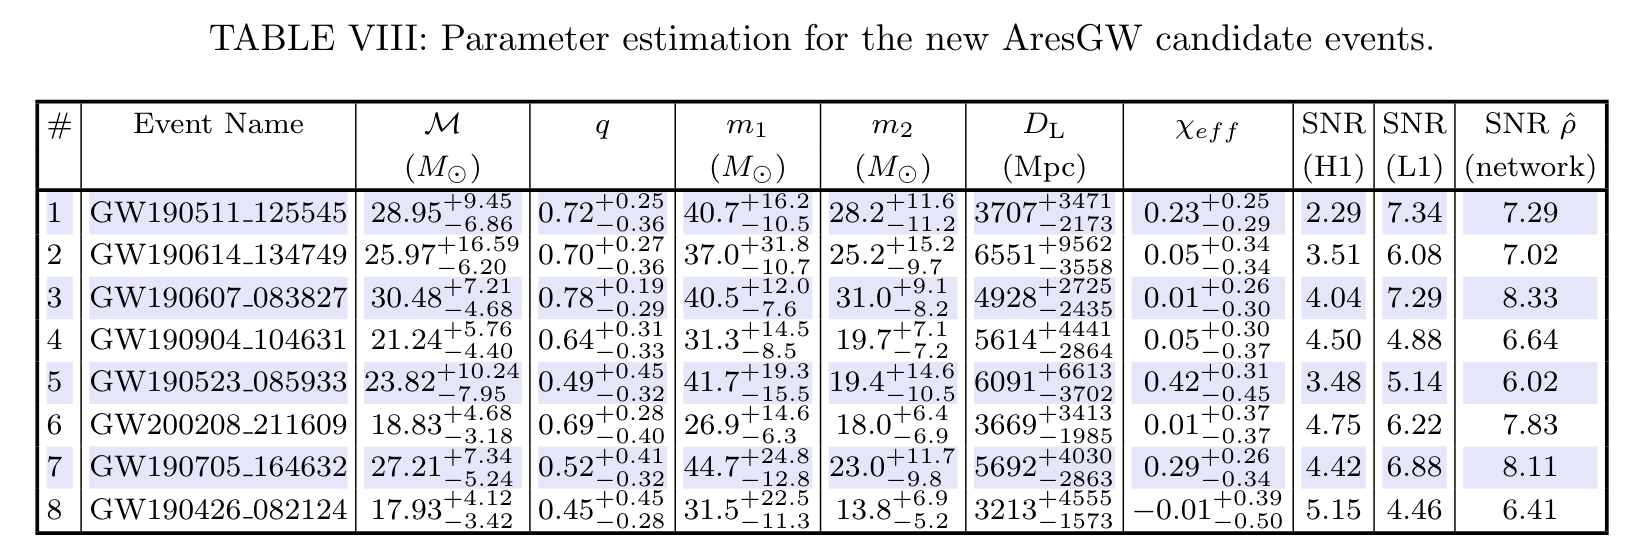
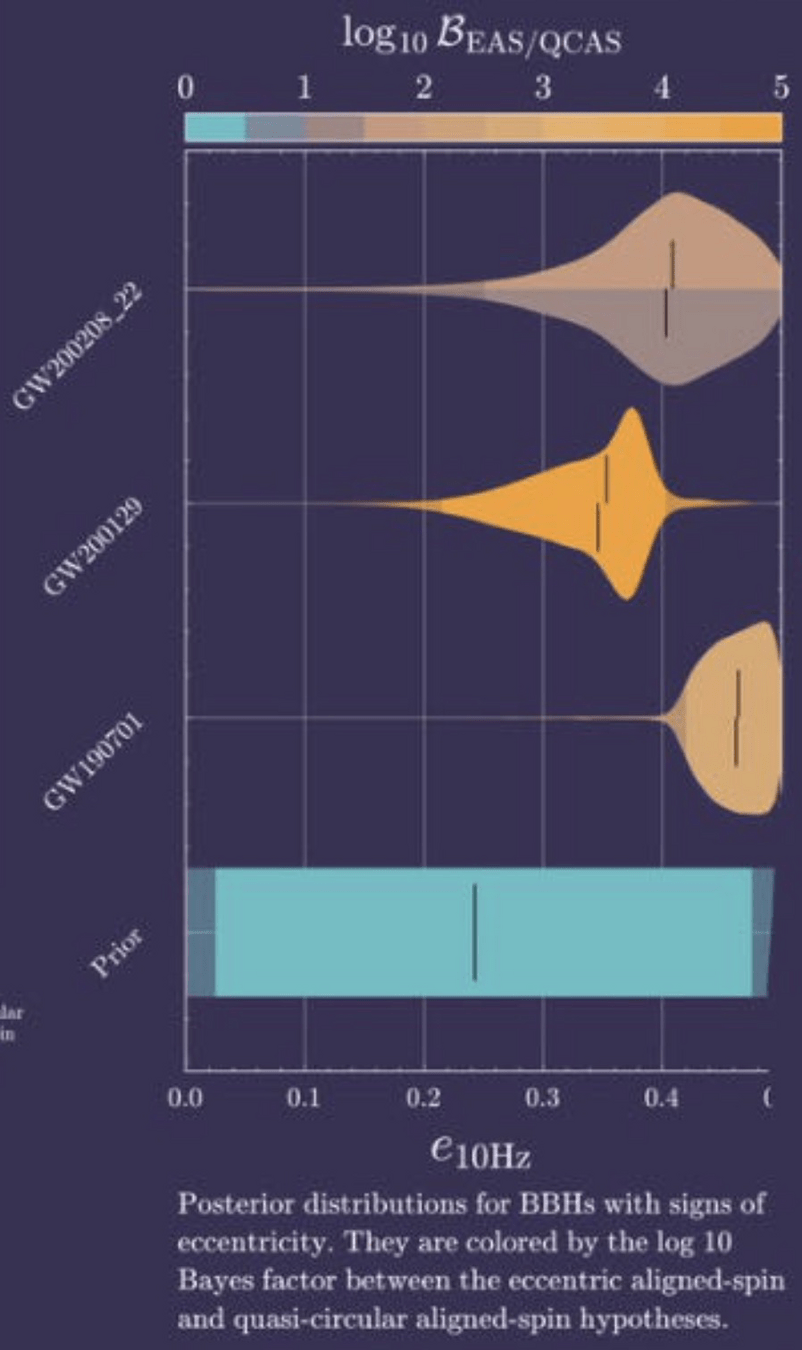
Recent AI Discoveries & Validation Hurdles:
Search
PE
Rate
Key Insight:
Interpretable Gravitational Wave Data Analysis with DL and LLMs
hewang@ucas.ac.cn
Recent AI Discoveries & Validation Hurdles:
Search
PE
Rate
Key Insight:
Credit: DCC-XXXXXXXX
Interpretable Gravitational Wave Data Analysis with DL and LLMs
hewang@ucas.ac.cn
GW
AI for GW
LLM for GW
hewang@ucas.ac.cn
Interpretable Gravitational Wave Data Analysis with DL and LLMs
hewang@ucas.ac.cn
Interpretable Gravitational Wave Data Analysis with DL and LLMs
hewang@ucas.ac.cn
Bayesian statistics
Data quality improvement
Credit: Marco Cavaglià
LIGO-Virgo data processing
GW searches
Astrophsical interpretation of GW sources
Interpretable Gravitational Wave Data Analysis with DL and LLMs
hewang@ucas.ac.cn
Nature Physics 18, 1 (2022) 112–17
PRL 127, 24 (2021) 241103.
PRL 130, 17 (2023) 171403.
HW, et al. Big Data Mining and Analytics 5, 1 (2021) 53–63.
Interpretable Gravitational Wave Data Analysis with DL and LLMs
hewang@ucas.ac.cn
Interpretable Gravitational Wave Data Analysis with DL and LLMs
hewang@ucas.ac.cn
Interpretable Gravitational Wave Data Analysis with DL and LLMs
hewang@ucas.ac.cn
Train
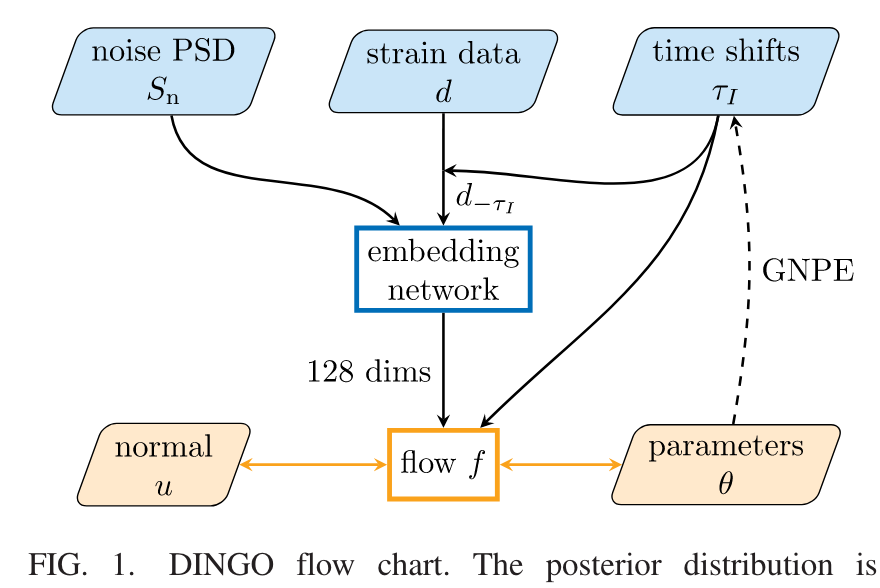
nflow
Interpretable Gravitational Wave Data Analysis with DL and LLMs
hewang@ucas.ac.cn
Train
nflow
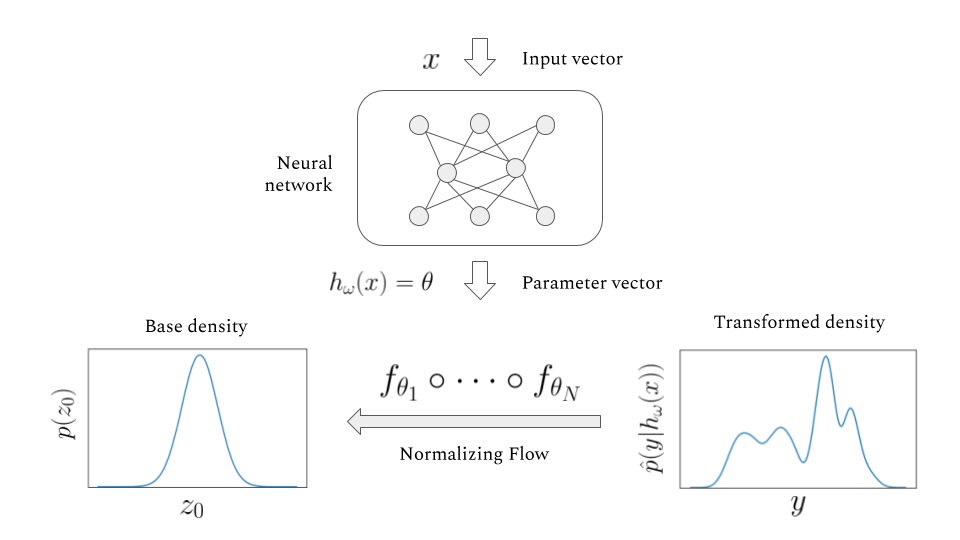
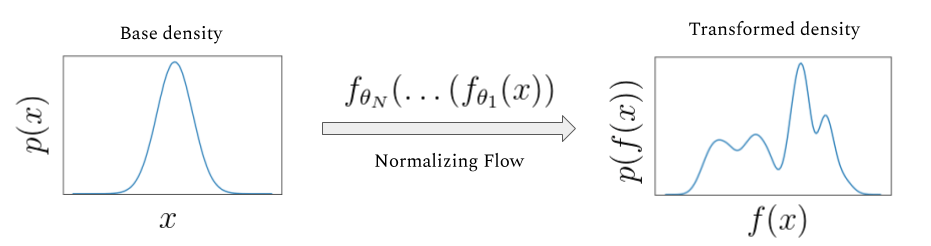
归一化流模型示意图
Test
nflow
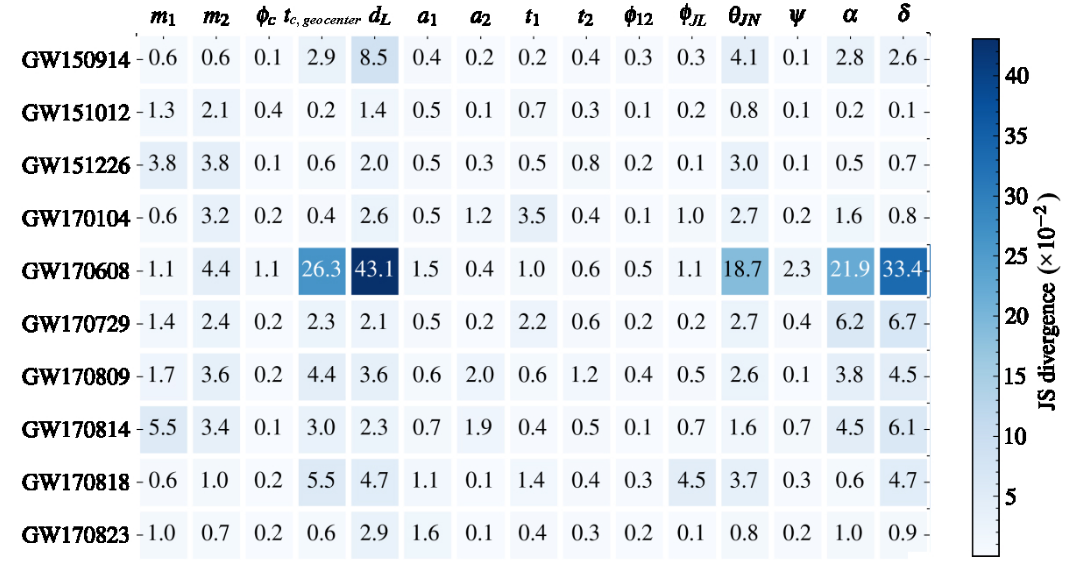
Parameter Estimation Challenges with AI Models:
arXiv:2404.14286
Phys. Rev. D 109, 123547 (2024)
Interpretable Gravitational Wave Data Analysis with DL and LLMs
hewang@ucas.ac.cn
PRD 108, 4 (2023): 044029.
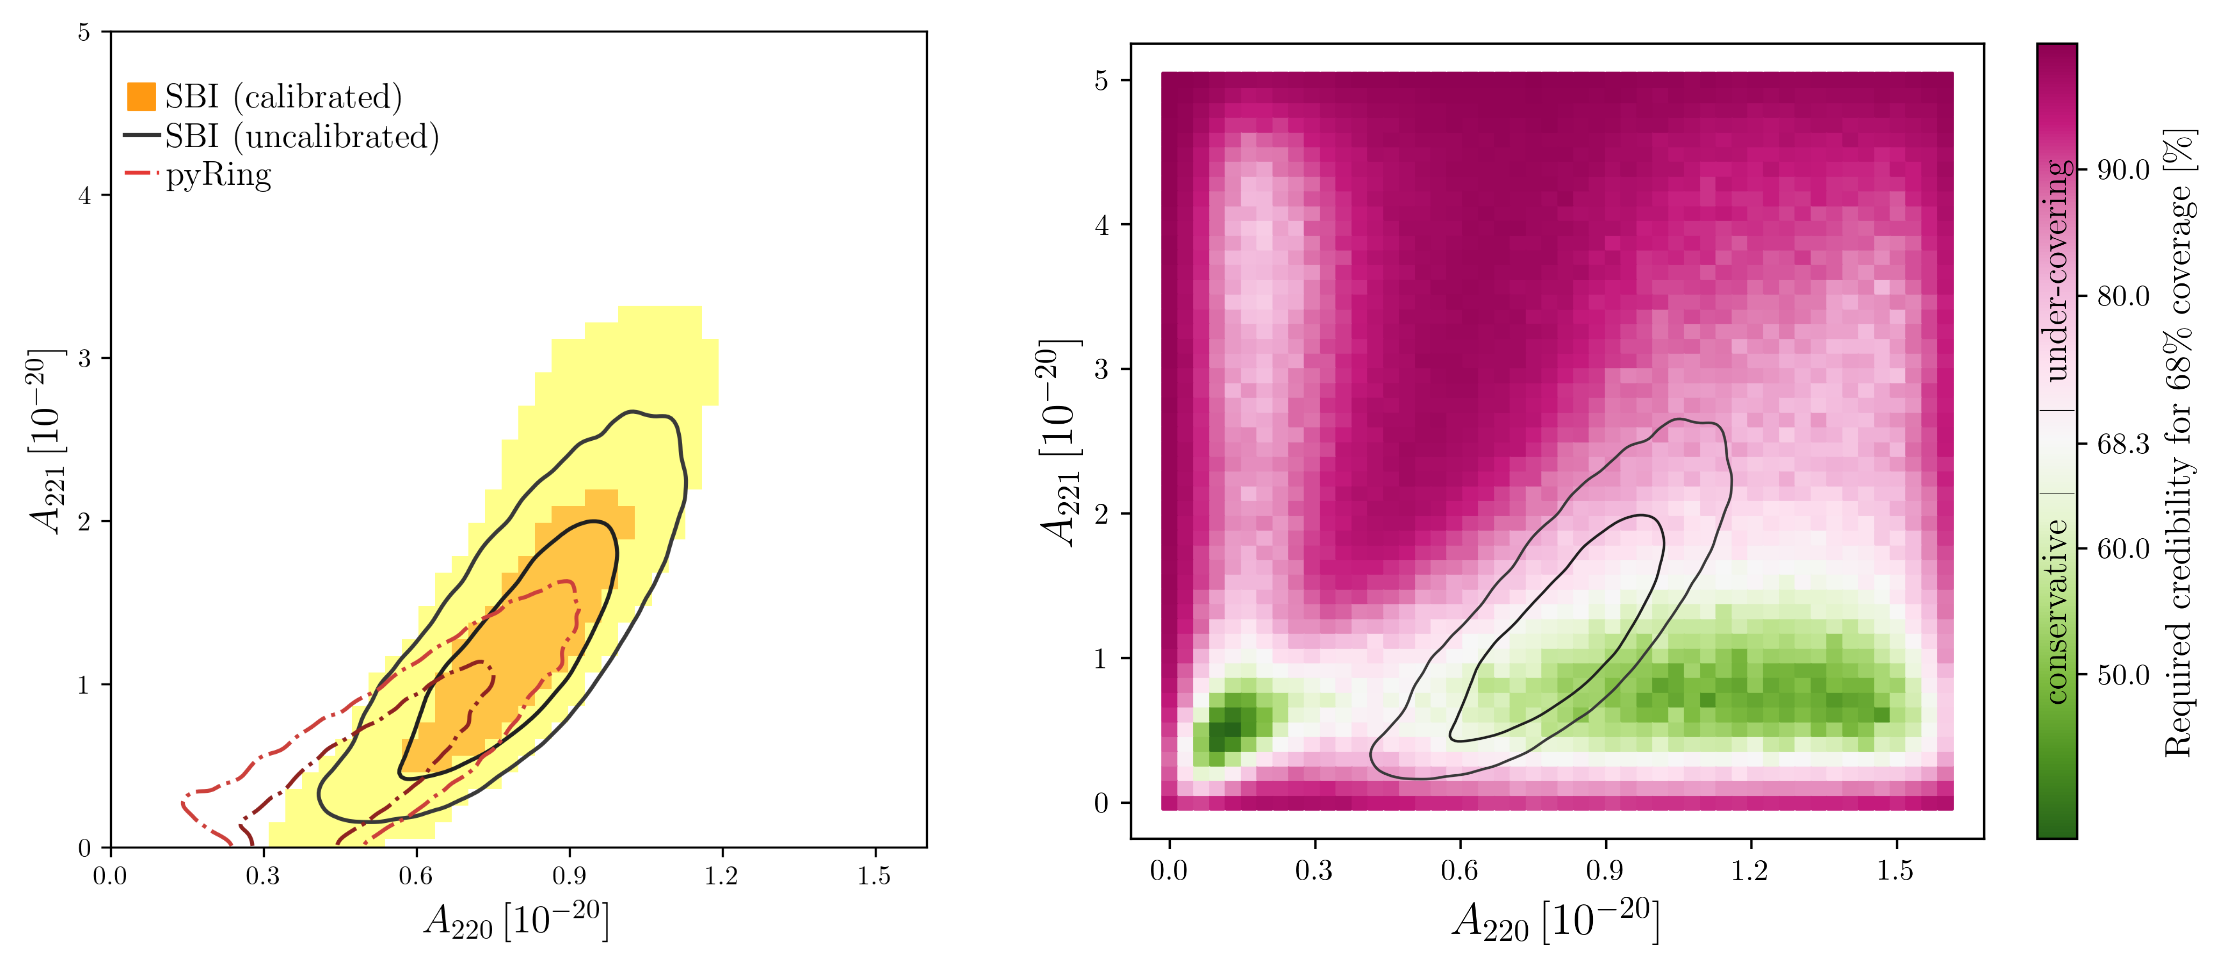
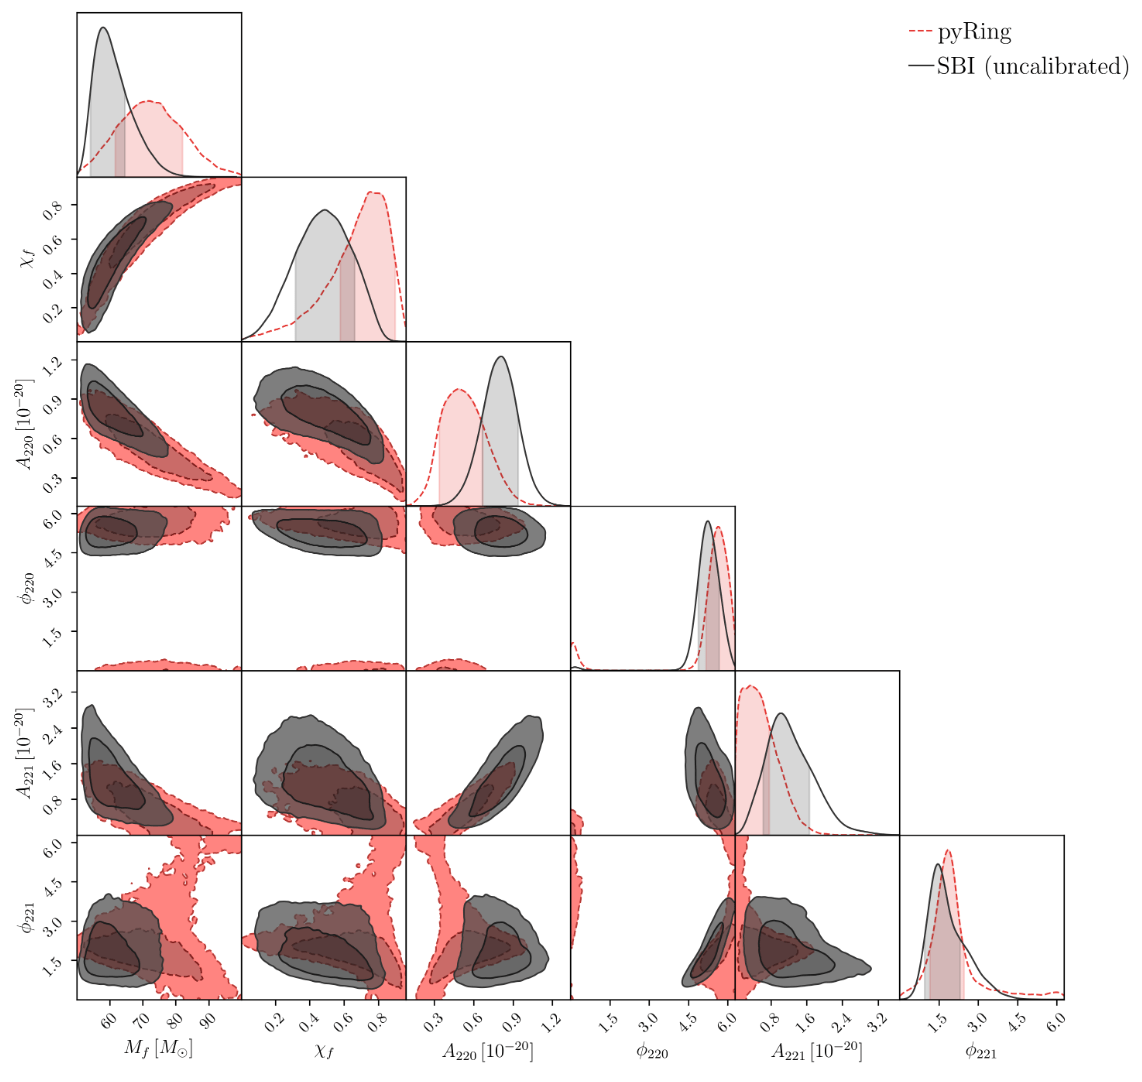
Neural Posterior Estimation with Guaranteed Exact Coverage: The Ringdown of GW150914
Appreciating the Ringdown Overtone Test of GW150914
Interpretable Gravitational Wave Data Analysis with DL and LLMs
hewang@ucas.ac.cn
PRD 108, 4 (2023): 044029.
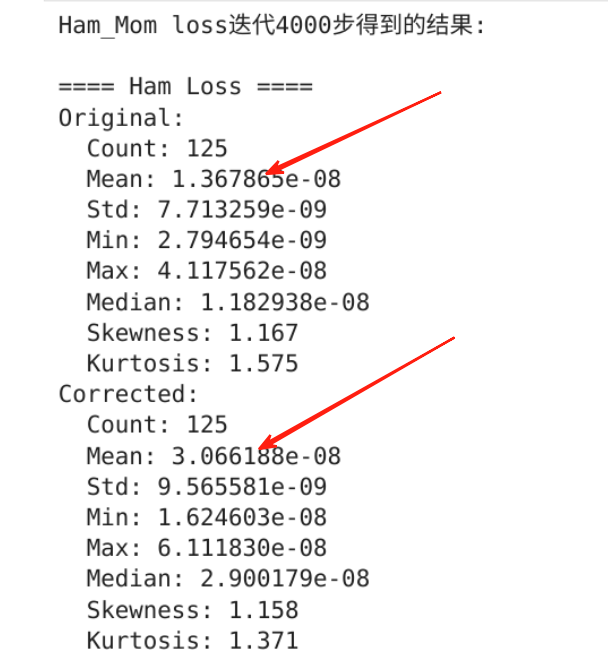
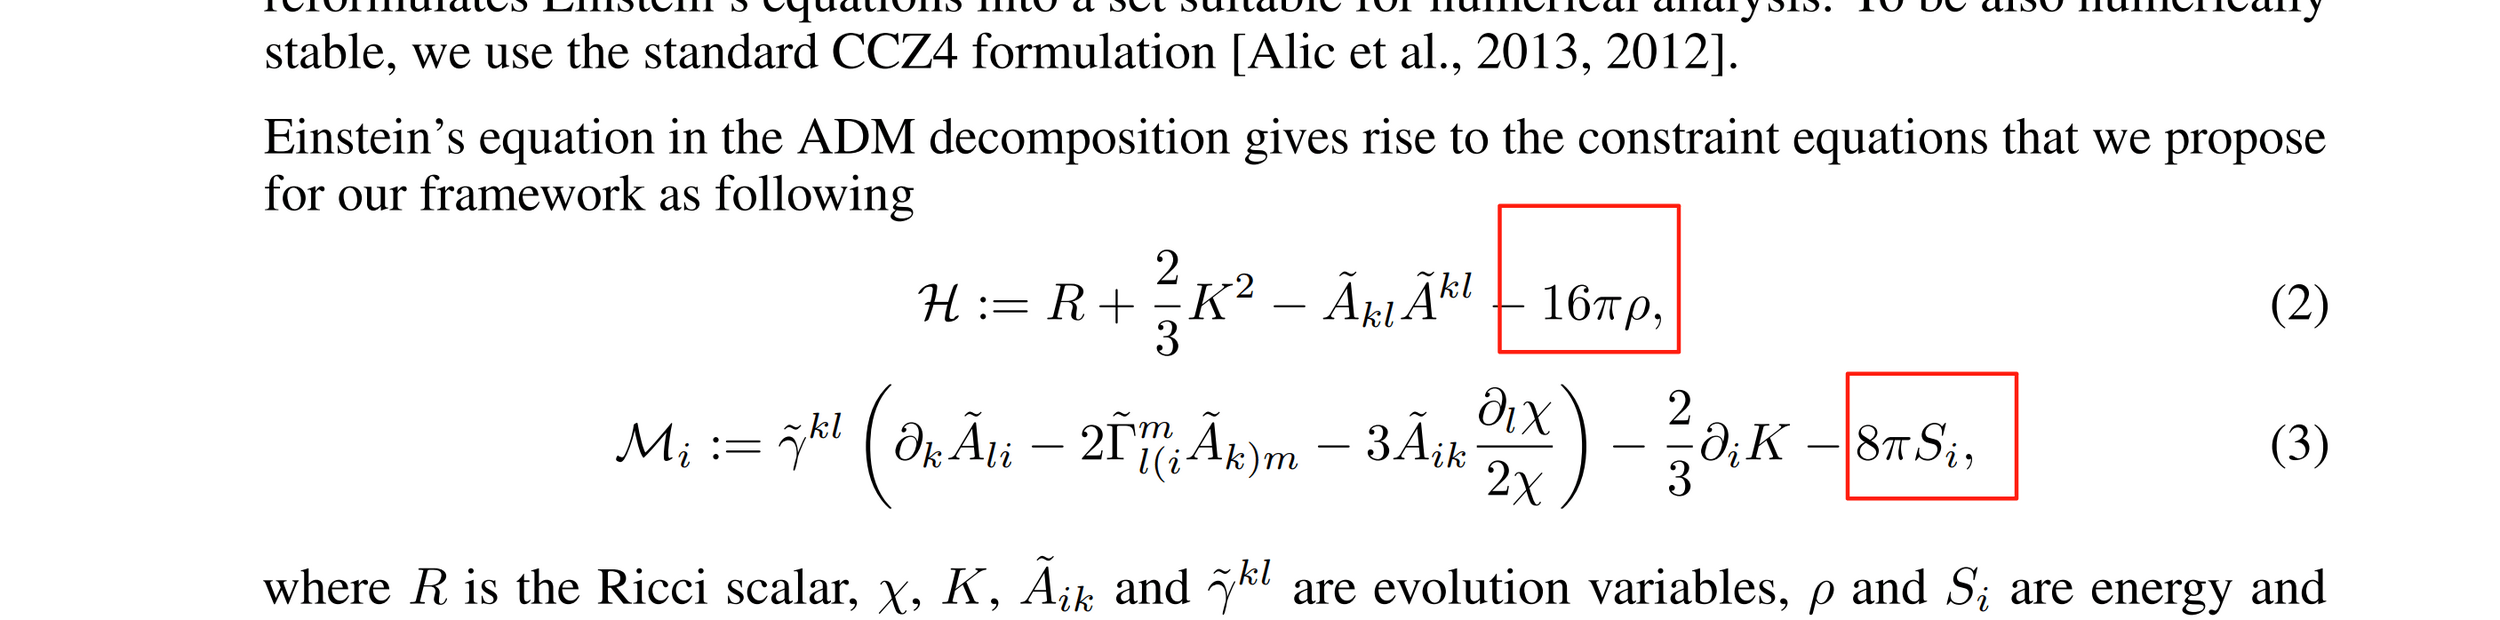
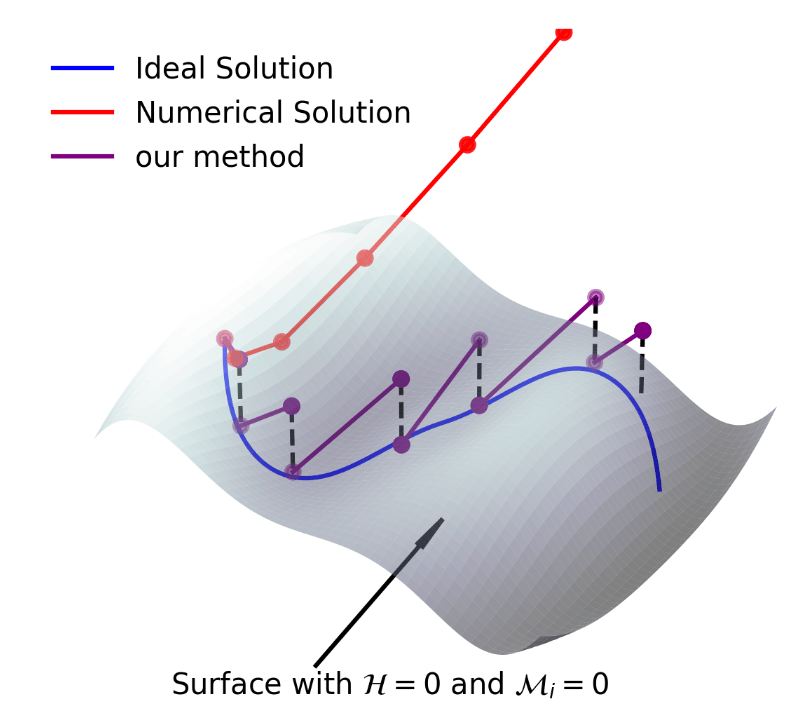
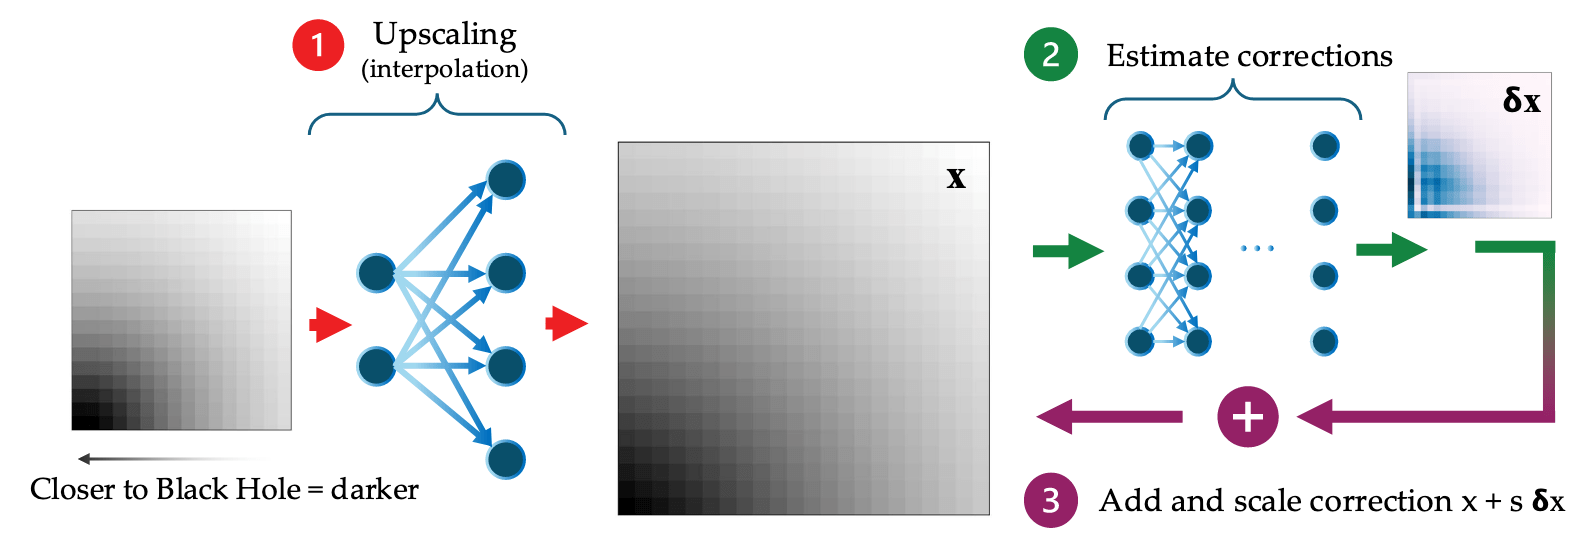
对超分辨率初值面的哈密顿约束和动量约束修正(系统误差)
Interpretable Gravitational Wave Data Analysis with DL and LLMs
hewang@ucas.ac.cn
evolve
Thomas Helfer, et al. Super-Resolution without High-Resolution Labels for Black Hole Simulations. arXiv:2411.02453
Key Trust Factors:
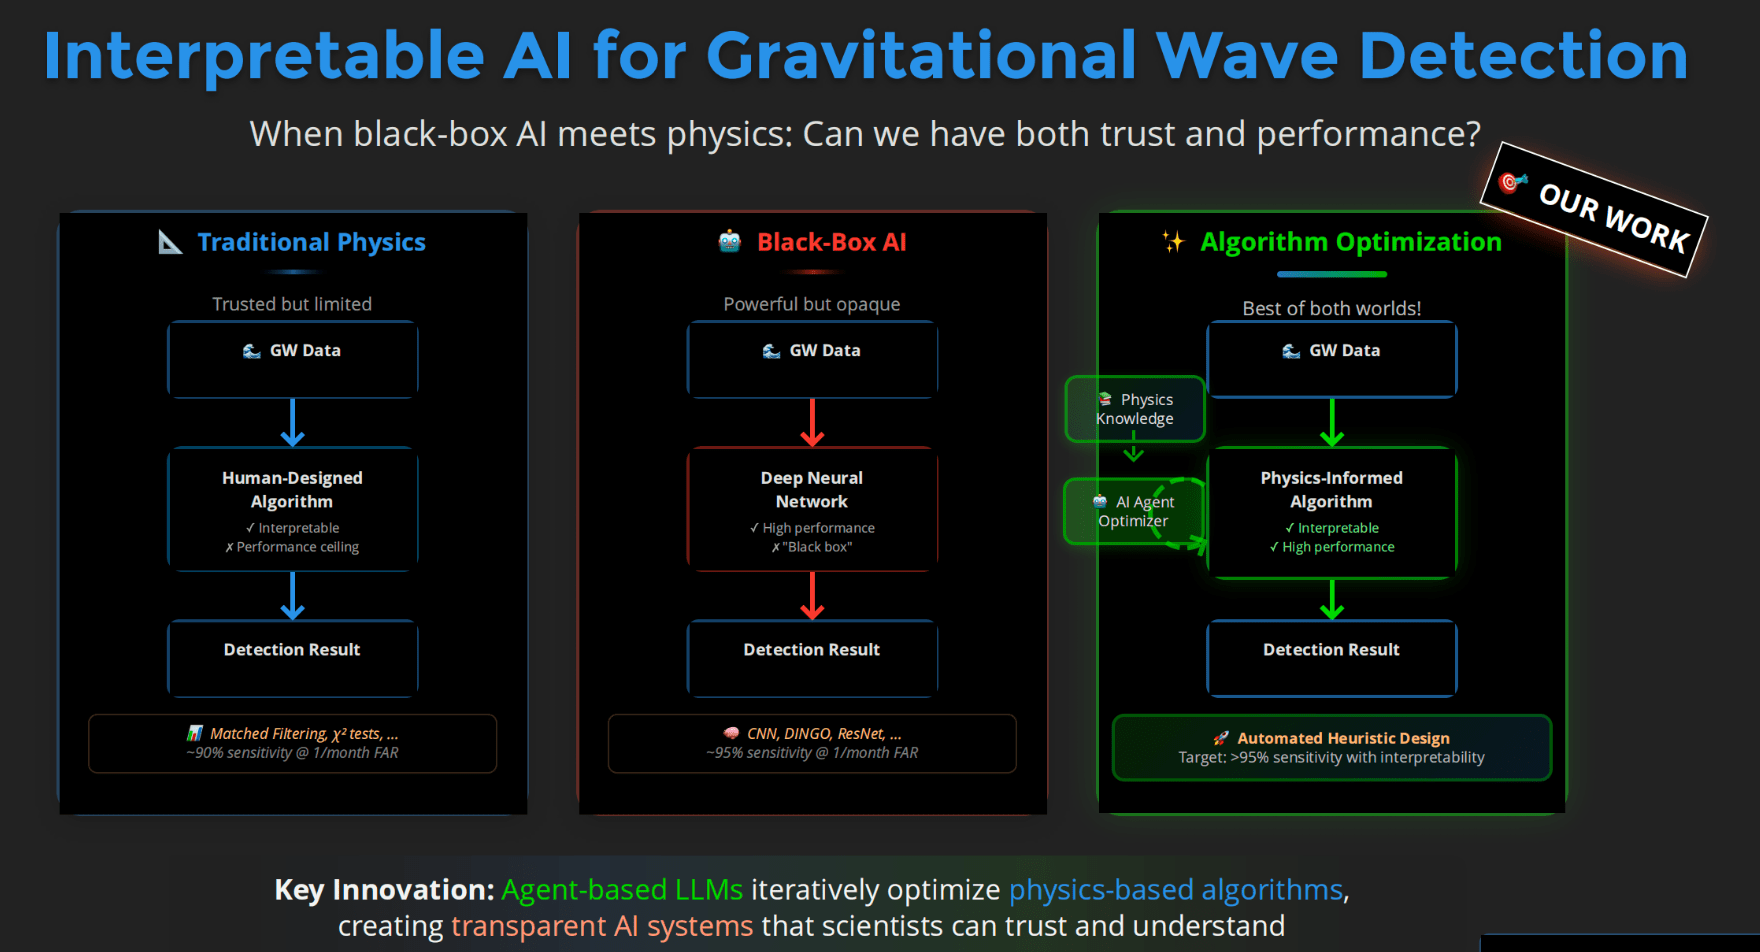
Traditional Physics Approach
Input
Human-Designed Algorithm
(Based on human insight)
Output
Example: Matched Filtering,
Linear Regression
Black-Box AI Approach
Input
AI Model
(Low interpretability)
Output
Examples: CNN, AlphaGo, DINGO
Key Challenge: How can we maintain the interpretability advantages of traditional models while leveraging the power of AI approaches?
Data/
Experience
Data/
Experience
Interpretable Gravitational Wave Data Analysis with DL and LLMs
hewang@ucas.ac.cn
Combining the interpretability of physics with the power of AI
Our Mission: To create transparent AI systems that combine physics-based interpretability with deep learning capabilities
Interpretable AI Approach
The best of both worlds
Input
Physics-Informed
Algorithm
(High interpretability)
Output
Example: Our Approach
(In Preparation)
AI Model
Physics
Knowledge
Traditional Physics Approach
Input
Human-Designed Algorithm
(Based on human insight)
Output
Example: Matched Filtering, linear regression
Black-Box AI Approach
Input
AI Model
(Low interpretability)
Output
Examples: CNN, AlphaGo, DINGO
Data/
Experience
Data/
Experience
Interpretable Gravitational Wave Data Analysis with DL and LLMs
🎯 OUR WORK
hewang@ucas.ac.cn
GW
AI for GW
LLM for GW
hewang@ucas.ac.cn
hewang@ucas.ac.cn
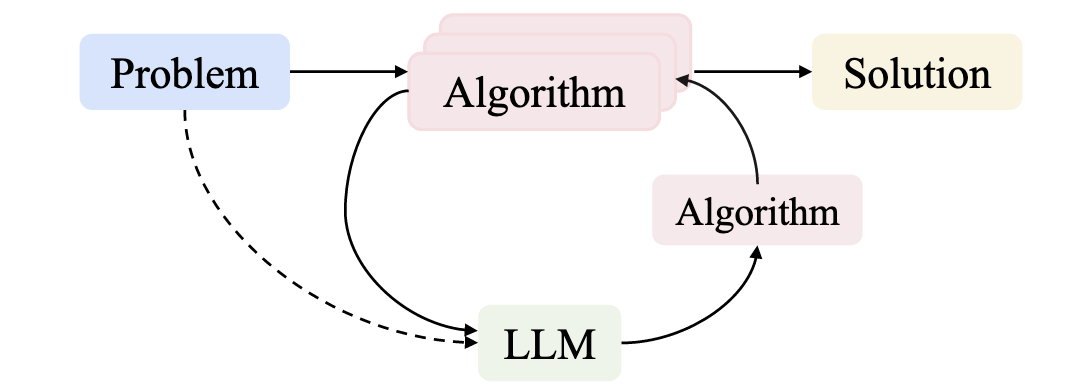
For any complex task \(P\) (especially NP-hard problems), Automated Heuristic Design (AHD) searches for the optimal heuristic \(h^*\) within a heuristic space \(H\):
\(h^*=\underset{h \in H}{\arg \max } g(h) \)
The heuristic space \(H\) contains all feasible algorithmic solutions for task \(P\). Each heuristic \(h \in H\) maps from the set of task inputs \(I_P\) to corresponding solutions \(S_P\):
\(h: I_P \rightarrow S_P\)
Performance measure \(g(\cdot)\) evaluates each heuristic's effectiveness, \(g: H \rightarrow \mathbb{R}\). For minimization problems with objective function \(f: S_P \rightarrow \mathbb{R}\), we estimate performance by evaluating the heuristic instances \({ins}\in D \subseteq I_P\) on dataset \(D\) as follows:
\(g(h)=\mathbb{E}_{\boldsymbol{ins} \in D}[-f(h(\boldsymbol{ins}))]\)
arXiv.2410.14716
external_knowledge
(constraint)
Interpretable Gravitational Wave Data Analysis with DL and LLMs
HW et al., In preparation
hewang@ucas.ac.cn
import numpy as np
import scipy.signal as signal
def pipeline_v1(strain_h1: np.ndarray, strain_l1: np.ndarray, times: np.ndarray) -> tuple[np.ndarray, np.ndarray, np.ndarray]:
    def data_conditioning(strain_h1: np.ndarray, strain_l1: np.ndarray, times: np.ndarray) -> tuple[np.ndarray, np.ndarray, np.ndarray]:
        window_length = 4096
        dt = times[1] - times[0]
        fs = 1.0 / dt

        def whiten_strain(strain):
            strain_zeromean = strain - np.mean(strain)
            freqs, psd = signal.welch(strain_zeromean, fs=fs, nperseg=window_length,
                                       window='hann', noverlap=window_length//2)
            smoothed_psd = np.convolve(psd, np.ones(32) / 32, mode='same')
            smoothed_psd = np.maximum(smoothed_psd, np.finfo(float).tiny)
            white_fft = np.fft.rfft(strain_zeromean) / np.sqrt(np.interp(np.fft.rfftfreq(len(strain_zeromean), d=dt), freqs, smoothed_psd))
            return np.fft.irfft(white_fft)

        whitened_h1 = whiten_strain(strain_h1)
        whitened_l1 = whiten_strain(strain_l1)

        return whitened_h1, whitened_l1, times

    def compute_metric_series(h1_data: np.ndarray, l1_data: np.ndarray, time_series: np.ndarray) -> tuple[np.ndarray, np.ndarray]:
        fs = 1 / (time_series[1] - time_series[0])
        f_h1, t_h1, Sxx_h1 = signal.spectrogram(h1_data, fs=fs, nperseg=256, noverlap=128, mode='magnitude', detrend=False)
        f_l1, t_l1, Sxx_l1 = signal.spectrogram(l1_data, fs=fs, nperseg=256, noverlap=128, mode='magnitude', detrend=False)
        tf_metric = np.mean((Sxx_h1**2 + Sxx_l1**2) / 2, axis=0)
        gps_mid_time = time_series[0] + (time_series[-1] - time_series[0]) / 2
        metric_times = gps_mid_time + (t_h1 - t_h1[-1] / 2)

        return tf_metric, metric_times

    def calculate_statistics(tf_metric, t_h1):
        background_level = np.median(tf_metric)
        peaks, _ = signal.find_peaks(tf_metric, height=background_level * 1.0, distance=2, prominence=background_level * 0.3)
        peak_times = t_h1[peaks]
        peak_heights = tf_metric[peaks]
        peak_deltat = np.full(len(peak_times), 10.0)  # Fixed uncertainty value
        return peak_times, peak_heights, peak_deltat

    whitened_h1, whitened_l1, data_times = data_conditioning(strain_h1, strain_l1, times)
    tf_metric, metric_times = compute_metric_series(whitened_h1, whitened_l1, data_times)
    peak_times, peak_heights, peak_deltat = calculate_statistics(tf_metric, metric_times)

    return peak_times, peak_heights, peak_deltat
Input: H1 and L1 detector strains, time array | Output: Event times, significance values, and time uncertainties
external_knowledge
(constraint)
Problem: Pipeline Workflow
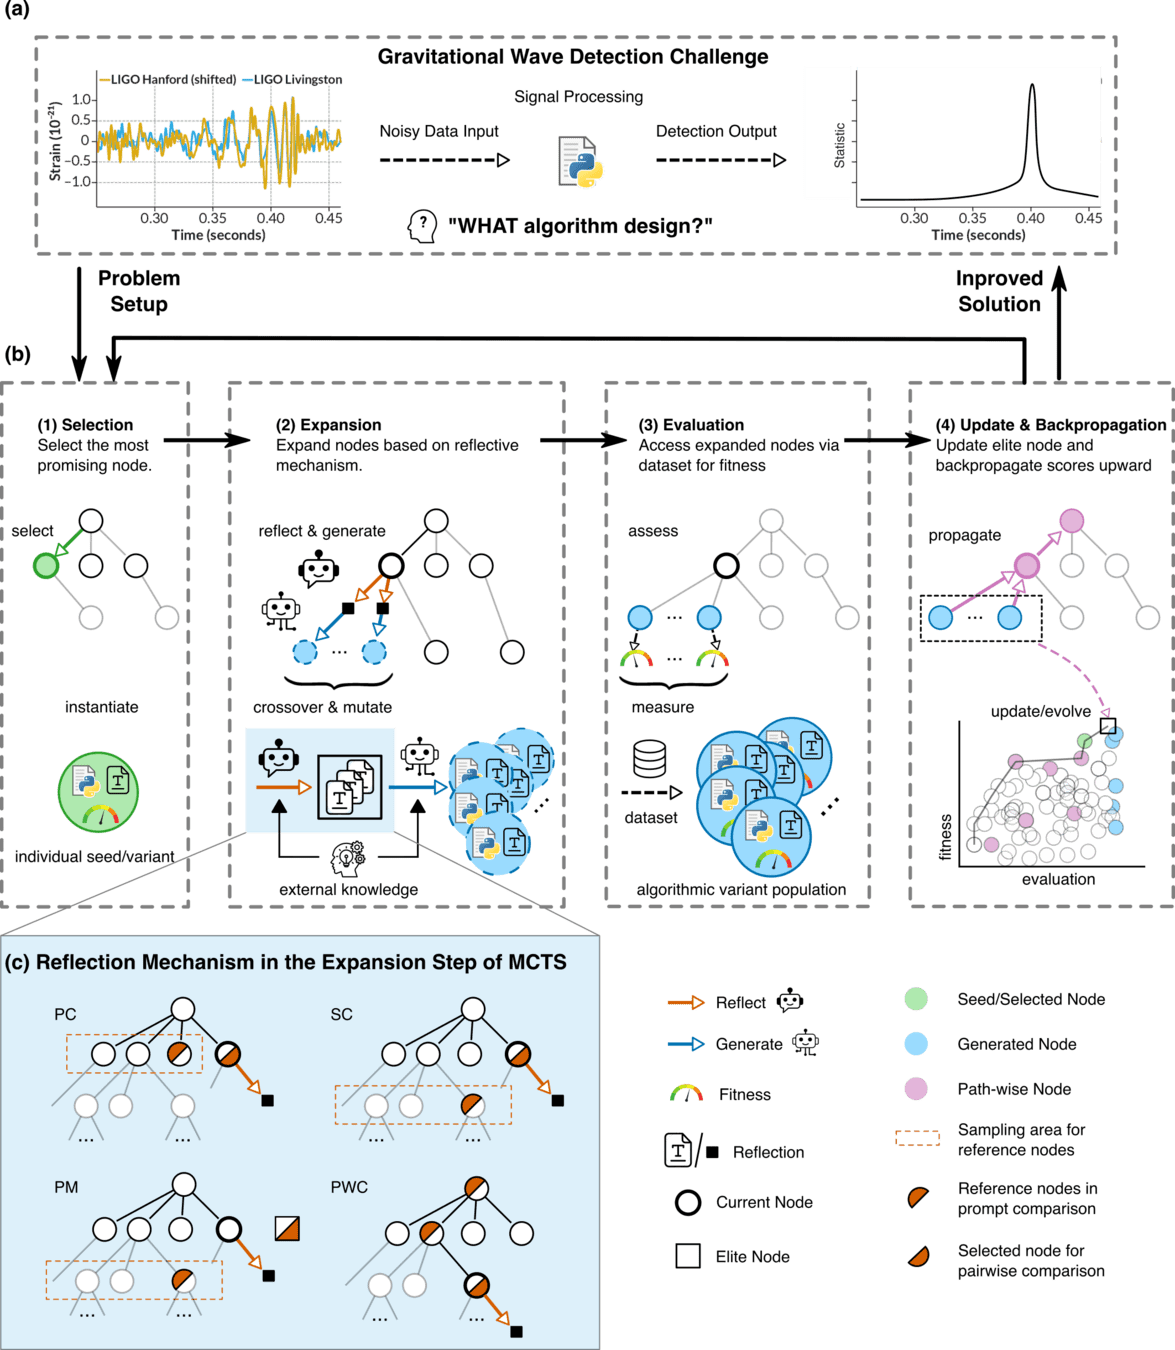
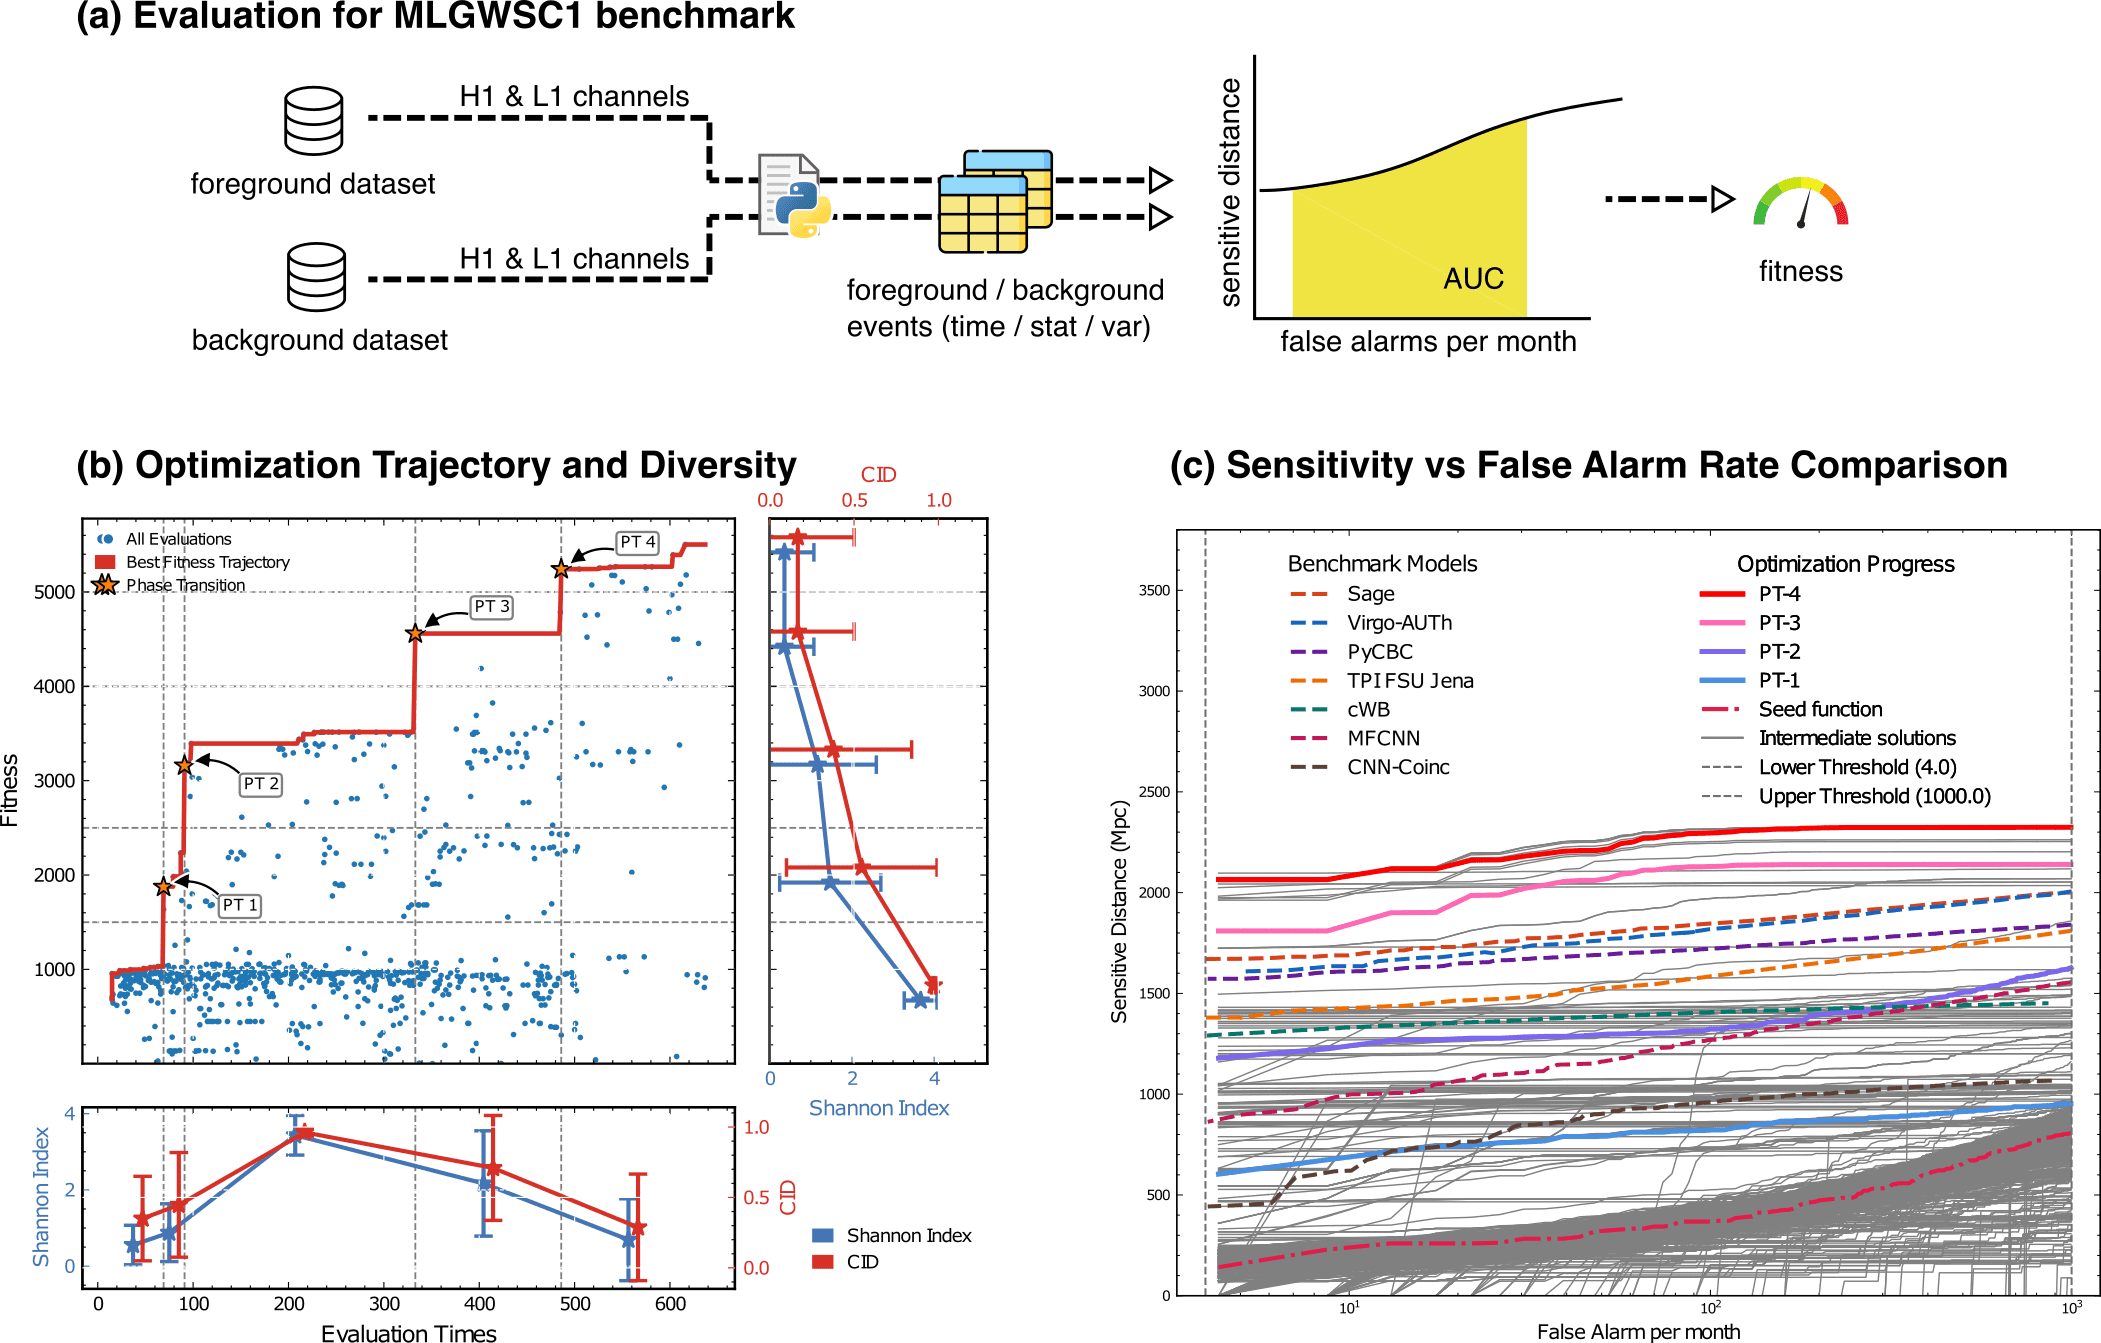
Optimization Target: Maximizing Area Under Curve (AUC) in the 1-1000Hz false alarms per-year range, balancing detection sensitivity and false alarm rates across algorithm generations
Interpretable Gravitational Wave Data Analysis with DL and LLMs
HW et al., In preparation
external_knowledge
(constraint)
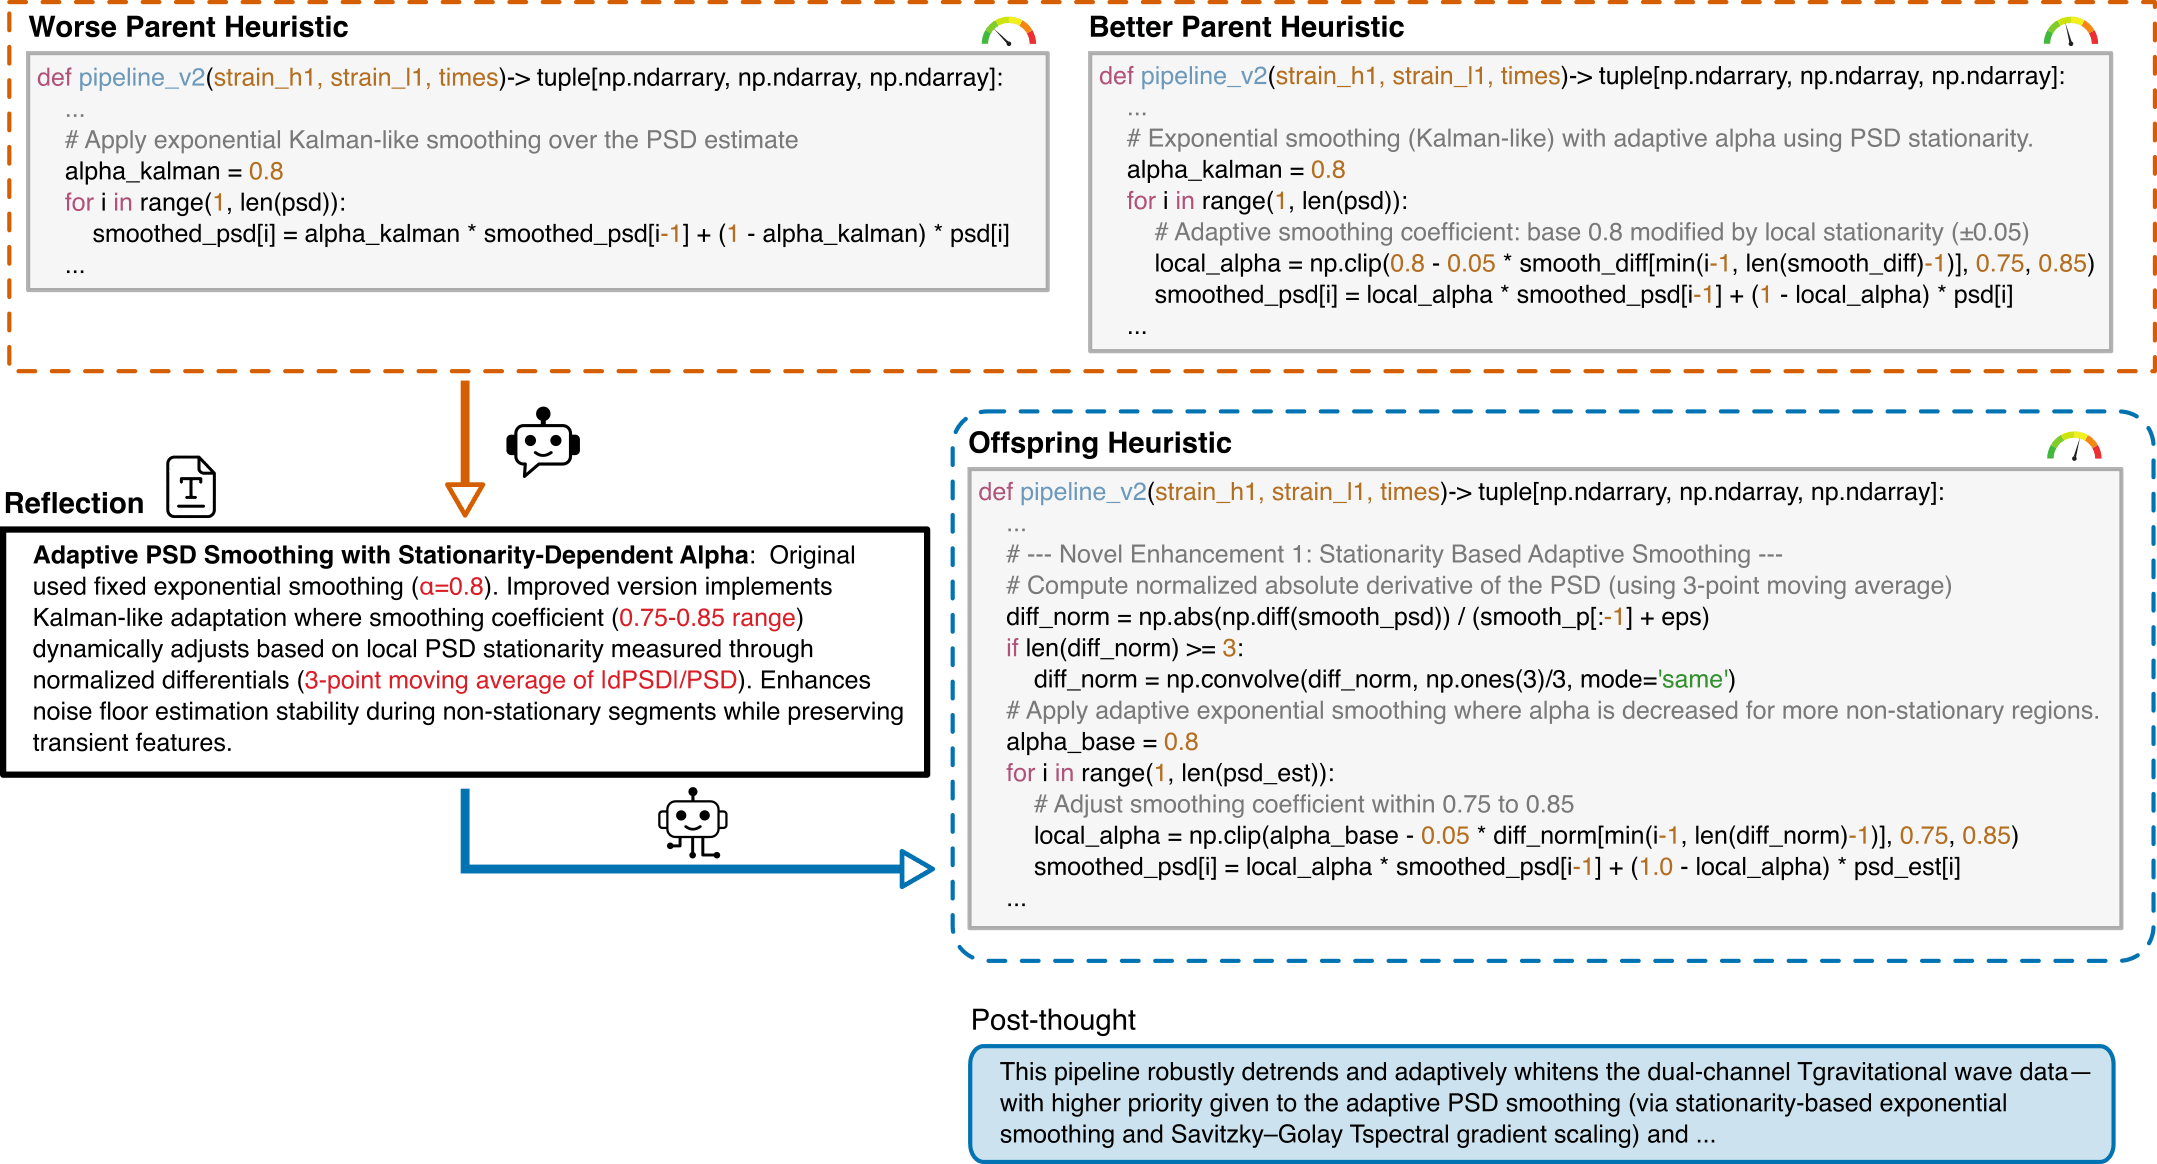
Prompt Structure for Algorithm Evolution
This template guides the LLM to generate optimized gravitational wave detection algorithms by learning from comparative examples.
Key Components:
You are an expert in gravitational wave signal detection algorithms. Your task is to design heuristics that can effectively solve optimization problems.

{prompt_task}

I have analyzed two algorithms and provided a reflection on their differences.

[Worse code]
{worse_code}

[Better code]
{better_code}

[Reflection]
{reflection}

Based on this reflection, please write an improved algorithm according to the reflection.
First, describe the design idea and main steps of your algorithm in one sentence. The description must be inside a brace outside the code implementation. Next, implement it in Python as a function named '{func_name}'.
This function should accept {input_count} input(s): {joined_inputs}. The function should return {output_count} output(s): {joined_outputs}.
{inout_inf} {other_inf}

Do not give additional explanations.
One Prompt Template for MLGWSC1 Algorithm Synthesis
Interpretable Gravitational Wave Data Analysis with DL and LLMs
HW et al., In preparation
hewang@ucas.ac.cn
Interpretable Gravitational Wave Data Analysis with DL and LLMs
hewang@ucas.ac.cn
Interpretable Gravitational Wave Data Analysis with DL and LLMs
hewang@ucas.ac.cn
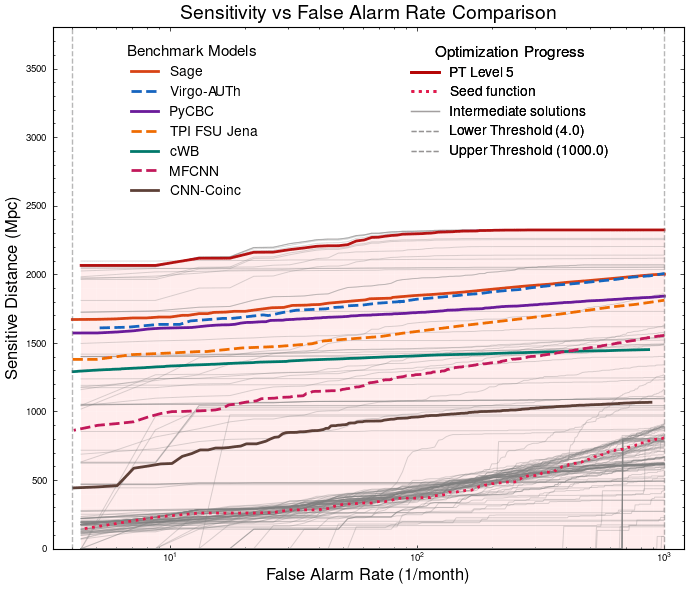
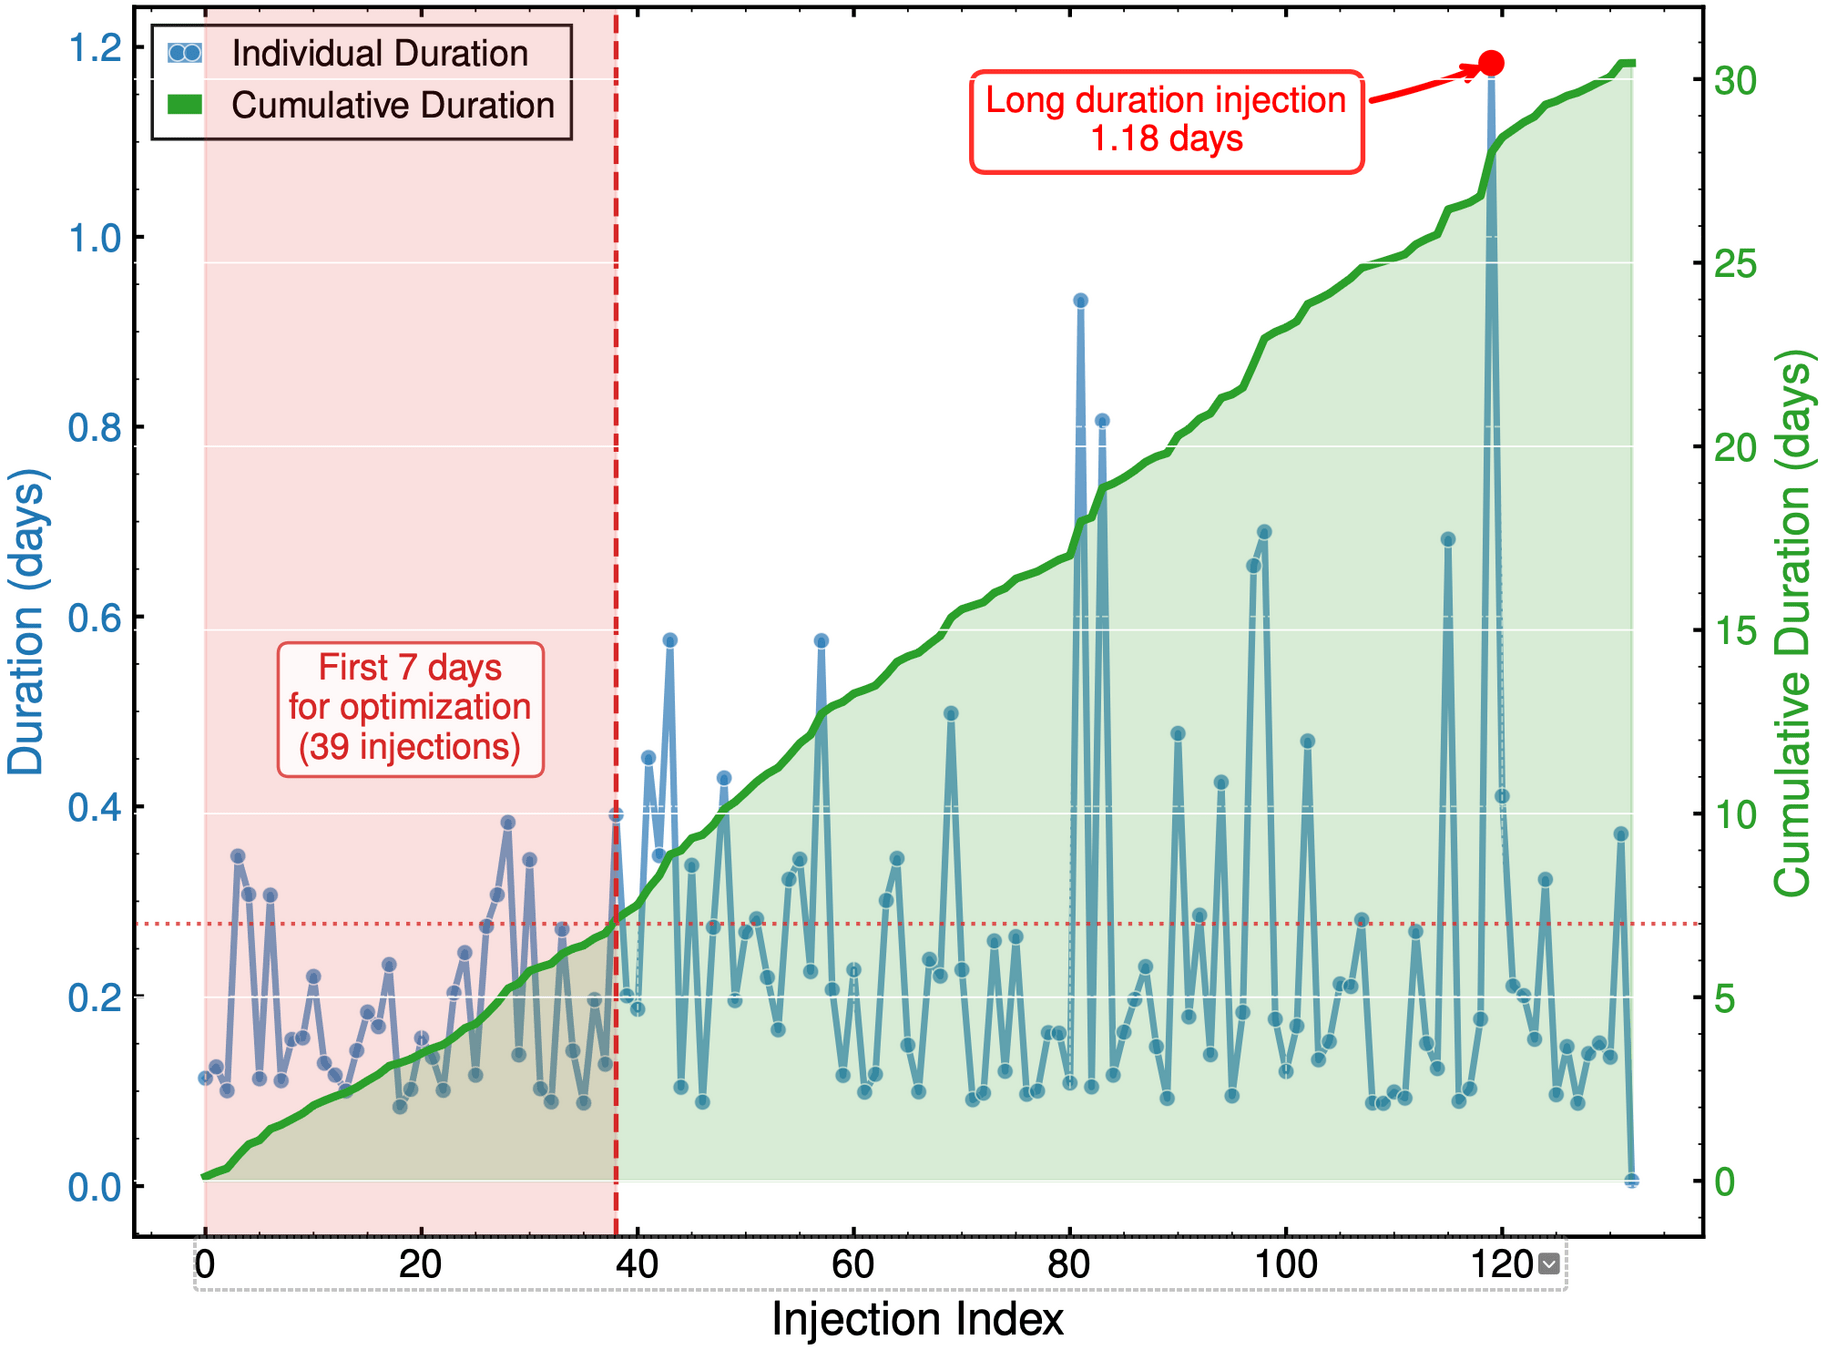
Optimization Progress & Algorithm Diversity
Interpretable Gravitational Wave Data Analysis with DL and LLMs
HW et al., In preparation
Pipeline Workflow
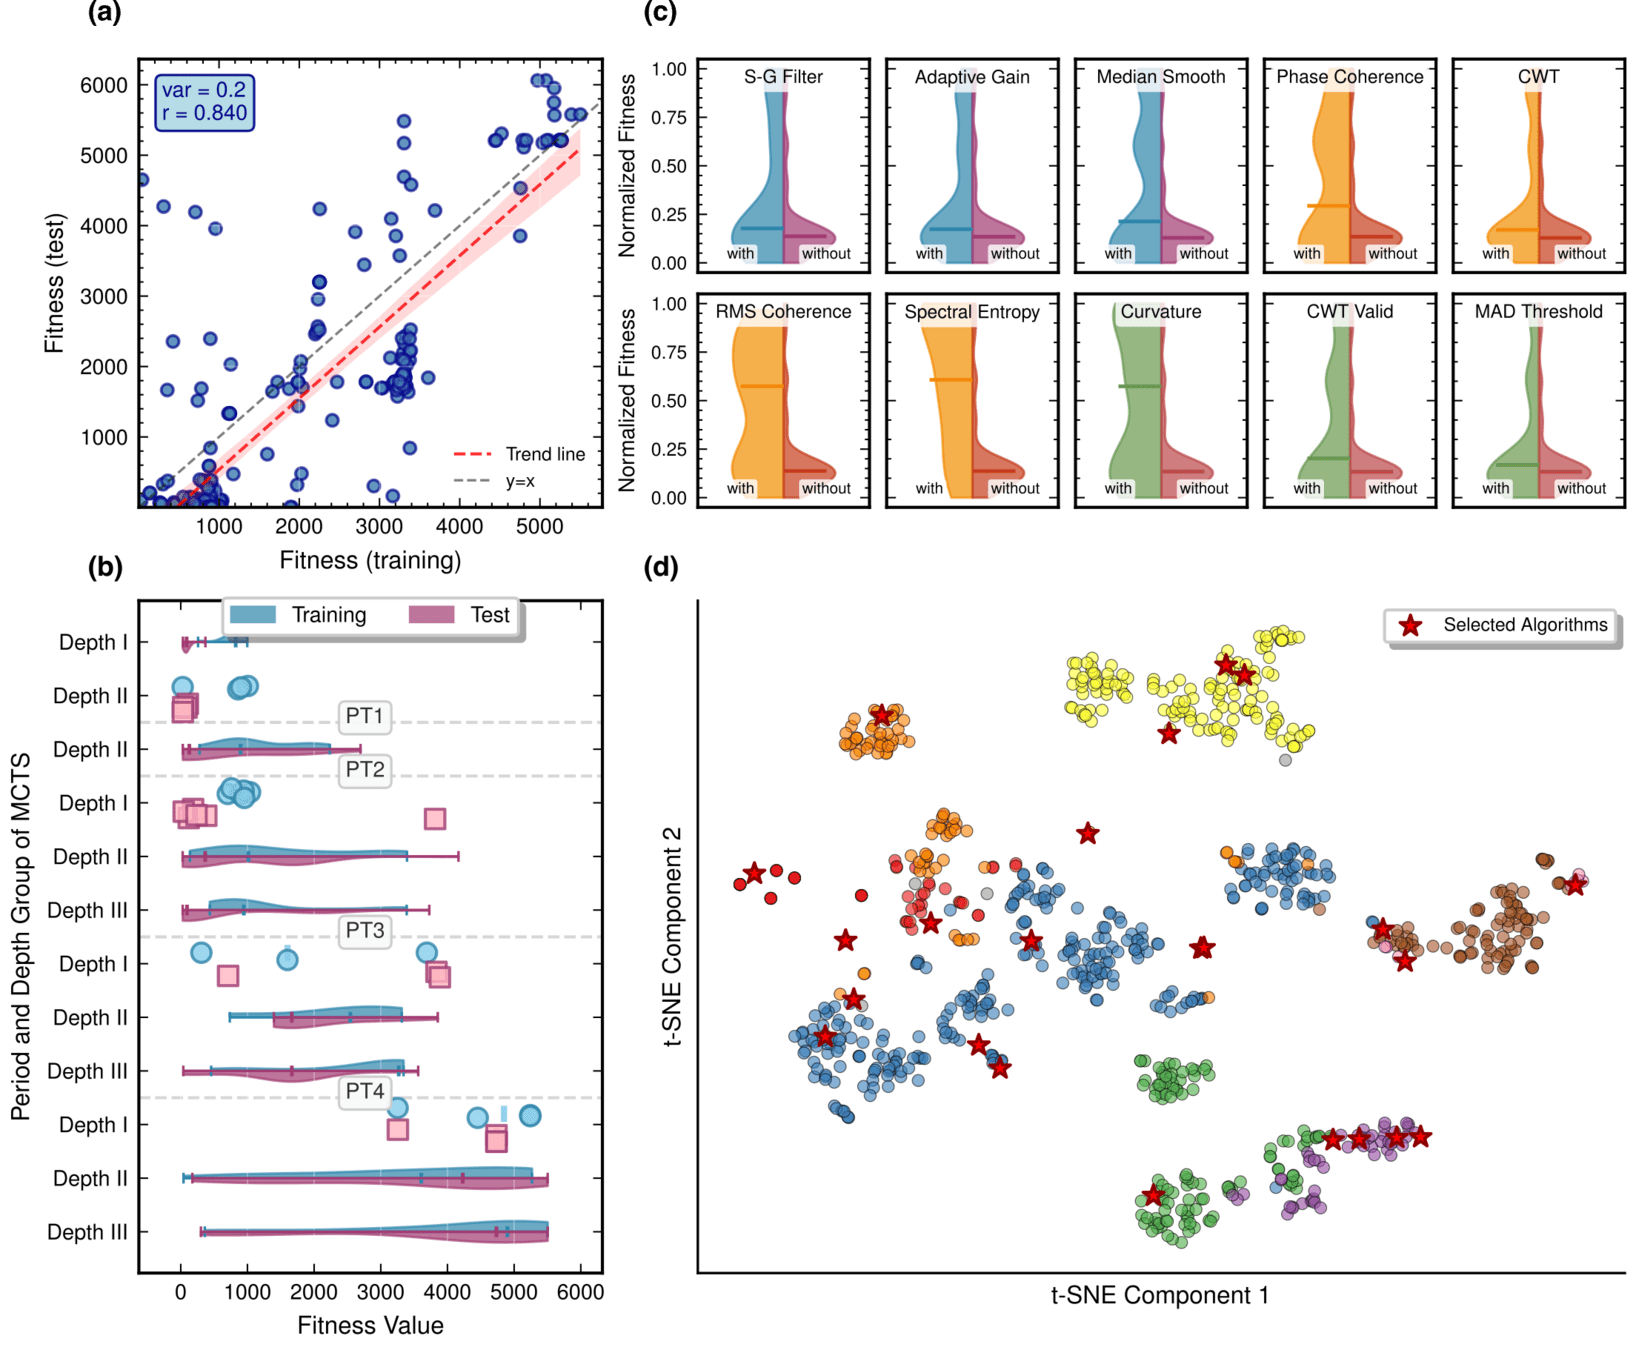
Diversity in Evolutionary Computation
Population encoding:
Pipeline Workflow
hewang@ucas.ac.cn
Interpretable Gravitational Wave Data Analysis with DL and LLMs
HW et al., In preparation
Refs of Benchmark Models
hewang@ucas.ac.cn
Interpretable Gravitational Wave Data Analysis with DL and LLMs
HW et al., In preparation
import numpy as np
import scipy.signal as signal
from scipy.signal.windows import tukey
from scipy.signal import savgol_filter

def pipeline_v2(strain_h1: np.ndarray, strain_l1: np.ndarray, times: np.ndarray) -> tuple[np.ndarray, np.ndarray, np.ndarray]:
    """
    The pipeline function processes gravitational wave data from the H1 and L1 detectors to identify potential gravitational wave signals.
    It takes strain_h1 and strain_l1 numpy arrays containing detector data, and times array with corresponding time points.
    The function returns a tuple of three numpy arrays: peak_times containing GPS times of identified events,
    peak_heights with significance values of each peak, and peak_deltat showing time window uncertainty for each peak.
    """
    eps = np.finfo(float).tiny
    dt = times[1] - times[0]
    fs = 1.0 / dt
    # Base spectrogram parameters
    base_nperseg = 256
    base_noverlap = base_nperseg // 2
    medfilt_kernel = 101       # odd kernel size for robust detrending
    uncertainty_window = 5     # half-window for local timing uncertainty

    # -------------------- Stage 1: Robust Baseline Detrending --------------------
    # Remove long-term trends using a median filter for each channel.
    detrended_h1 = strain_h1 - signal.medfilt(strain_h1, kernel_size=medfilt_kernel)
    detrended_l1 = strain_l1 - signal.medfilt(strain_l1, kernel_size=medfilt_kernel)

    # -------------------- Stage 2: Adaptive Whitening with Enhanced PSD Smoothing --------------------
    def adaptive_whitening(strain: np.ndarray) -> np.ndarray:
        # Center the signal.
        centered = strain - np.mean(strain)
        n_samples = len(centered)
        # Adaptive window length: between 5 and 30 seconds
        win_length_sec = np.clip(n_samples / fs / 20, 5, 30)
        nperseg_adapt = int(win_length_sec * fs)
        nperseg_adapt = max(10, min(nperseg_adapt, n_samples))

        # Create a Tukey window with 75% overlap.
        tukey_alpha = 0.25
        win = tukey(nperseg_adapt, alpha=tukey_alpha)
        noverlap_adapt = int(nperseg_adapt * 0.75)
        if noverlap_adapt >= nperseg_adapt:
            noverlap_adapt = nperseg_adapt - 1

        # Estimate the power spectral density (PSD) using Welch's method.
        freqs, psd = signal.welch(centered, fs=fs, nperseg=nperseg_adapt,
                                  noverlap=noverlap_adapt, window=win, detrend='constant')
        psd = np.maximum(psd, eps)

        # Compute relative differences for PSD stationarity measure.
        diff_arr = np.abs(np.diff(psd)) / (psd[:-1] + eps)
        # Smooth the derivative with a moving average.
        if len(diff_arr) >= 3:
            smooth_diff = np.convolve(diff_arr, np.ones(3)/3, mode='same')
        else:
            smooth_diff = diff_arr

        # Exponential smoothing (Kalman-like) with adaptive alpha using PSD stationarity.
        smoothed_psd = np.copy(psd)
        for i in range(1, len(psd)):
            # Adaptive smoothing coefficient: base 0.8 modified by local stationarity (±0.05)
            local_alpha = np.clip(0.8 - 0.05 * smooth_diff[min(i-1, len(smooth_diff)-1)], 0.75, 0.85)
            smoothed_psd[i] = local_alpha * smoothed_psd[i-1] + (1 - local_alpha) * psd[i]

        # Compute Tikhonov regularization gain based on deviation from median PSD.
        noise_baseline = np.median(smoothed_psd)
        raw_gain = (smoothed_psd / (noise_baseline + eps)) - 1.0

        # Compute a causal-like gradient using the Savitzky-Golay filter.
        win_len = 11 if len(smoothed_psd) >= 11 else ((len(smoothed_psd)//2)*2+1)
        polyorder = 2 if win_len > 2 else 1
        delta_freq = np.mean(np.diff(freqs))
        grad_psd = savgol_filter(smoothed_psd, win_len, polyorder, deriv=1, delta=delta_freq, mode='interp')

        # Nonlinear scaling via sigmoid to enhance gradient differences.
        sigmoid = lambda x: 1.0 / (1.0 + np.exp(-x))
        scaling_factor = 1.0 + 2.0 * sigmoid(np.abs(grad_psd) / (np.median(smoothed_psd) + eps))

        # Compute adaptive gain factors with nonlinear scaling.
        gain = 1.0 - np.exp(-0.5 * scaling_factor * raw_gain)
        gain = np.clip(gain, -8.0, 8.0)

        # FFT-based whitening: interpolate gain and PSD onto FFT frequency bins.
        signal_fft = np.fft.rfft(centered)
        freq_bins = np.fft.rfftfreq(n_samples, d=dt)
        interp_gain = np.interp(freq_bins, freqs, gain, left=gain[0], right=gain[-1])
        interp_psd = np.interp(freq_bins, freqs, smoothed_psd, left=smoothed_psd[0], right=smoothed_psd[-1])
        denom = np.sqrt(interp_psd) * (np.abs(interp_gain) + eps)
        denom = np.maximum(denom, eps)
        white_fft = signal_fft / denom
        whitened = np.fft.irfft(white_fft, n=n_samples)
        return whitened

    # Whiten H1 and L1 channels using the adapted method.
    white_h1 = adaptive_whitening(detrended_h1)
    white_l1 = adaptive_whitening(detrended_l1)

    # -------------------- Stage 3: Coherent Time-Frequency Metric with Frequency-Conditioned Regularization --------------------
    def compute_coherent_metric(w1: np.ndarray, w2: np.ndarray) -> tuple[np.ndarray, np.ndarray]:
        # Compute complex spectrograms preserving phase information.
        f1, t_spec, Sxx1 = signal.spectrogram(w1, fs=fs, nperseg=base_nperseg,
                                              noverlap=base_noverlap, mode='complex', detrend=False)
        f2, t_spec2, Sxx2 = signal.spectrogram(w2, fs=fs, nperseg=base_nperseg,
                                               noverlap=base_noverlap, mode='complex', detrend=False)
        # Ensure common time axis length.
        common_len = min(len(t_spec), len(t_spec2))
        t_spec = t_spec[:common_len]
        Sxx1 = Sxx1[:, :common_len]
        Sxx2 = Sxx2[:, :common_len]

        # Compute phase differences and coherence between detectors.
        phase_diff = np.angle(Sxx1) - np.angle(Sxx2)
        phase_coherence = np.abs(np.cos(phase_diff))

        # Estimate median PSD per frequency bin from the spectrograms.
        psd1 = np.median(np.abs(Sxx1)**2, axis=1)
        psd2 = np.median(np.abs(Sxx2)**2, axis=1)

        # Frequency-conditioned regularization gain (reflection-guided).
        lambda_f = 0.5 * ((np.median(psd1) / (psd1 + eps)) + (np.median(psd2) / (psd2 + eps)))
        lambda_f = np.clip(lambda_f, 1e-4, 1e-2)
        # Regularization denominator integrating detector PSDs and lambda.
        reg_denom = (psd1[:, None] + psd2[:, None] + lambda_f[:, None] + eps)

        # Weighted phase coherence that balances phase alignment with noise levels.
        weighted_comp = phase_coherence / reg_denom

        # Compute axial (frequency) second derivatives as curvature estimates.
        d2_coh = np.gradient(np.gradient(phase_coherence, axis=0), axis=0)
        avg_curvature = np.mean(np.abs(d2_coh), axis=0)

        # Nonlinear activation boost using tanh for regions of high curvature.
        nonlinear_boost = np.tanh(5 * avg_curvature)
        linear_boost = 1.0 + 0.1 * avg_curvature

        # Cross-detector synergy: weight derived from global median consistency.
        novel_weight = np.mean((np.median(psd1) + np.median(psd2)) / (psd1[:, None] + psd2[:, None] + eps), axis=0)

        # Integrated time-frequency metric combining all enhancements.
        tf_metric = np.sum(weighted_comp * linear_boost * (1.0 + nonlinear_boost), axis=0) * novel_weight

        # Adjust the spectrogram time axis to account for window delay.
        metric_times = t_spec + times[0] + (base_nperseg / 2) / fs
        return tf_metric, metric_times

    tf_metric, metric_times = compute_coherent_metric(white_h1, white_l1)

    # -------------------- Stage 4: Multi-Resolution Thresholding with Octave-Spaced Dyadic Wavelet Validation --------------------
    def multi_resolution_thresholding(metric: np.ndarray, times_arr: np.ndarray) -> tuple[np.ndarray, np.ndarray, np.ndarray]:
        # Robust background estimation with median and MAD.
        bg_level = np.median(metric)
        mad_val = np.median(np.abs(metric - bg_level))
        robust_std = 1.4826 * mad_val
        threshold = bg_level + 1.5 * robust_std

        # Identify candidate peaks using prominence and minimum distance criteria.
        peaks, _ = signal.find_peaks(metric, height=threshold, distance=2, prominence=0.8 * robust_std)
        if peaks.size == 0:
            return np.array([]), np.array([]), np.array([])

        # Local uncertainty estimation using a Gaussian-weighted convolution.
        win_range = np.arange(-uncertainty_window, uncertainty_window + 1)
        sigma = uncertainty_window / 2.5
        gauss_kernel = np.exp(-0.5 * (win_range / sigma) ** 2)
        gauss_kernel /= np.sum(gauss_kernel)
        weighted_mean = np.convolve(metric, gauss_kernel, mode='same')
        weighted_sq = np.convolve(metric ** 2, gauss_kernel, mode='same')
        variances = np.maximum(weighted_sq - weighted_mean ** 2, 0.0)
        uncertainties = np.sqrt(variances)
        uncertainties = np.maximum(uncertainties, 0.01)

        valid_times = []
        valid_heights = []
        valid_uncerts = []
        n_metric = len(metric)

        # Compute a simple second derivative for local curvature checking.
        if n_metric > 2:
            second_deriv = np.diff(metric, n=2)
            second_deriv = np.pad(second_deriv, (1, 1), mode='edge')
        else:
            second_deriv = np.zeros_like(metric)

        # Use octave-spaced scales (dyadic wavelet validation) to validate peak significance.
        widths = np.arange(1, 9)  # approximate scales 1 to 8
        for peak in peaks:
            # Skip peaks lacking sufficient negative curvature.
            if second_deriv[peak] > -0.1 * robust_std:
                continue
            local_start = max(0, peak - uncertainty_window)
            local_end = min(n_metric, peak + uncertainty_window + 1)
            local_segment = metric[local_start:local_end]
            if len(local_segment) < 3:
                continue
            try:
                cwt_coeff = signal.cwt(local_segment, signal.ricker, widths)
            except Exception:
                continue
            max_coeff = np.max(np.abs(cwt_coeff))
            # Threshold for validating the candidate using local MAD.
            cwt_thresh = mad_val * np.sqrt(2 * np.log(len(local_segment) + eps))
            if max_coeff >= cwt_thresh:
                valid_times.append(times_arr[peak])
                valid_heights.append(metric[peak])
                valid_uncerts.append(uncertainties[peak])

        if len(valid_times) == 0:
            return np.array([]), np.array([]), np.array([])
        return np.array(valid_times), np.array(valid_heights), np.array(valid_uncerts)

    peak_times, peak_heights, peak_deltat = multi_resolution_thresholding(tf_metric, metric_times)
    return peak_times, peak_heights, peak_deltat
hewang@ucas.ac.cn
Interpretable Gravitational Wave Data Analysis with DL and LLMs
HW et al., In preparation
Out-of-distribution (OOD) detection
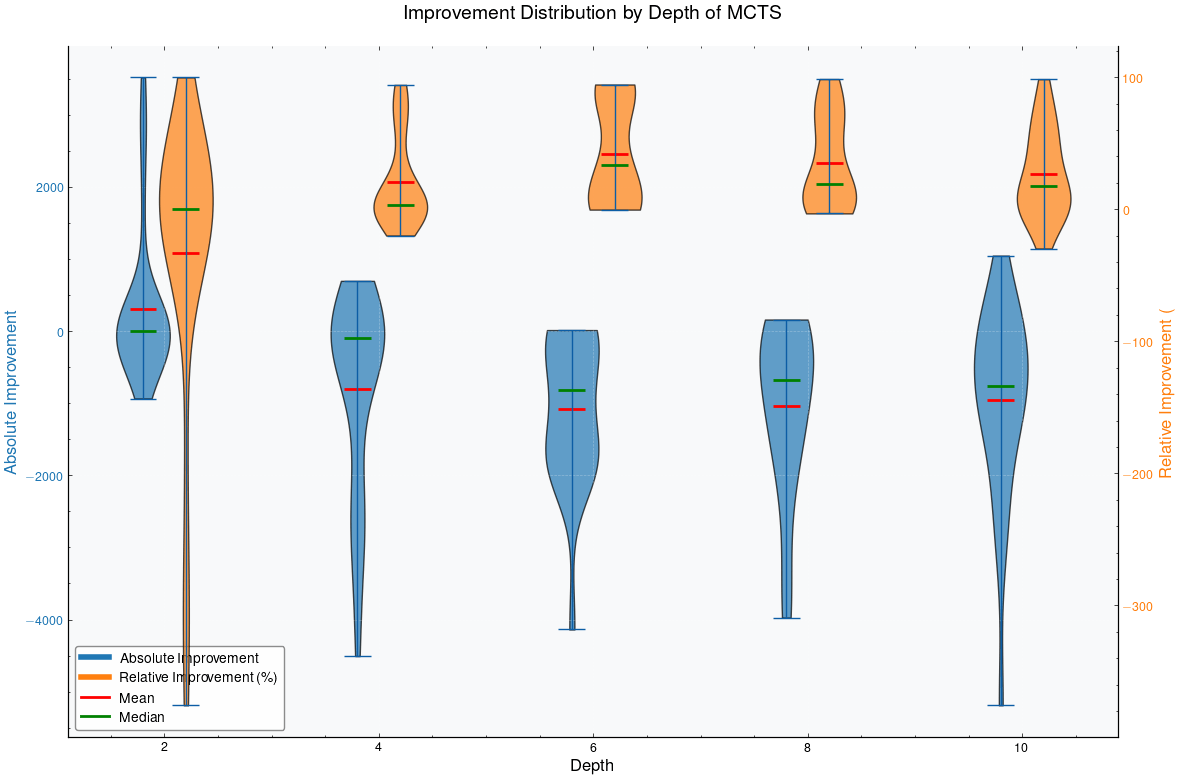
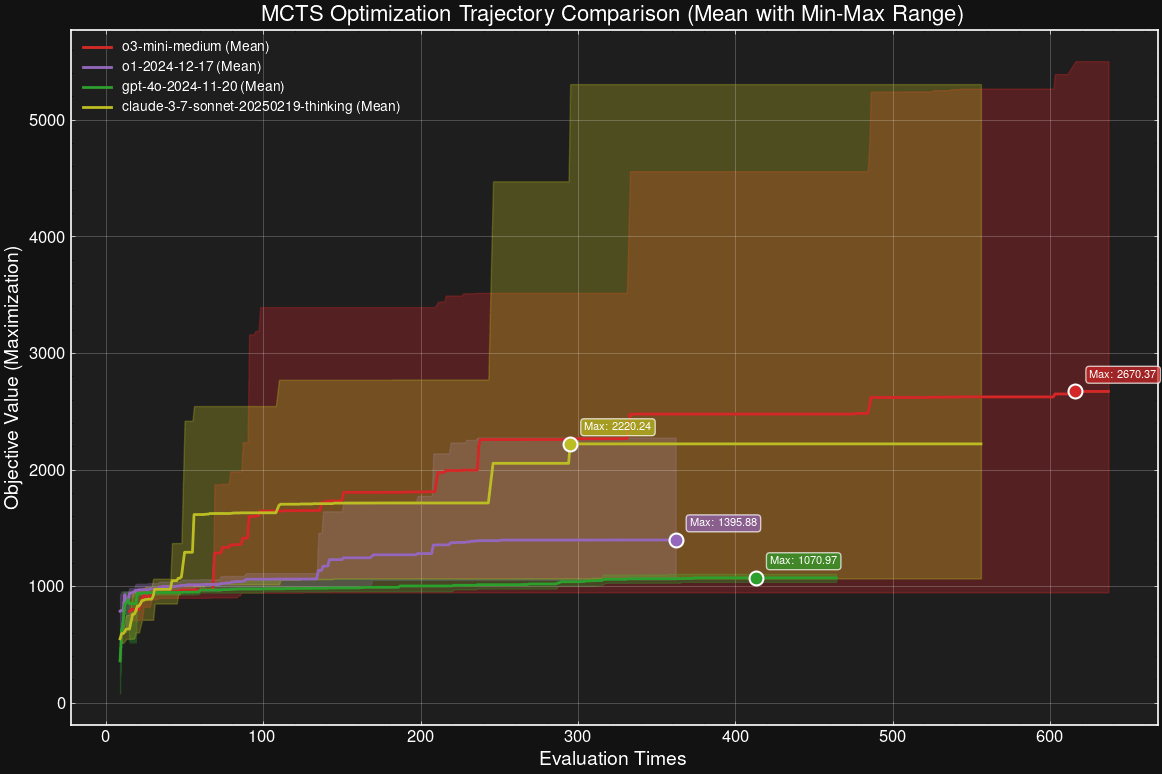
MCTS Depth-Stratified Performance Analysis.
hewang@ucas.ac.cn
Algorithmic Component Impact Analysis.
GW150914
Interpretable Gravitational Wave Data Analysis with DL and LLMs
HW et al., In preparation
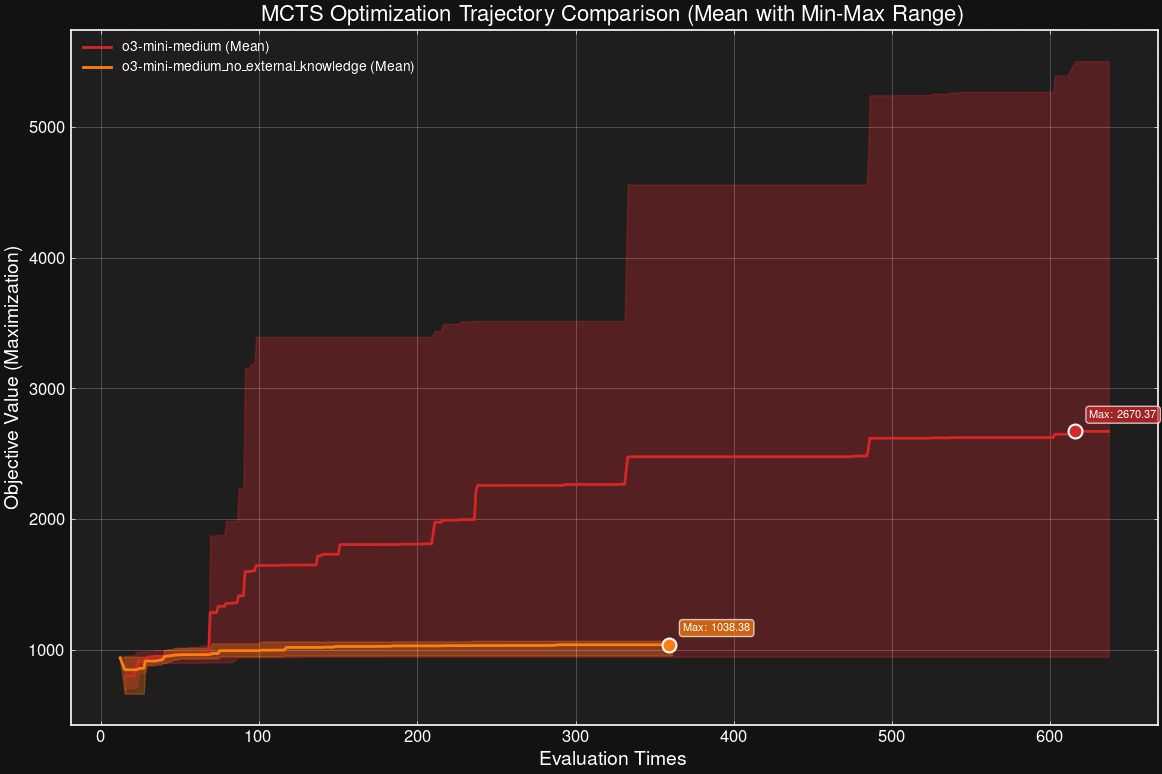
Effect of scale
Contributions of knowledge synthesis
hewang@ucas.ac.cn
Combining the interpretability of physics with the power of AI
Our Mission: To create transparent AI systems that combine physics-based interpretability with deep learning capabilities
Interpretable AI Approach
The best of both worlds
Input
Physics-Informed
AI Algorithm
(High interpretability)
Output
Example: Our Approach
(In Preparation)
AI Model
Physics
Knowledge
Traditional Physics Approach
Input
Human-Designed Algorithm
(Based on human insight)
Output
Example: Matched Filtering, linear regression
Black-Box AI Approach
Input
AI Model
(Low interpretability)
Output
Examples: CNN, AlphaGo, DINGO
Data/
Experience
Data/
Experience
Interpretable Gravitational Wave Data Analysis with DL and LLMs
🎯 OUR WORK
hewang@ucas.ac.cn
Interpretable Gravitational Wave Data Analysis with DL and LLMs
hewang@ucas.ac.cn
理论基础:
引力波物理
数字信号处理
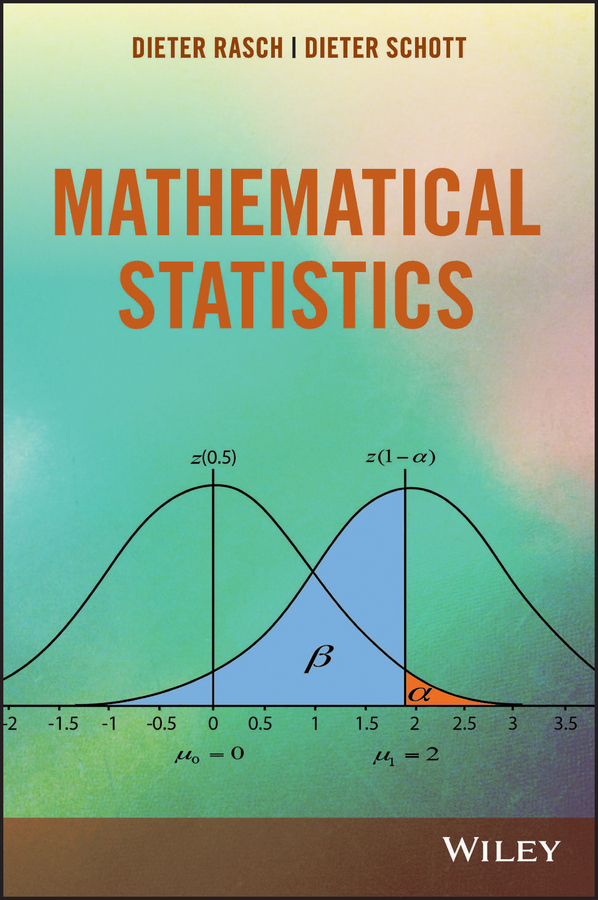
数理统计
编程基础:
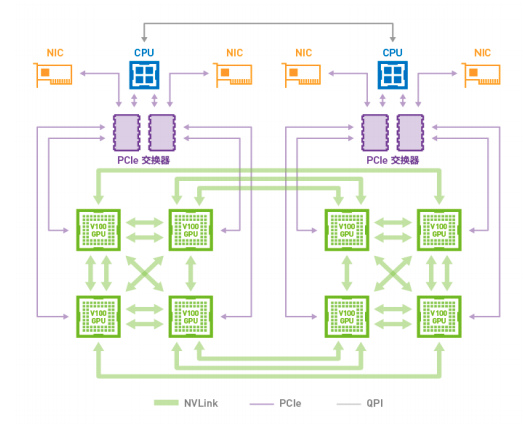
硬件基础:
Miller, M.C., Yunes, N. The new frontier of gravitational waves. Nature 568, 469–476 (2019).
引力波物理与引力波天文学
数字信号处理
R.C. Cofer, Benjamin F. Harding, in Rapid System Prototyping with FPGAs, 2006
Dieter Rasch, Dieter Schott. Mathematical Statistics, (2018)
数理统计
Interpretable Gravitational Wave Data Analysis with DL and LLMs
hewang@ucas.ac.cn
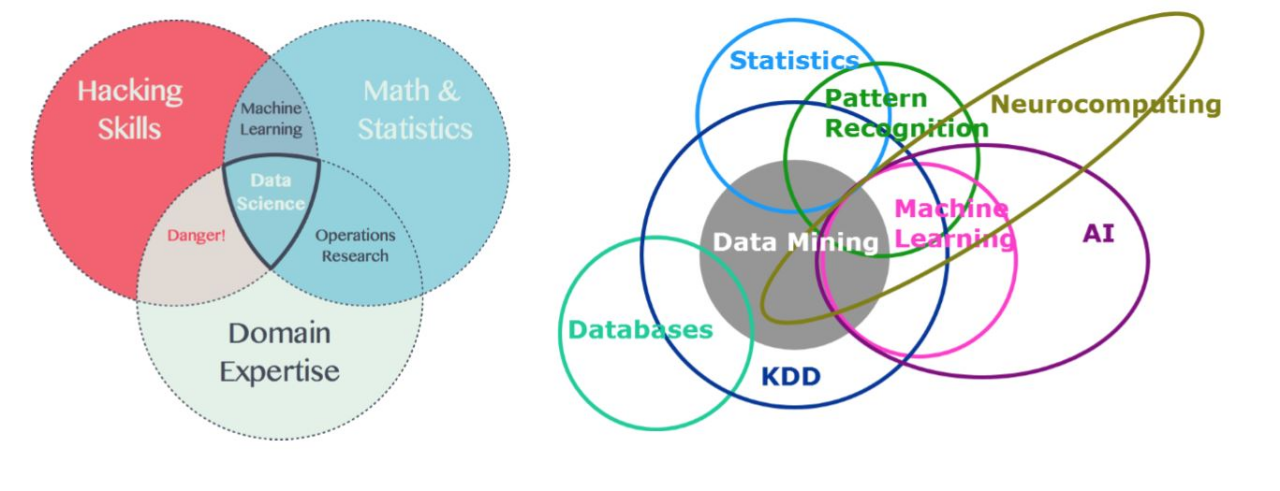
理论基础:
引力波物理 (pycbc, lalsuite, lisacode, bilby, ... )
数字信号处理 (scipy, stat, ...)
数理统计 (bilby, emcee, ptemcee, ptmcmc, …)
编程基础:
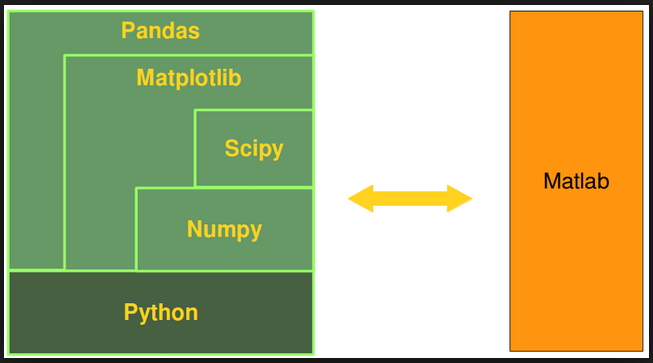
Python (numpy, pandas; matplotlib; ...),
AI (scikit-learn, XGBoost, PyTorch, TensorFlow, JAX, ...)
Linux (docker, github, bash, vim, emacs …)
硬件基础:
主板、内存,GPUs,显存 ...
Key Insights from Our Journey
The Critical Role of Interpretability
Algorithm interpretability provides multiple essential benefits:
The future of (gravitational wave) science lies at the intersection of traditional physics-inspired methods and interpretable AI approaches, creating a new paradigm for reliable scientific discovery.
Interpretable Gravitational Wave Data Analysis with DL and LLMs
hewang@ucas.ac.cn
Key Insights from Our Journey
The Critical Role of Interpretability
Algorithm interpretability provides multiple essential benefits:
The future of gravitational wave science lies at the intersection of traditional physics-inspired methods and interpretable AI approaches, creating a new paradigm for reliable scientific discovery.
hewang@ucas.ac.cn
Interpretable Gravitational Wave Data Analysis with DL and LLMs
for _ in range(num_of_audiences):
print('Thank you for your attention! 🙏')Q1: Can LLMs truly generate novel content beyond their training data?
Q2: Why can LLMs perform reasoning in ways that remain imperceptible to us?
Interpretable Gravitational Wave Data Analysis with DL and LLMs
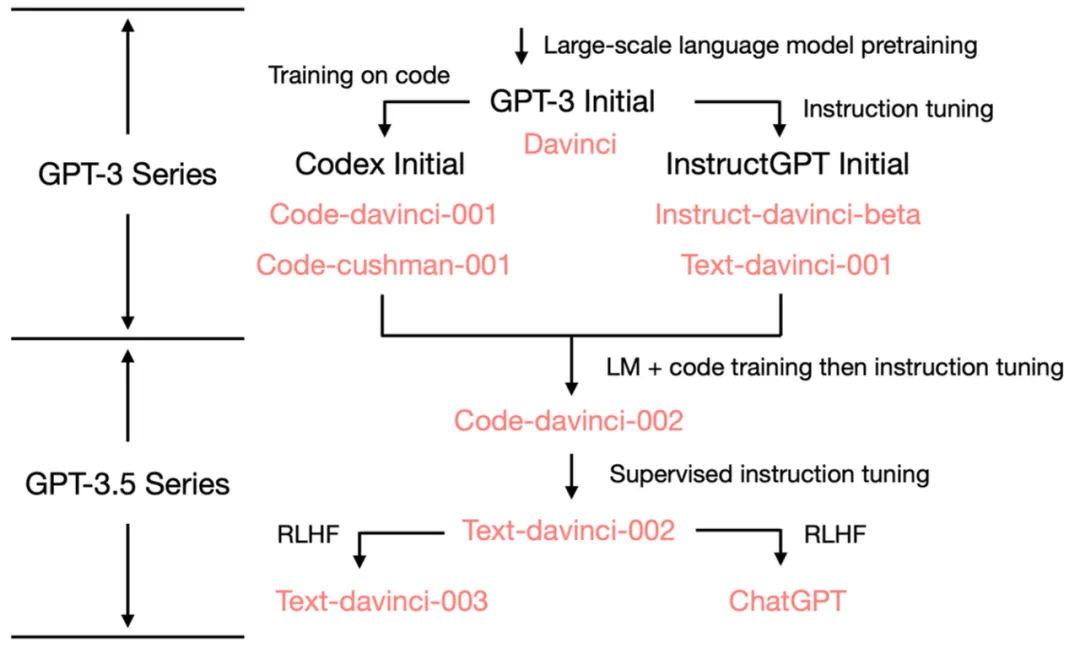
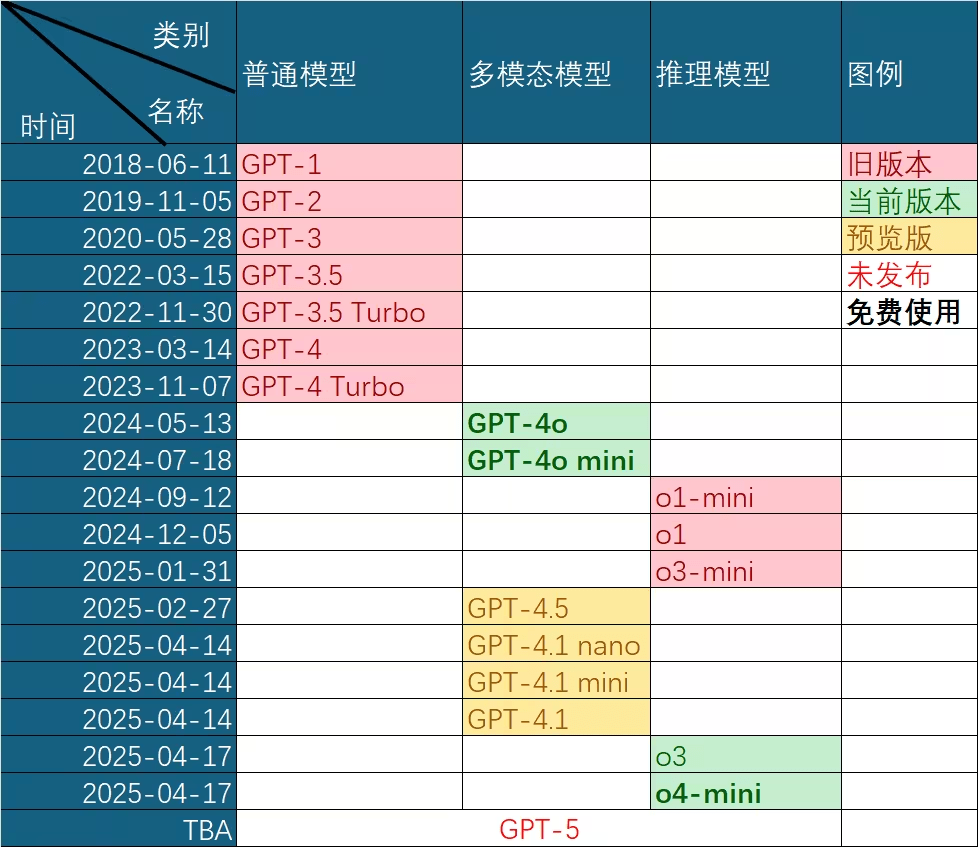
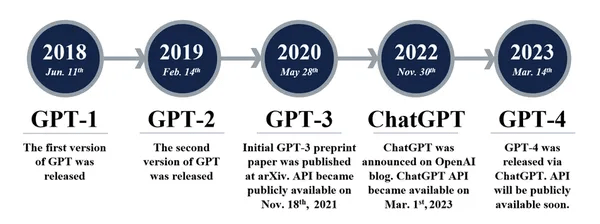
Evolution of GPT Capabilities
A careful examination of GPT-3.5's capabilities reveals the origins of its emergent abilities:
GPT-3.5 series [Source: University of Edinburgh, Allen Institute for AI]
GPT-3 (2020)
ChatGPT (2022)
Magic: Code + Text
Interpretable Gravitational Wave Data Analysis with DL and LLMs
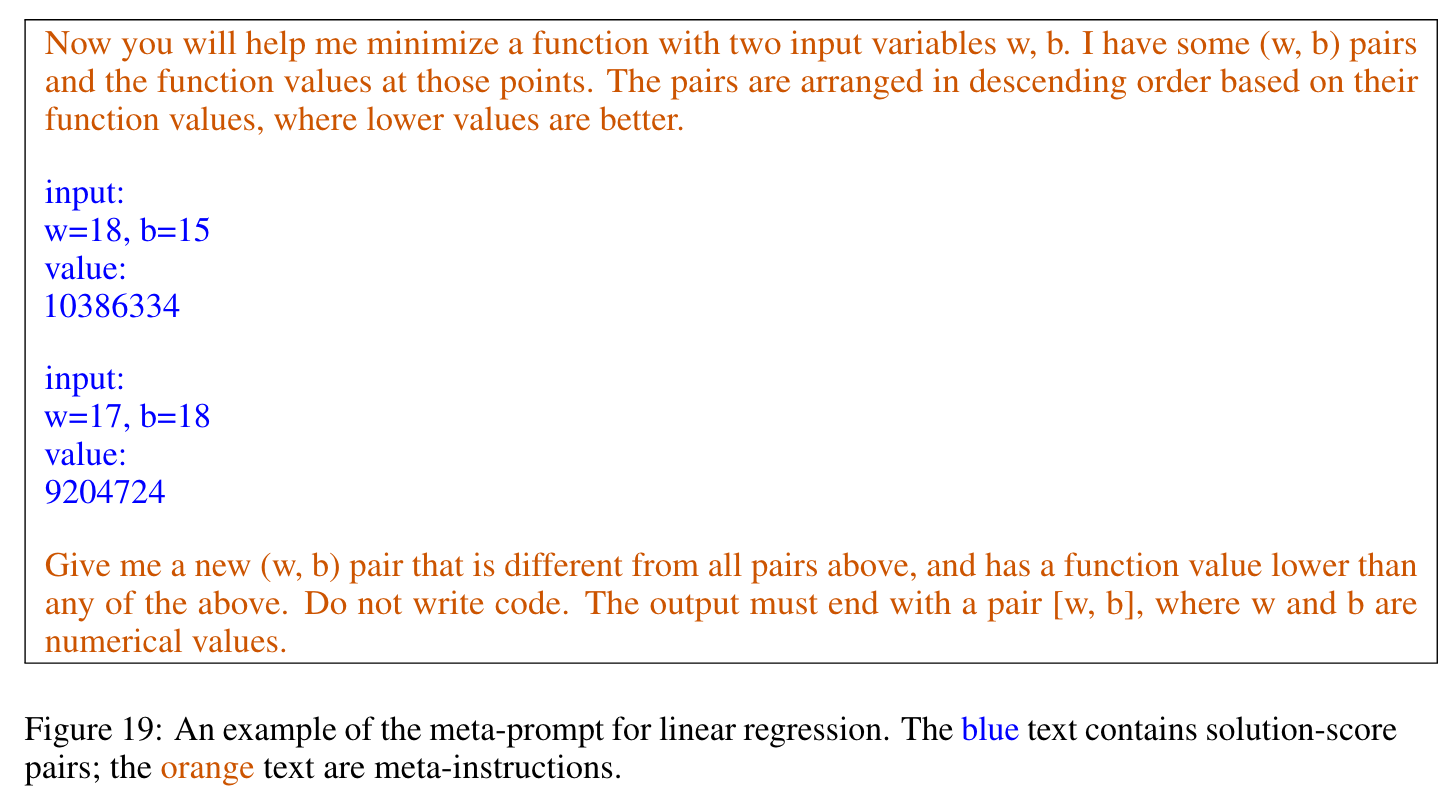
Recent research demonstrates that LLMs can solve complex optimization problems through carefully engineered prompts. DeepMind's OPRO (Optimization by PROmpting) approach showcases how LLMs can generate increasingly refined solutions through iterative prompting techniques.
OPRO: Optimization by PROmpting
Example: Least squares optimization through prompt engineering
arXiv:2309.03409 [cs.NE]
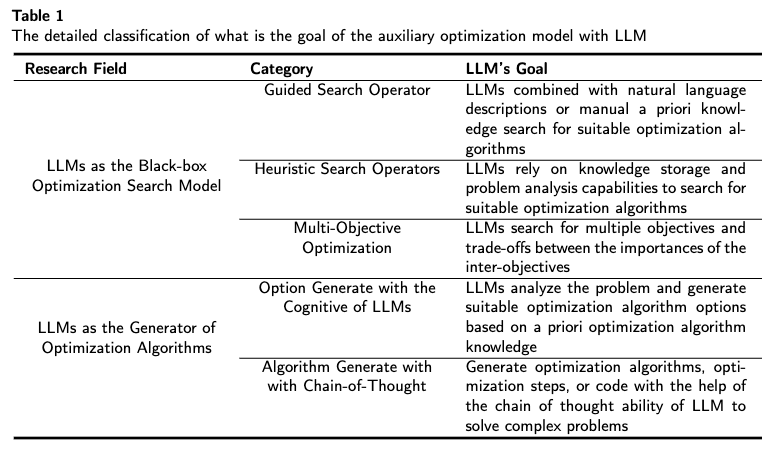
Two Directions of LLM-based Optimization
arXiv:2405.10098 [cs.NE]
LLMs can generate high-quality solutions to optimization problems without specialized training
Interpretable Gravitational Wave Data Analysis with DL and LLMs
The Interpolation Theory
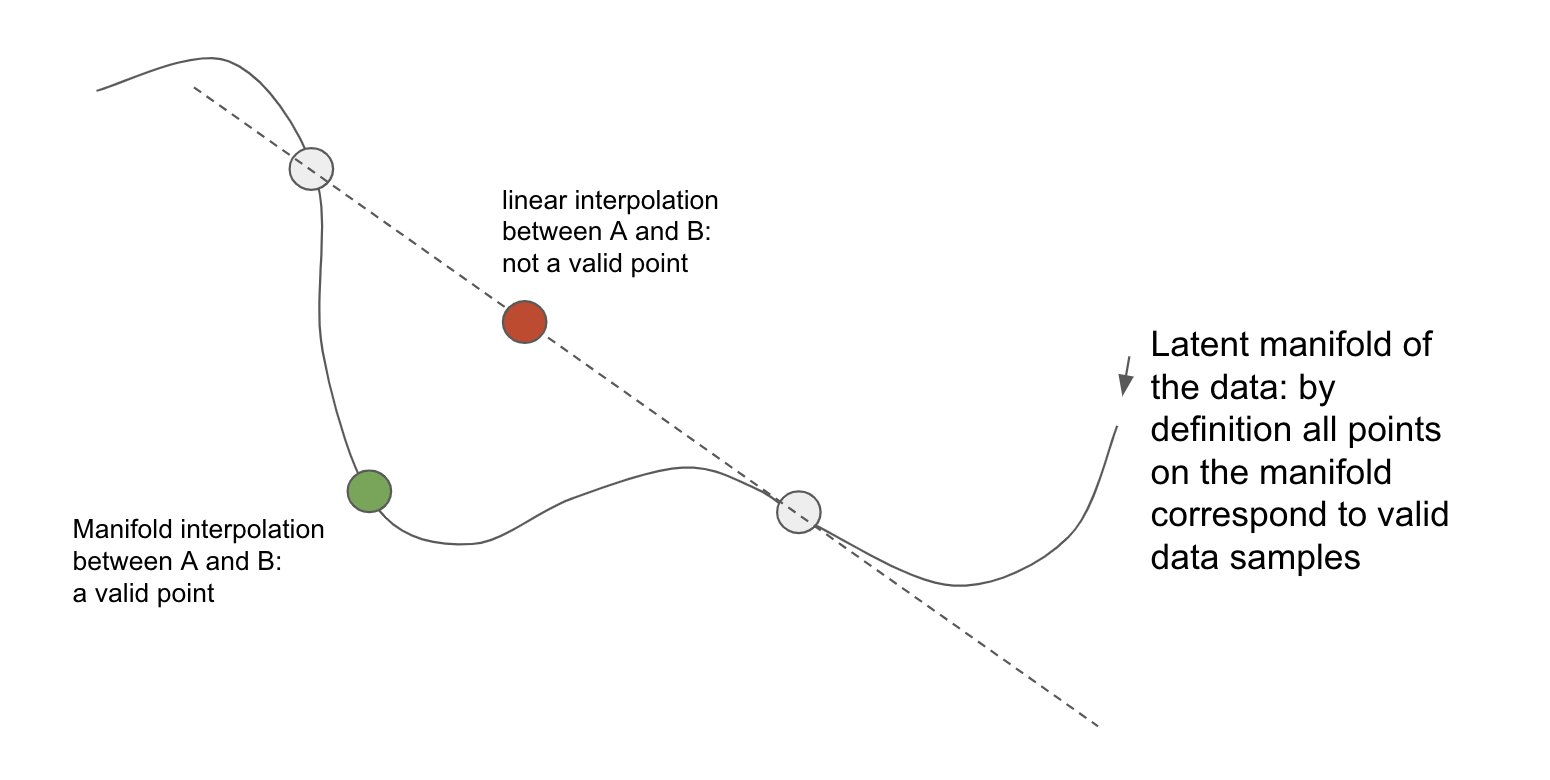
LLMs' ability to generate novel responses from few examples is increasingly understood as manifold interpolation rather than mere memorization:
The theory suggests that in-context learning is not "learning" in the traditional sense, but rather a form of implicit conditioning on the manifold of learned representations.
Representation Space Interpolation
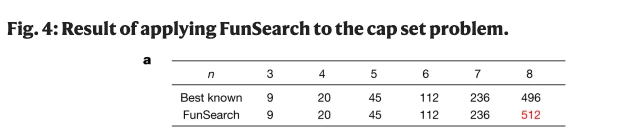
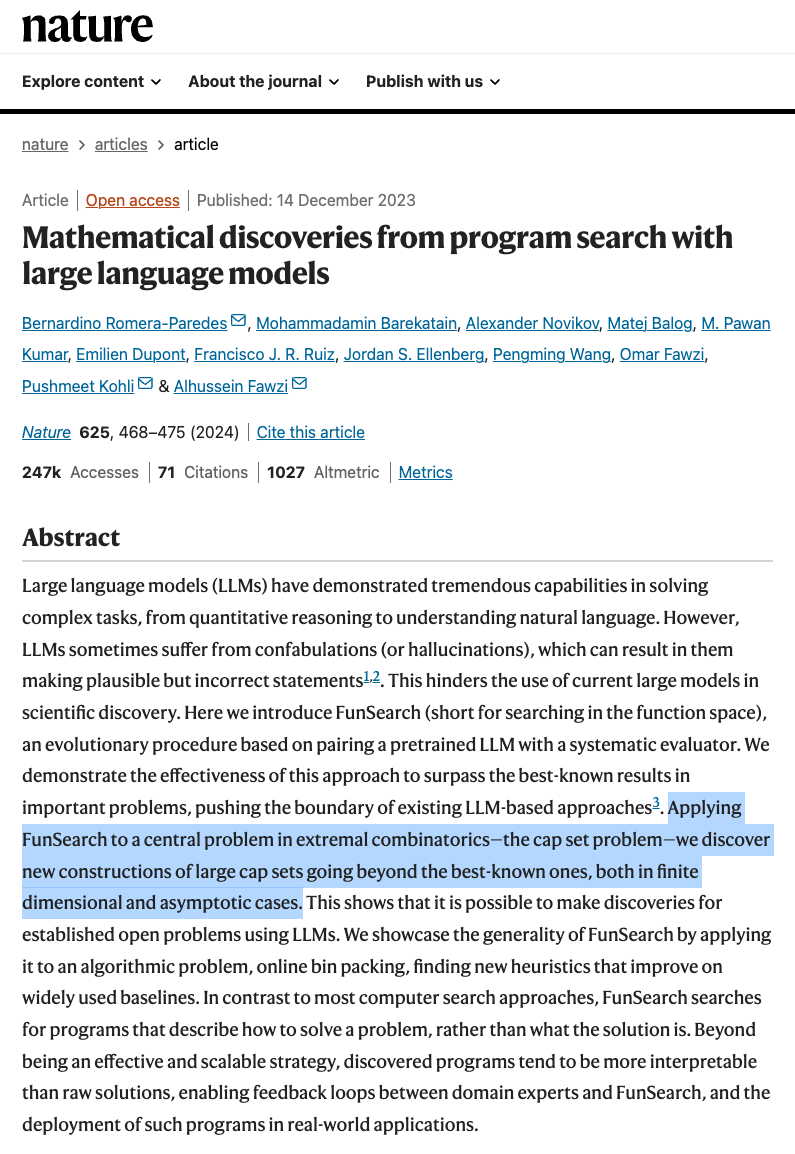
Real-world Case: FunSearch (Nature, 2023)
Interpretable Gravitational Wave Data Analysis with DL and LLMs
Q1: Can LLMs truly generate novel content beyond their training data?
Q2: Why can LLMs perform reasoning in ways that remain imperceptible to us?
Interpretable Gravitational Wave Data Analysis with DL and LLMs
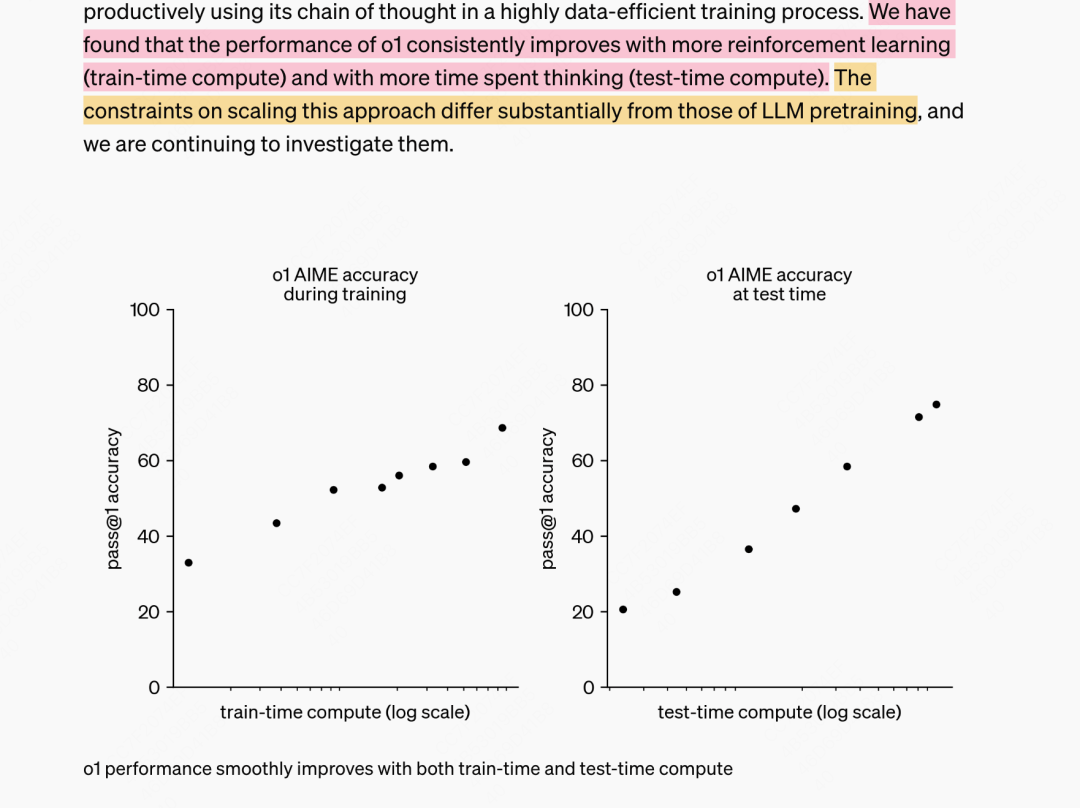
📄 Google DeepMind: "Scaling LLM Test-Time Compute Optimally" (arXiv:2408.03314)
🔗 OpenAI: Learning to Reason with LLMs
Iterative refinement during inference dramatically improves reasoning capabilities without increasing model size or retraining
Performance improvements with test-time compute scaling
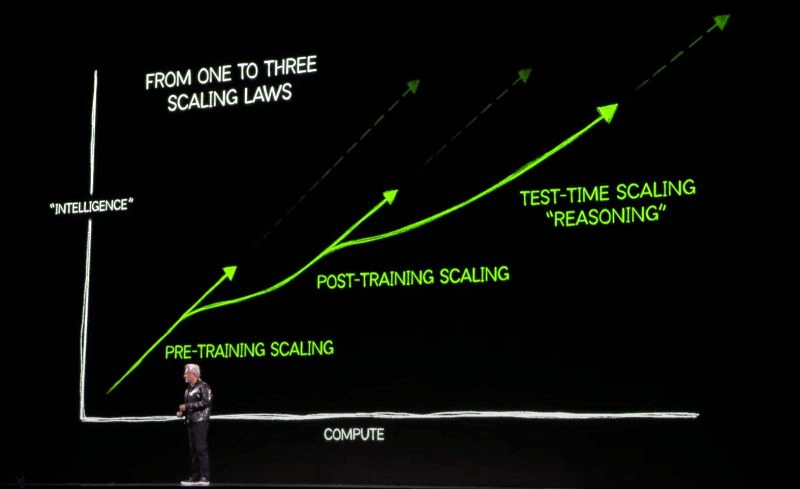
From pre-training to test-time:
Three scaling regimes
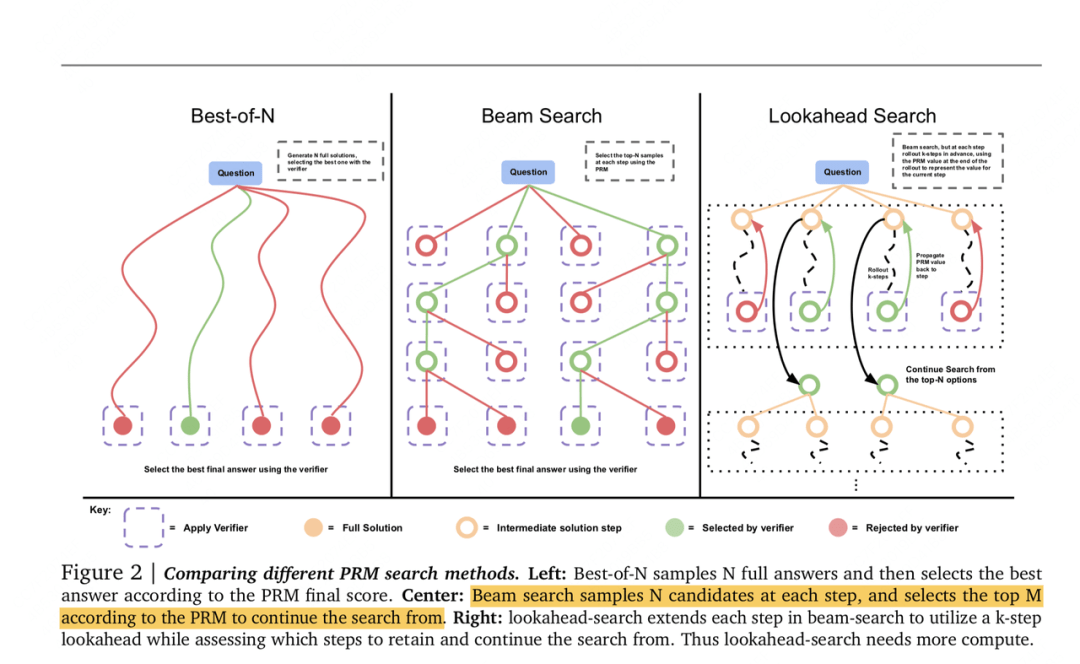
Different search methods for iterative reasoning
Interpretable Gravitational Wave Data Analysis with DL and LLMs
Q1: Can LLMs truly generate novel content beyond their training data?
Q2: Why can LLMs perform reasoning in ways that remain imperceptible to us?
Interpretable Gravitational Wave Data Analysis with DL and LLMs
Q3: Why should you consider applying ML to gravitational wave astrophysics?
Interpretable Gravitational Wave Data Analysis with DL and LLMs
我们为什么要考虑用 AI tool 来替换传统方法做研究呢?
hewang@ucas.ac.cn
AI is taking over the world... literally everywhere
Interpretable Gravitational Wave Data Analysis with DL and LLMs
hewang@ucas.ac.cn
Let's be honest about our motivations... 😉
The perfectly valid "scientific" reasons:
Credit: Chris Messenger (MLA meeting,, Jan 2025)
Interpretable Gravitational Wave Data Analysis with DL and LLMs
严肃的讲,上述 motivation 并不应该是成为从事科学研究的思路和方向。
hewang@ucas.ac.cn
The core motivations behind nearly all AI+GW research
So much data, so little time!
• Bayesian parameter estimation
• Replaces computationally intensive components
Consistently outperforms traditional approaches
• Unmodelled burst searches
• Continuous GW searches
Provides deeper insights into complex problems
• Reveals patterns through interpretability
• Enables previously impractical approaches
* When properly trained and validated on appropriate datasets
Credit: Chris Messenger (MLA meeting,, Jan 2025)
Interpretable Gravitational Wave Data Analysis with DL and LLMs
hewang@ucas.ac.cn
但杀鸡焉用牛刀?!
The reality of ML in scientific research is more nuanced
No: We need to think more critically
Twitter: @DeepLearningAI_
Interpretable Gravitational Wave Data Analysis with DL and LLMs
hewang@ucas.ac.cn
本质上,都可以归结为“黑箱”或“可解释性差”的问题
The mathematical inevitability and the path to understanding
The existence theorem that guarantees solutions
The solution is mathematically guaranteed — our challenge is finding the path to it
Machine learning will win in the long run
AI models still have vast potential compared to the human brain's efficiency. Beating traditional methods is mathematically inevitable given sufficient resources.
The question is not if AI/ML will win, but how
Understanding AI's inner workings is the real challenge, not proving its capabilities.
That's where we can learn something exciting with Foundation Models.
Interpretable Gravitational Wave Data Analysis with DL and LLMs
hewang@ucas.ac.cn
尽管种种,还是应该报以理性的期待和足够的乐观
Q1: Can LLMs truly generate novel content beyond their training data?
Q2: Why can LLMs perform reasoning in ways that remain imperceptible to us?
Interpretable Gravitational Wave Data Analysis with DL and LLMs
Q4:In general, how to use AI for science?
Q3: Why should you consider applying ML to gravitational wave astrophysics?
Interpretable Gravitational Wave Data Analysis with DL and LLMs
hewang@ucas.ac.cn
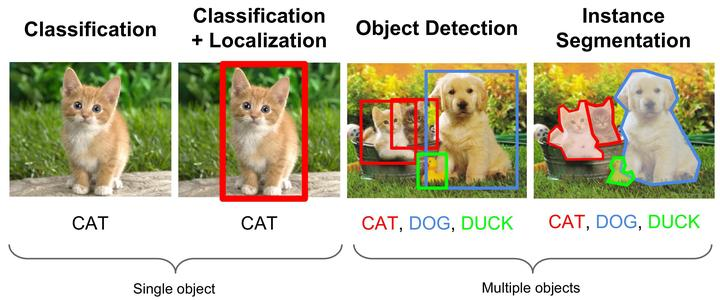
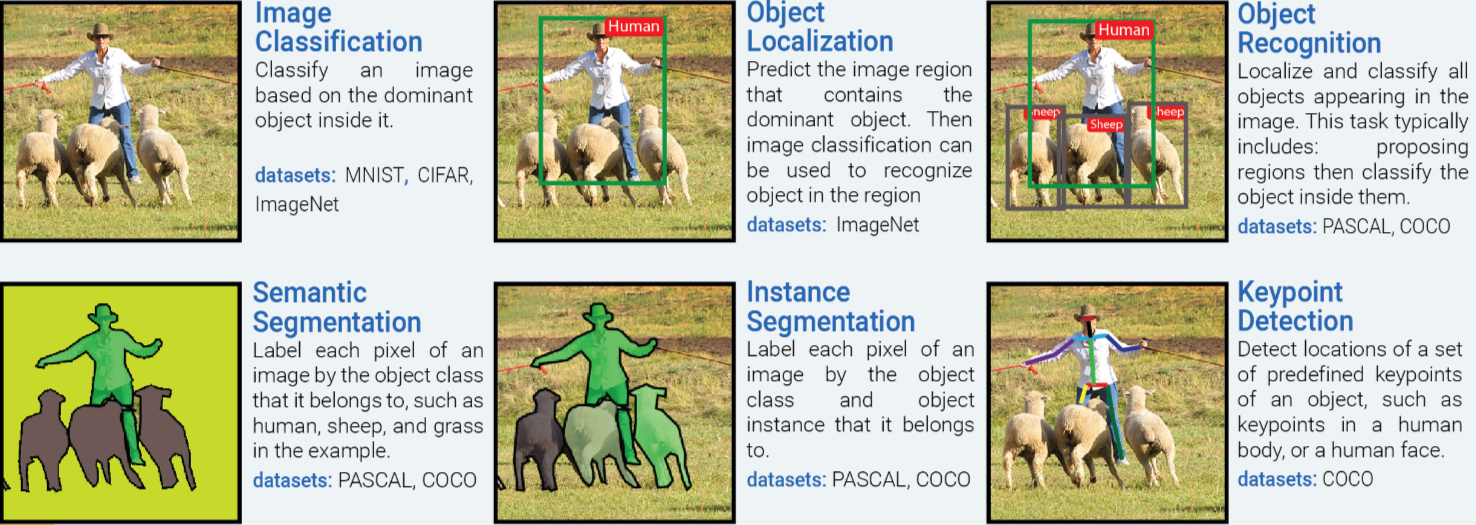
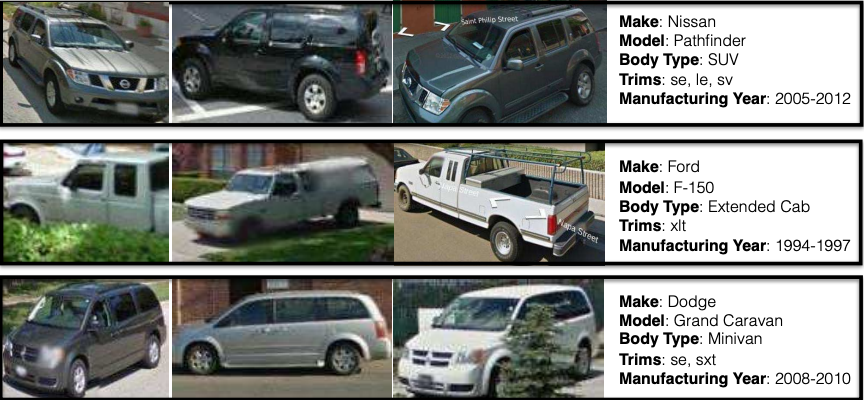
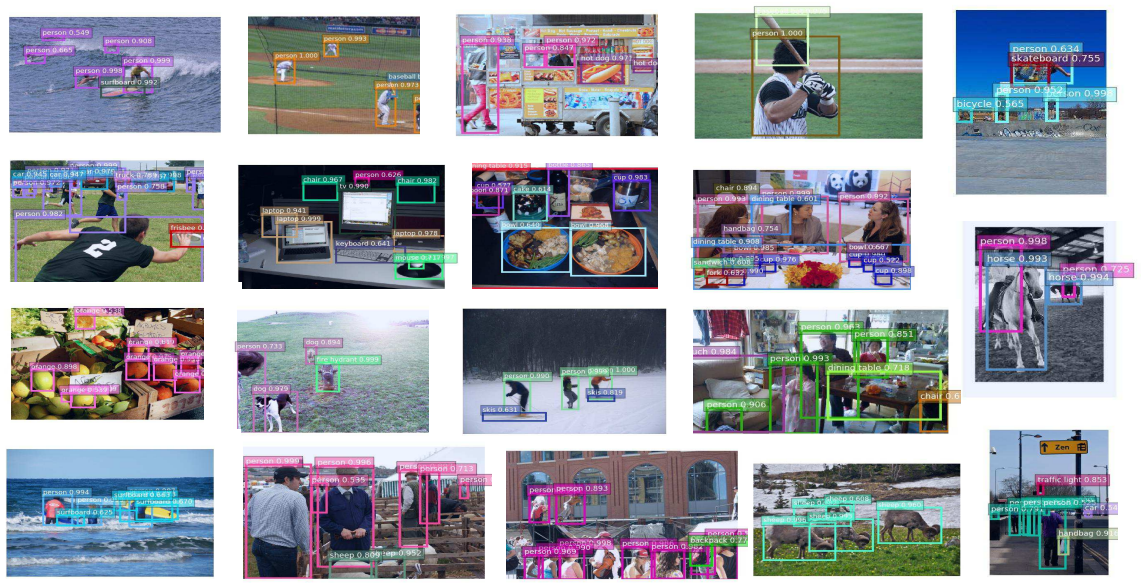
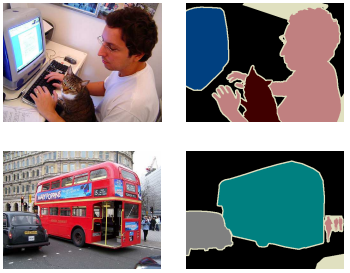
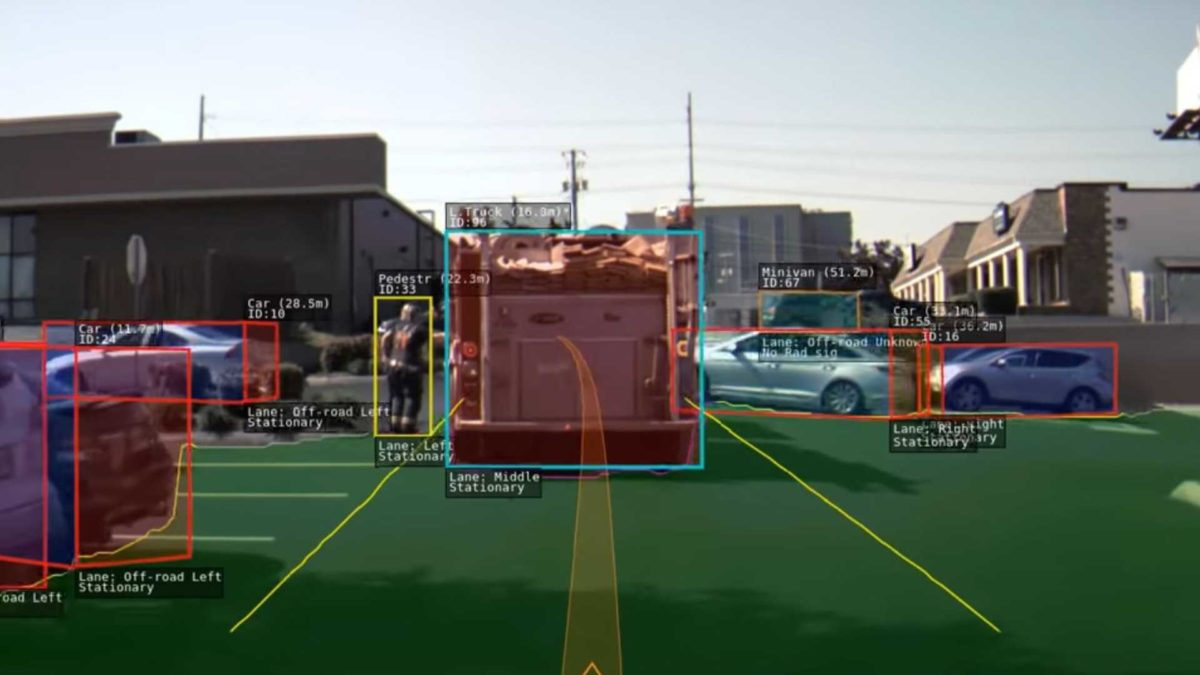
Gebru et al. ICCV (2017)
Zhou et al. CVPR (2018)
Shen et al. CVPR (2018)
Image courtesy of Tesla (2020)
从AI应用的原理理解技术相同点
eg: GW search
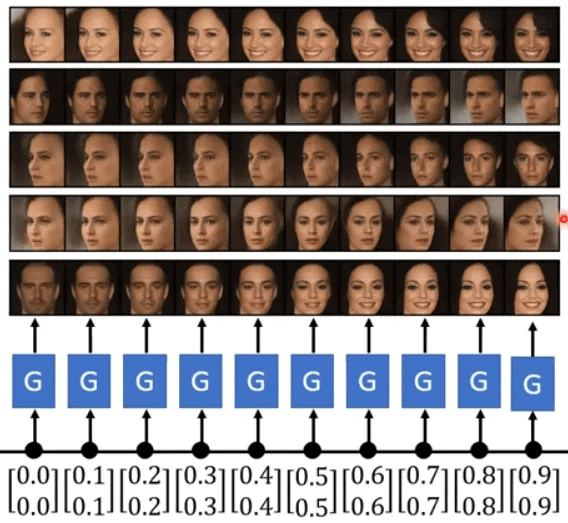
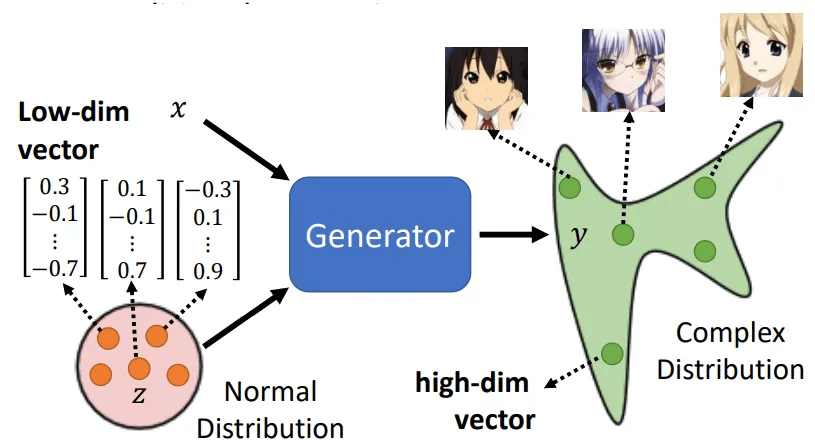
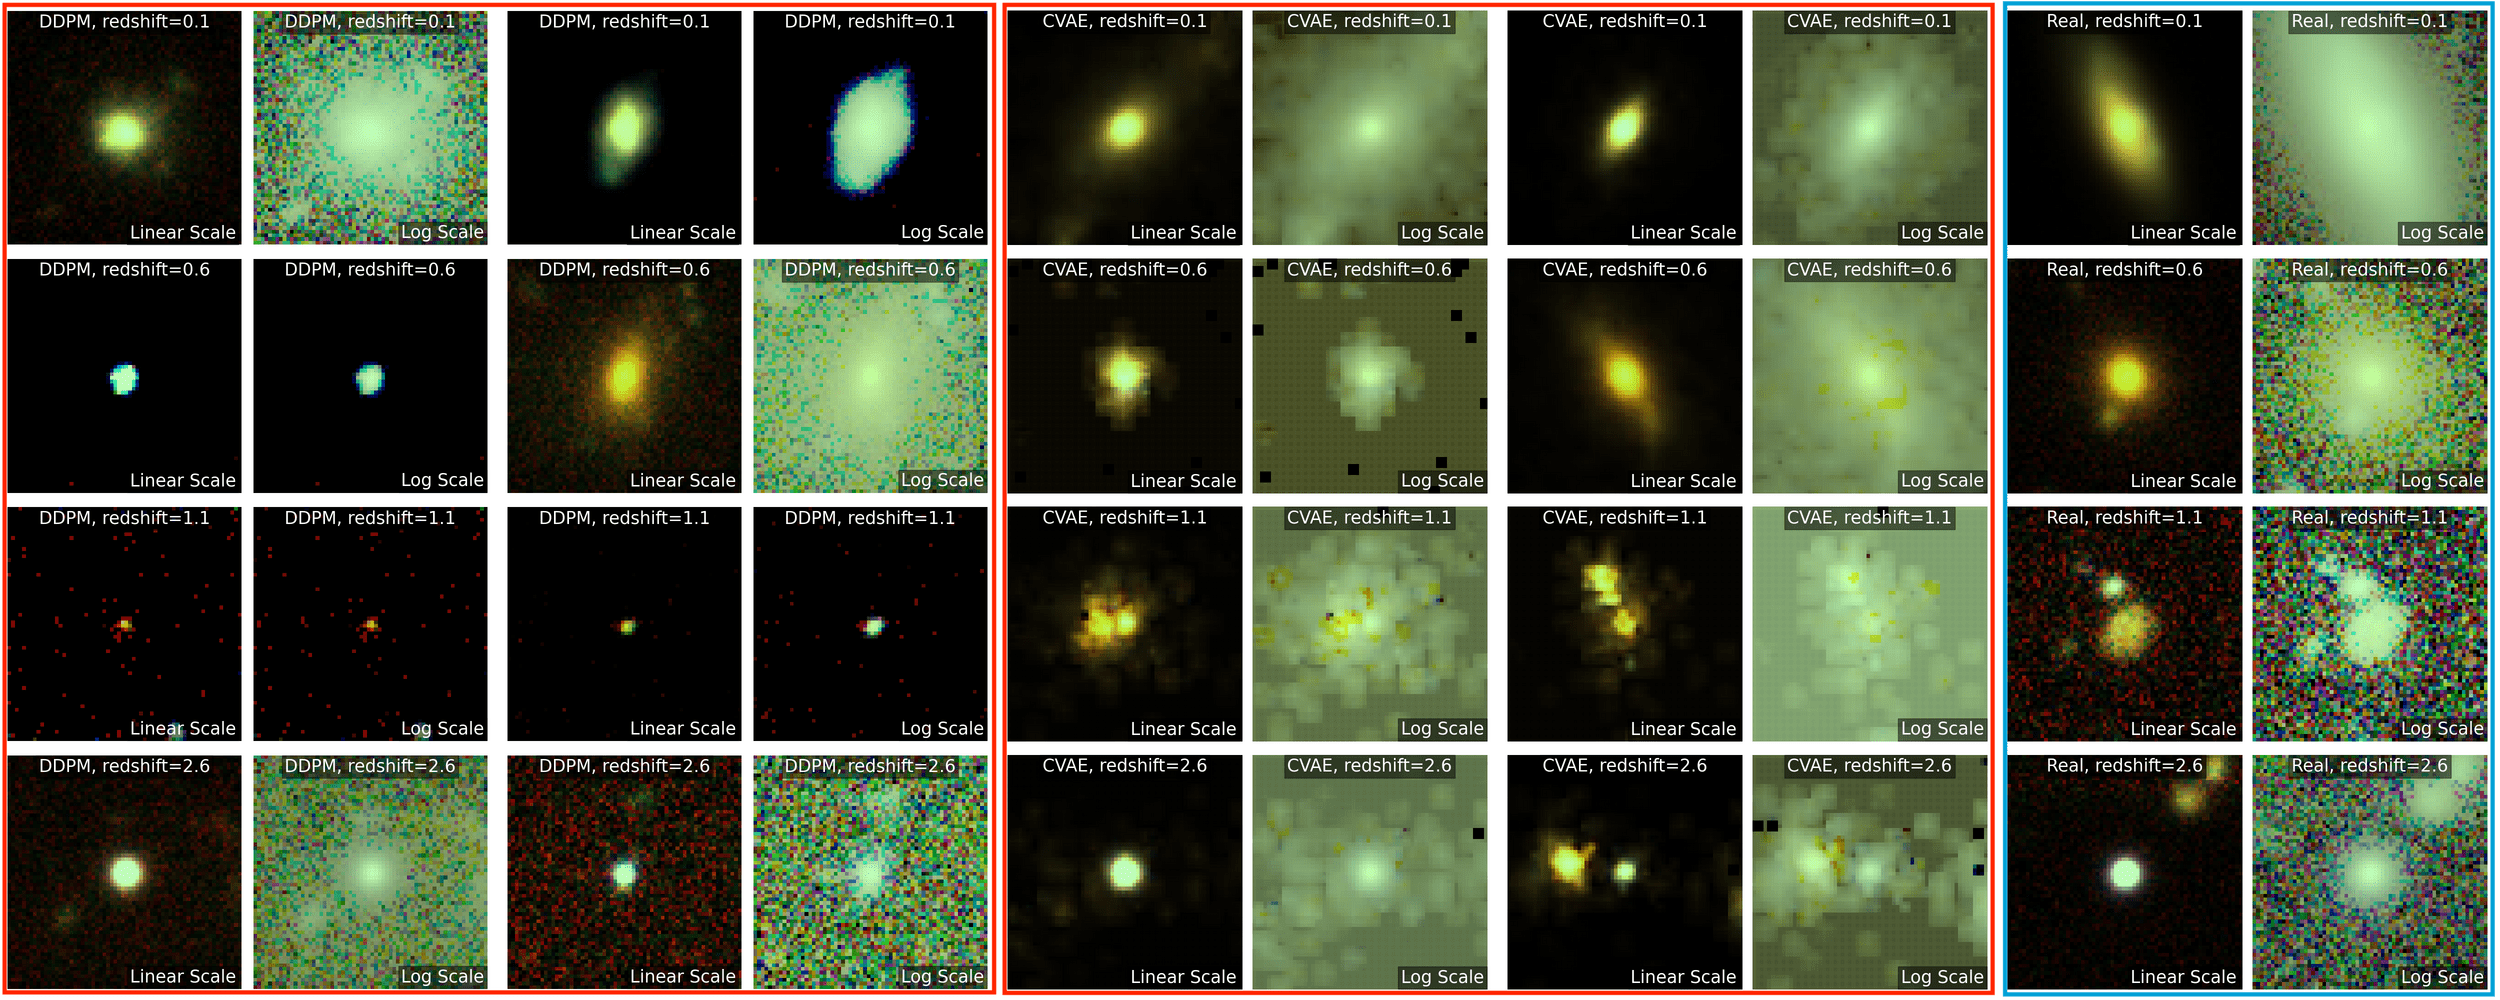
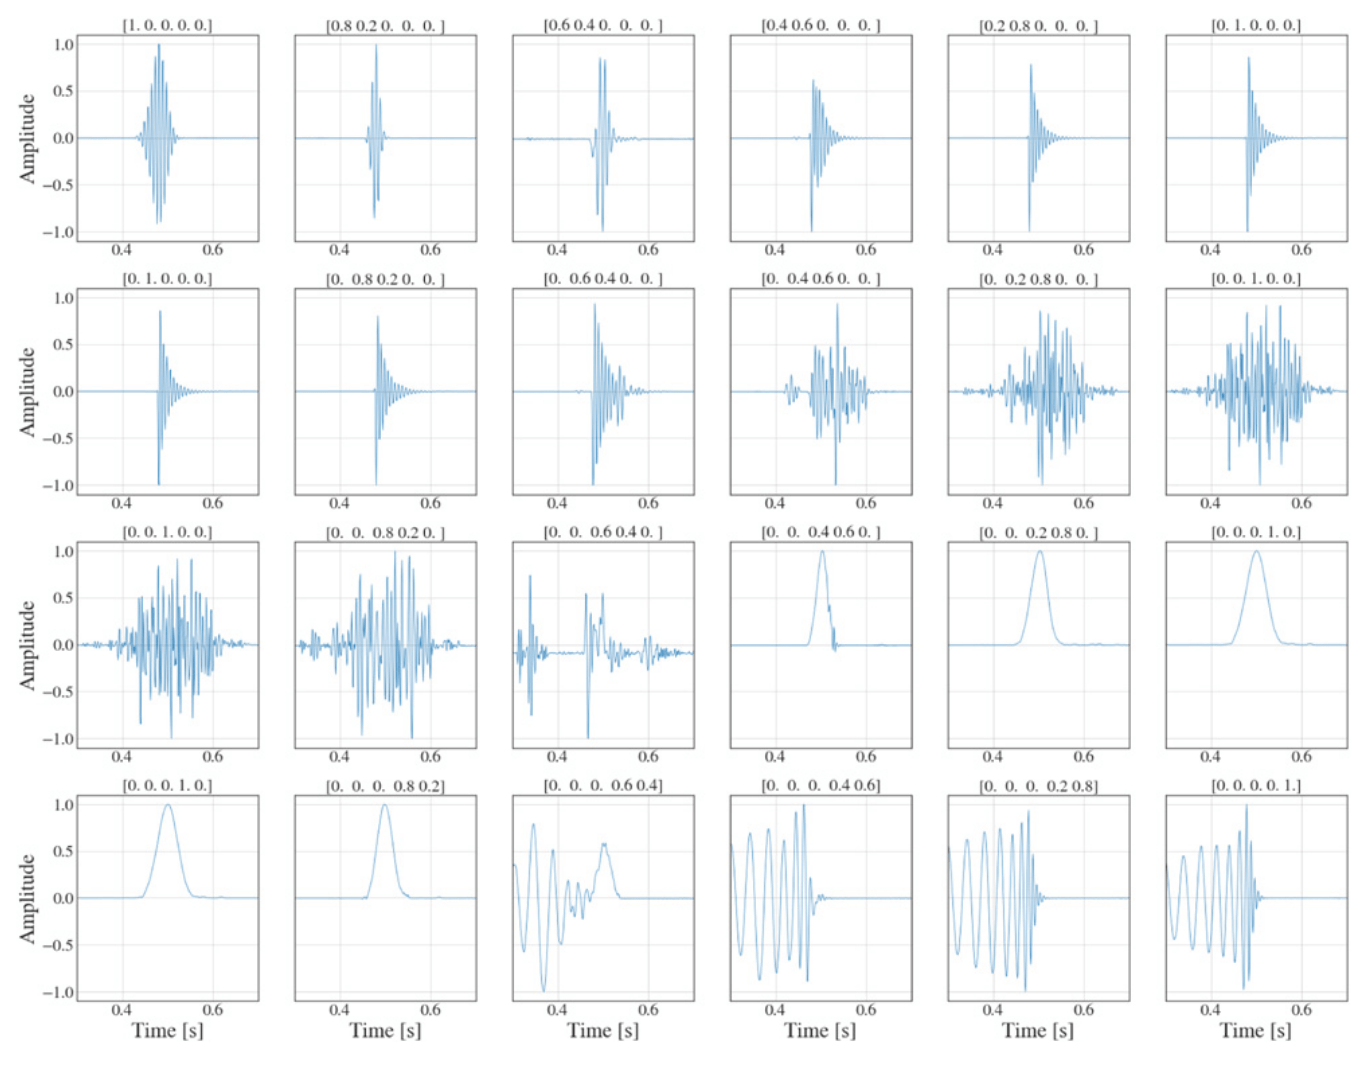
Representation Space Interpolation
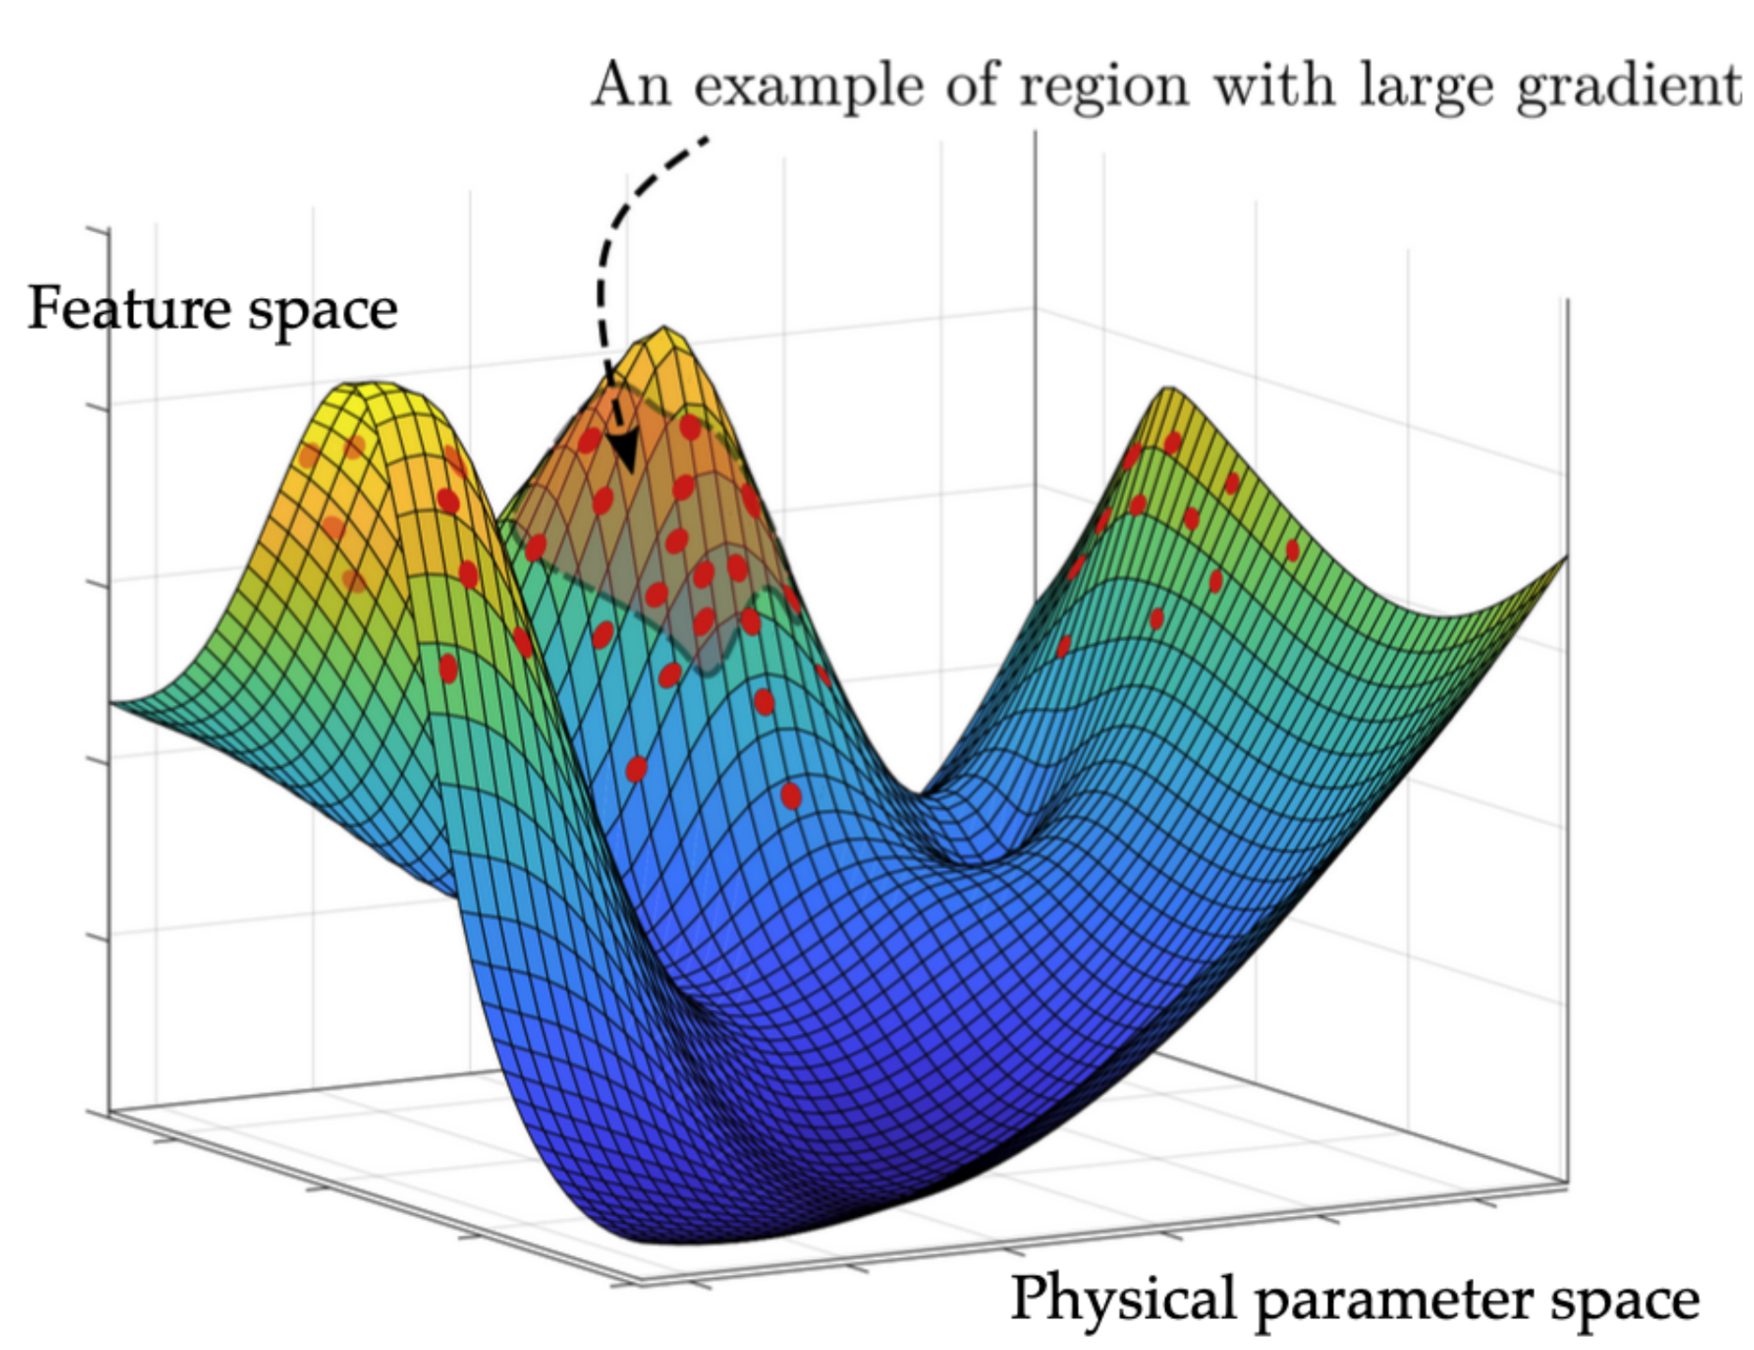
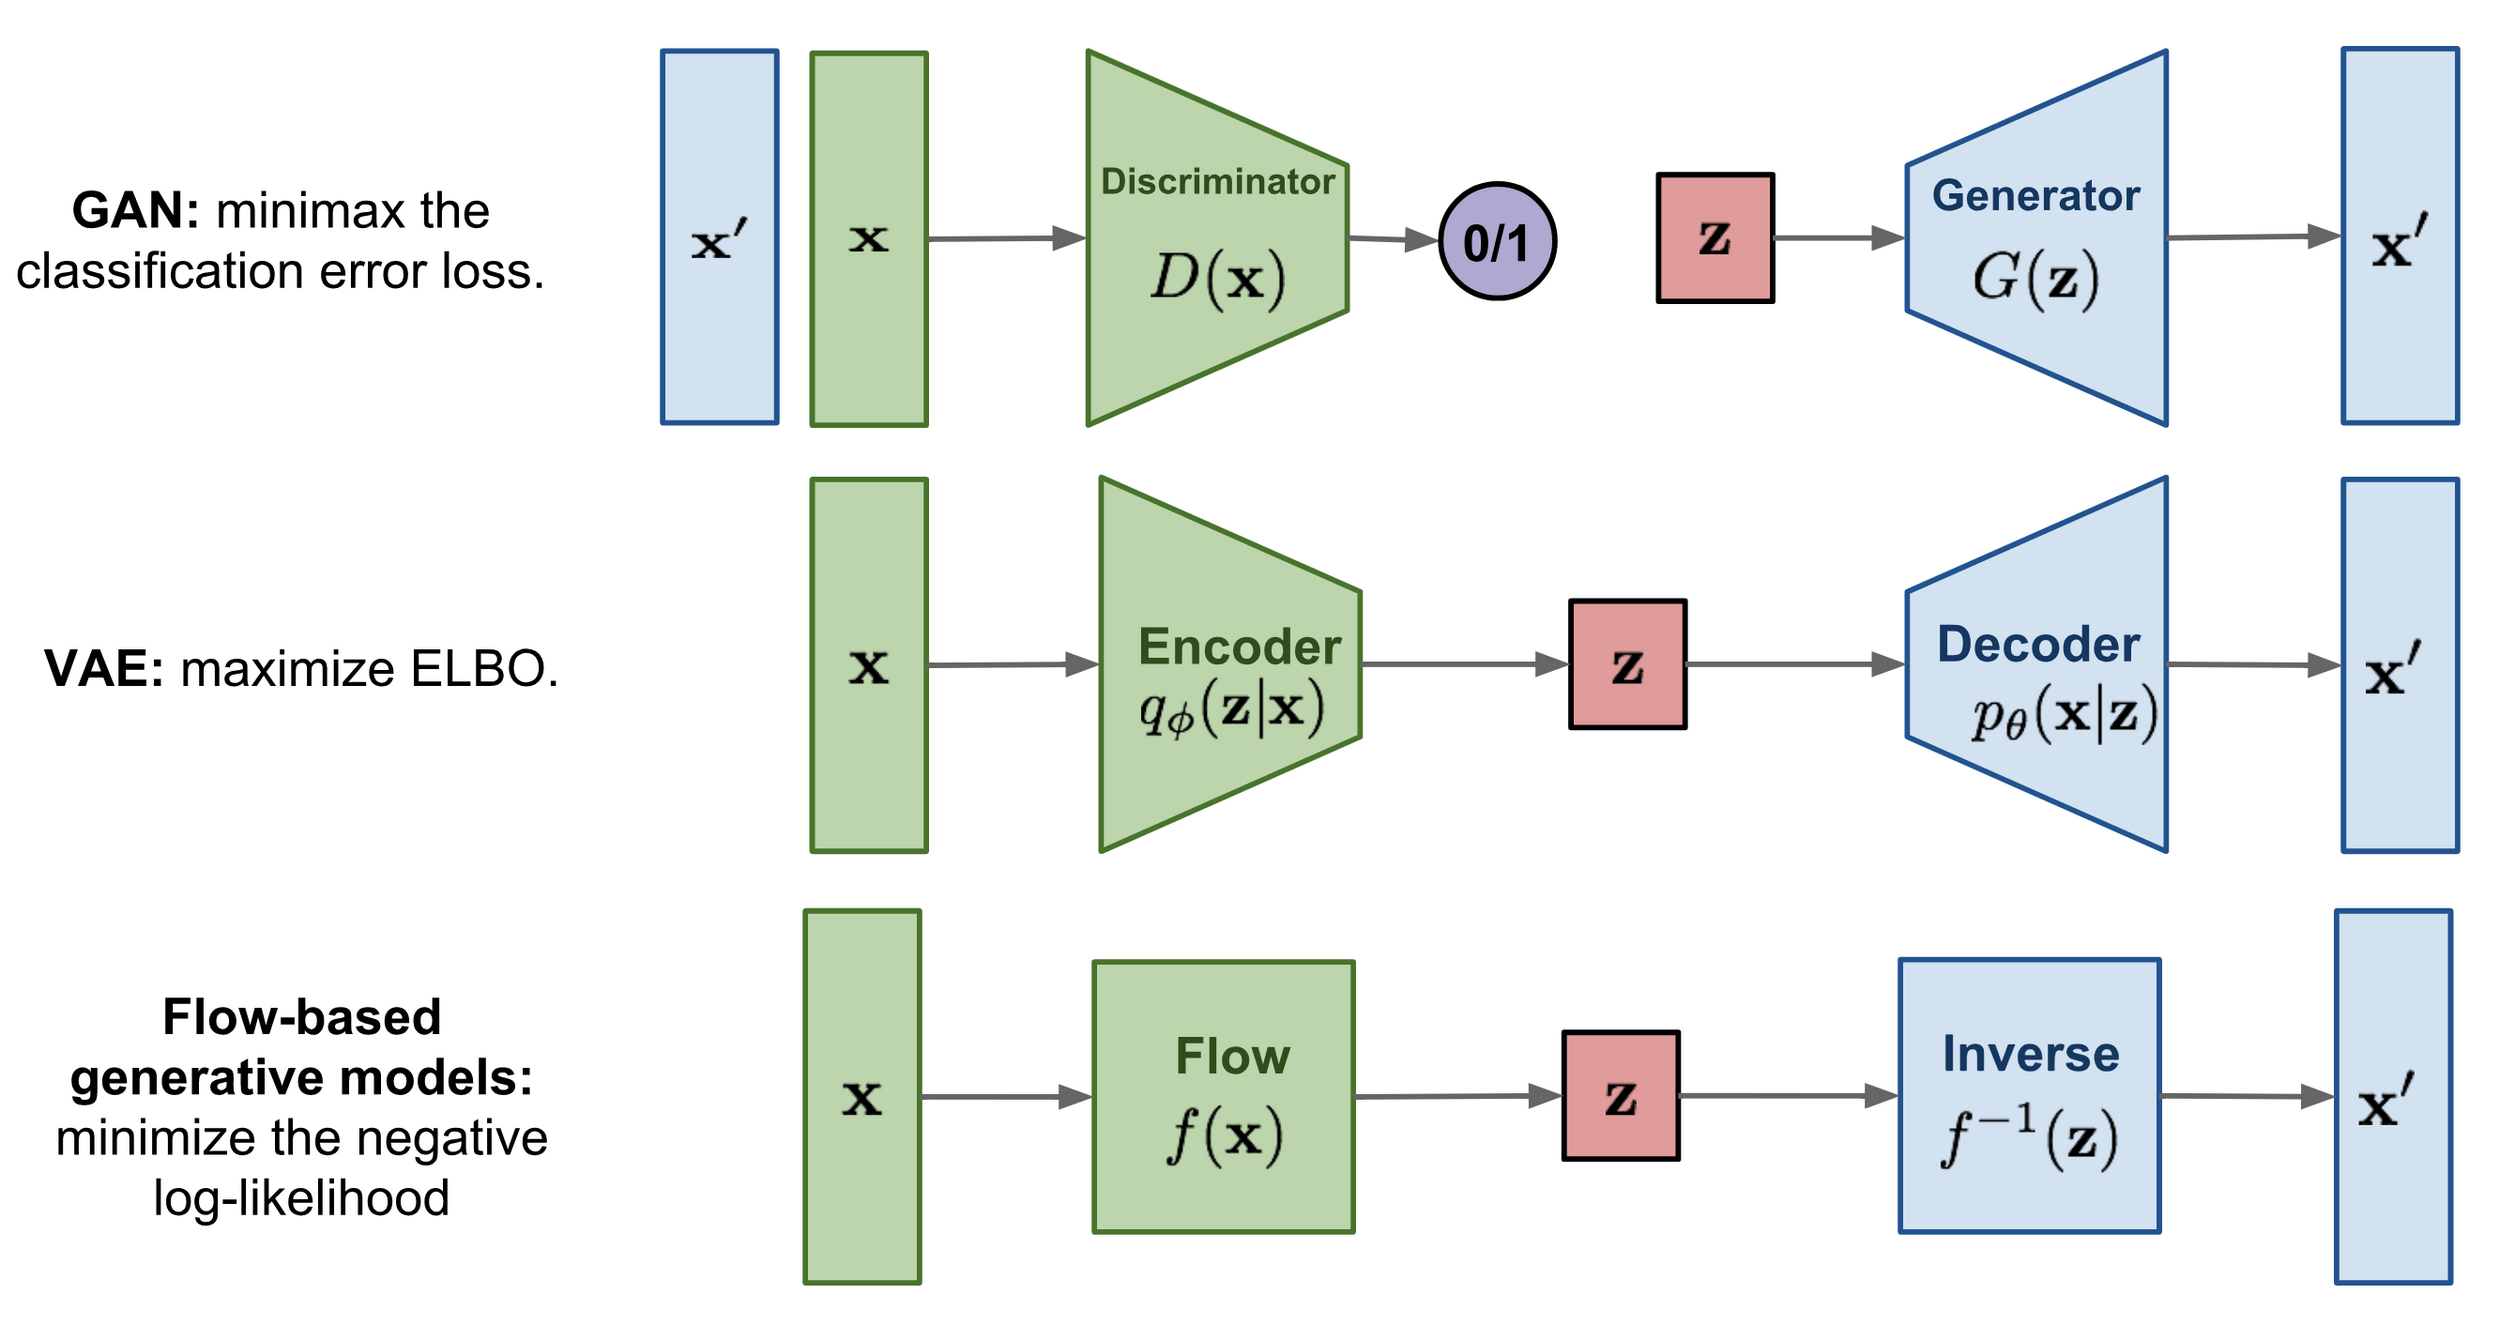
Core Insights: Generative models' ability to perform accurate statistical inference can be understood as manifold learning rather than mere density estimation:
Generative models don't memorize examples, but learn a continuous manifold
where similar concepts lie near each other. Statistical inference becomes
a form of navigation through this learned representation space.
CVAE
Encodes data into latent space, enabling conditional generation
Flow-based
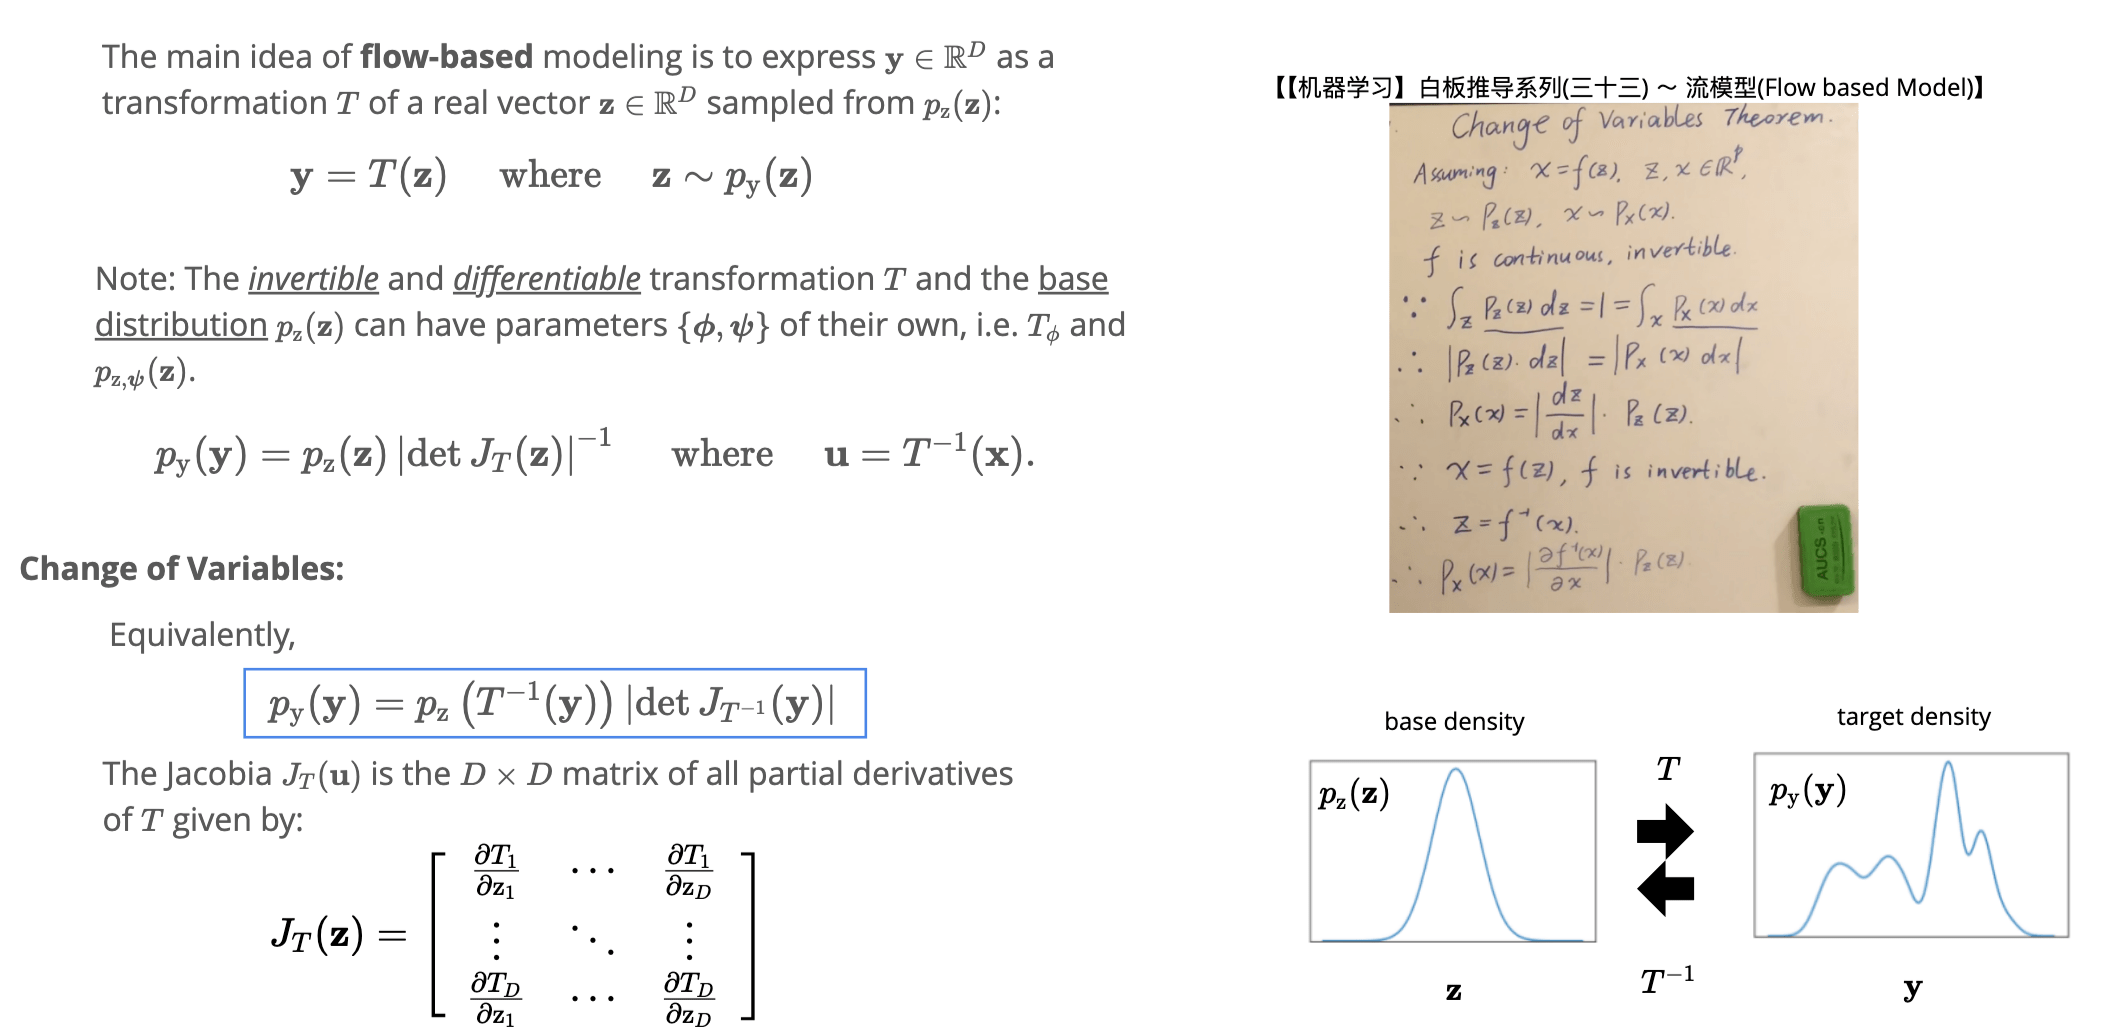
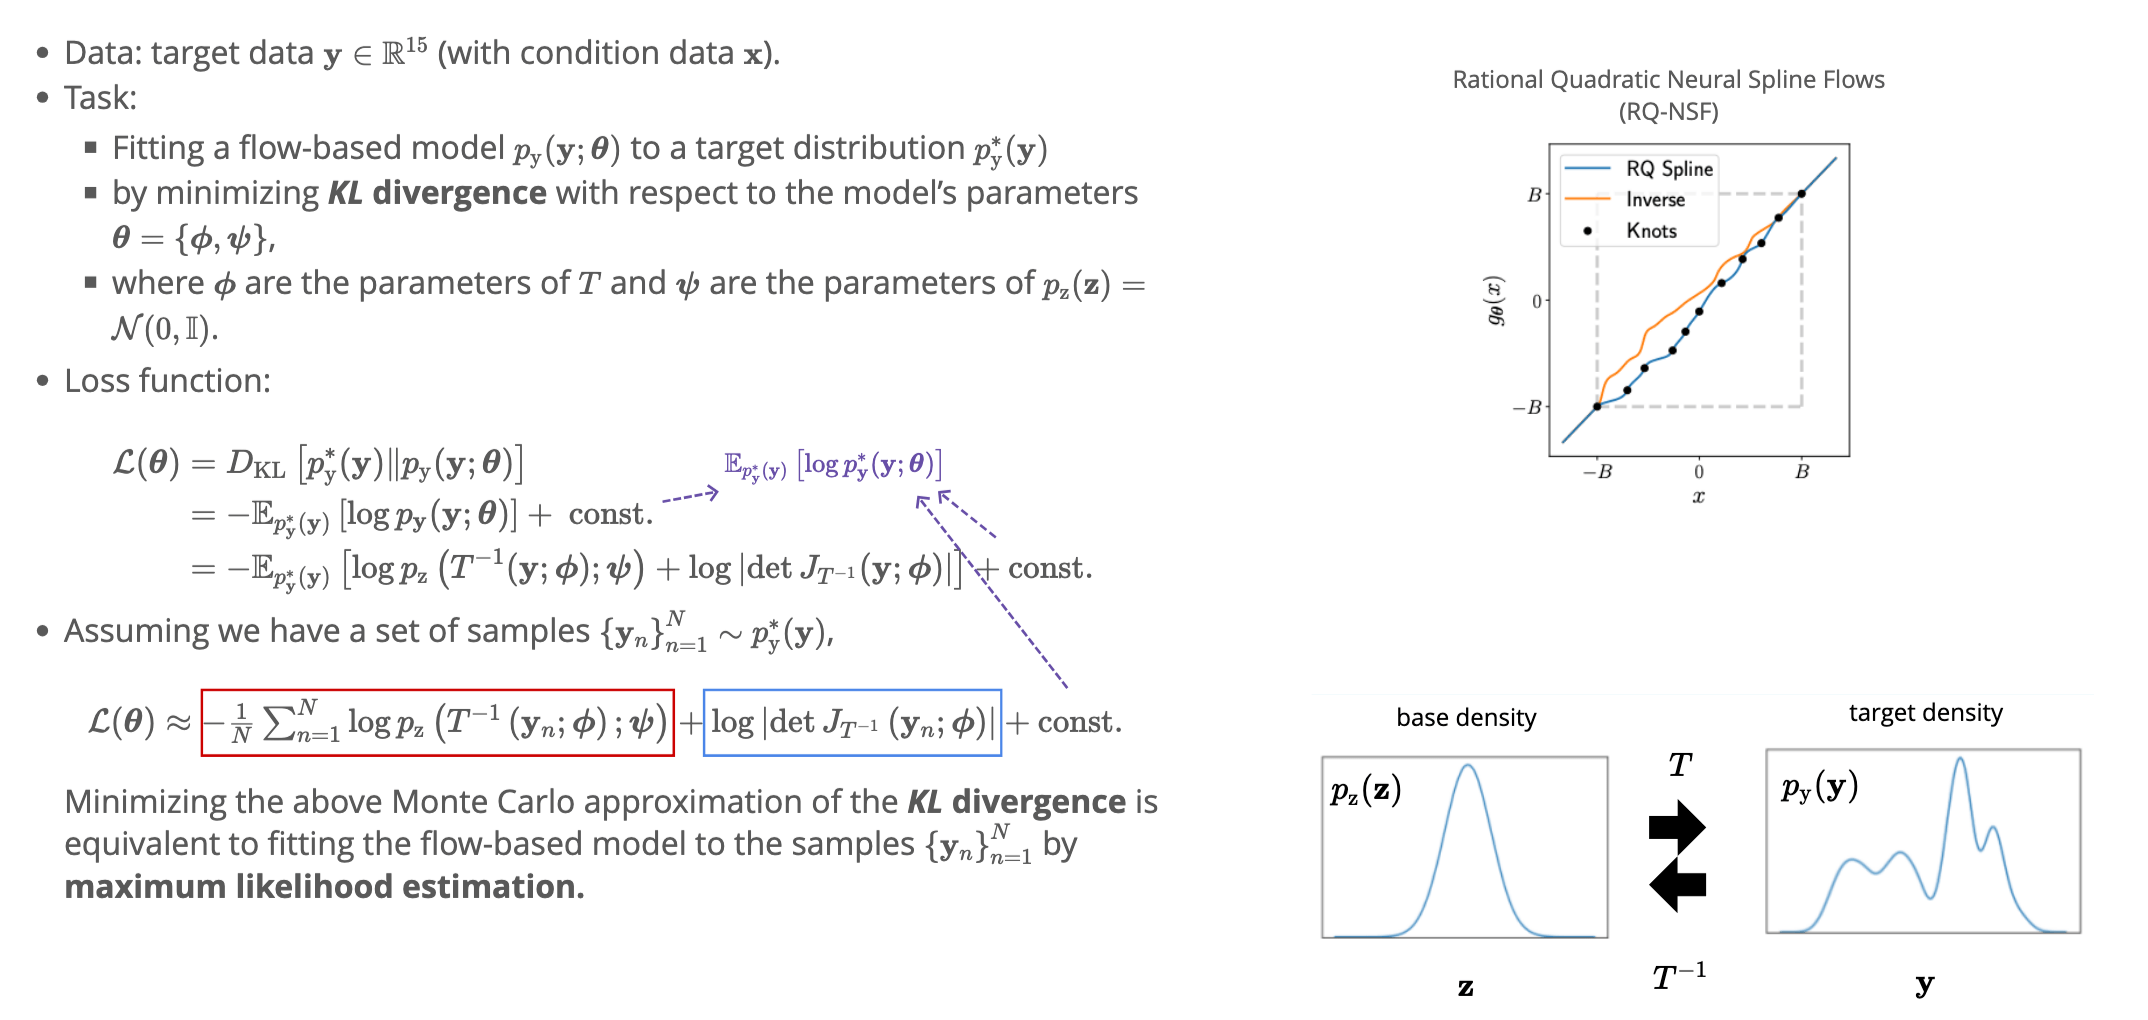
Transforms simple distributions into complex ones via invertible mappings
Interpretable Gravitational Wave Data Analysis with DL and LLMs
hewang@ucas.ac.cn
The core driving force of AI4Sci largely lies in its “interpolation” generalization capabilities, showcasing its powerful complex modeling abilities.
From 李宏毅
Interpretable Gravitational Wave Data Analysis with DL and LLMs
hewang@ucas.ac.cn
The core driving force of AI4Sci largely lies in its “interpolation” generalization capabilities, showcasing its powerful complex modeling abilities.
Interpretable Gravitational Wave Data Analysis with DL and LLMs
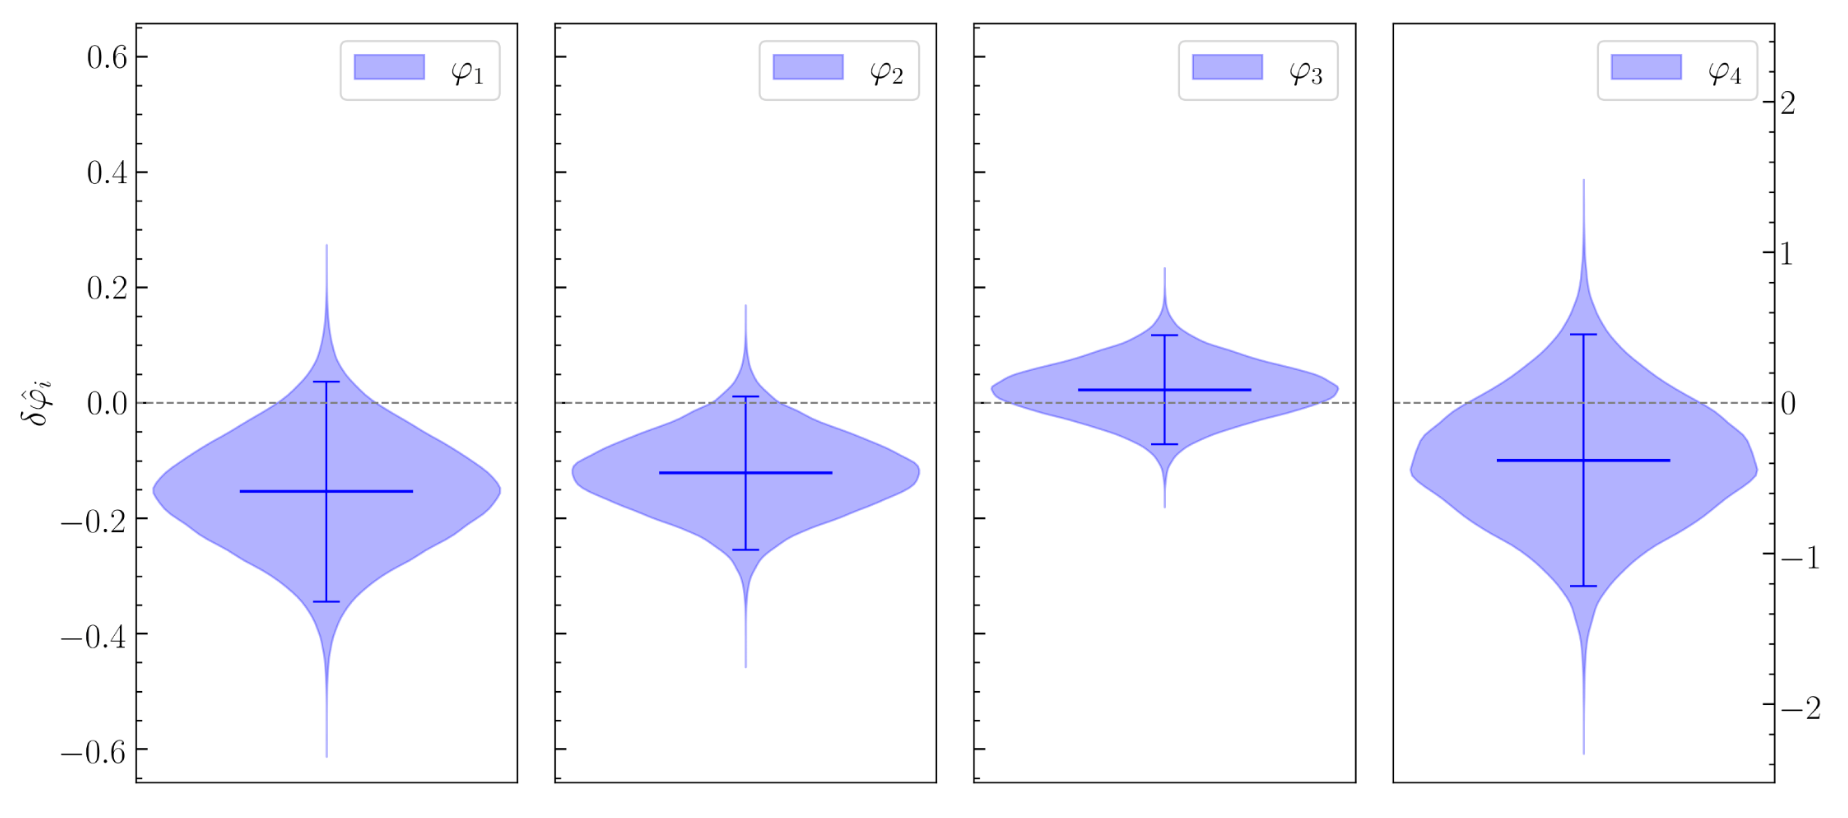
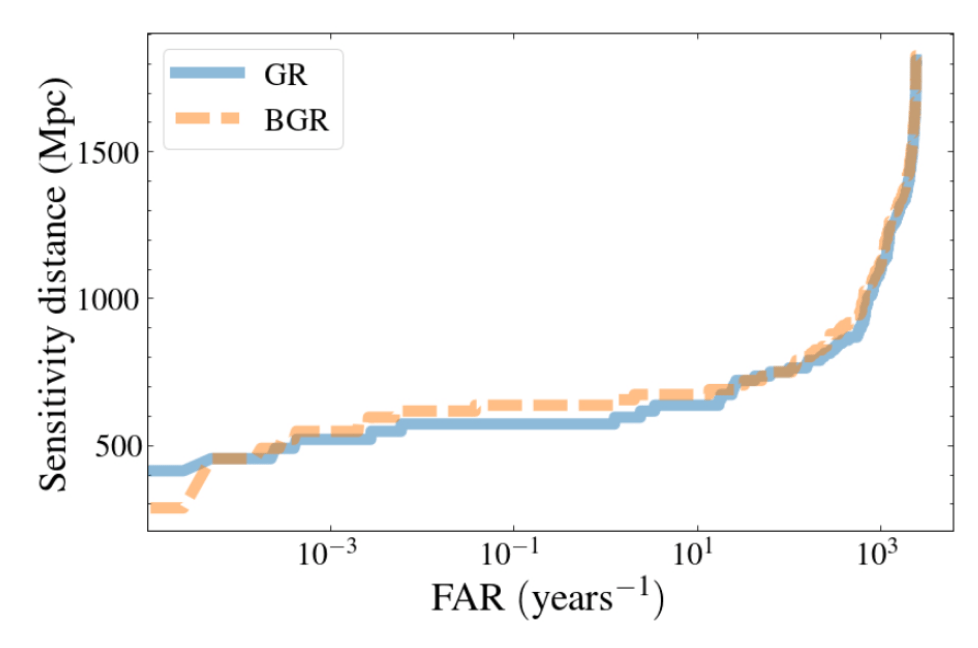
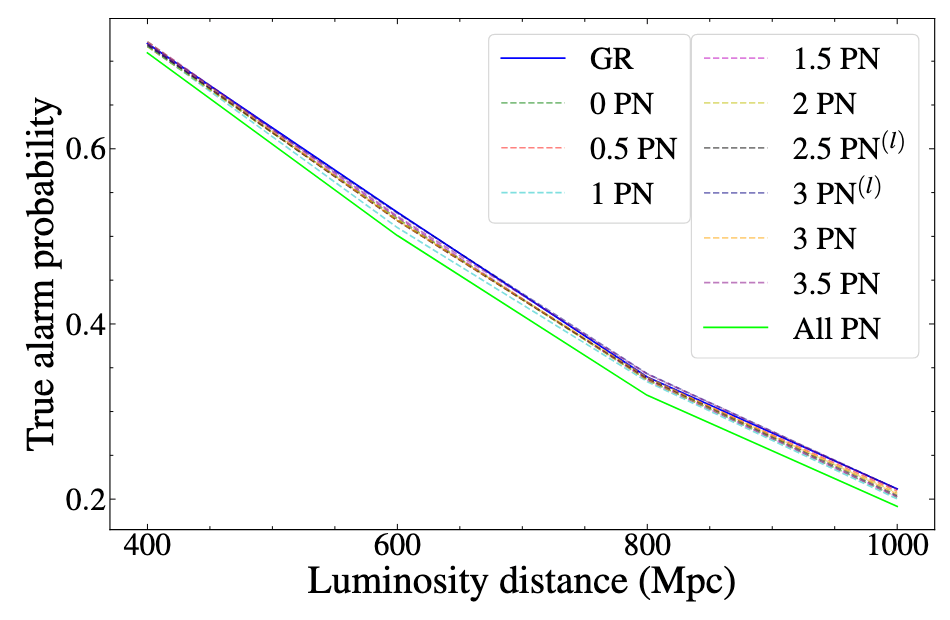
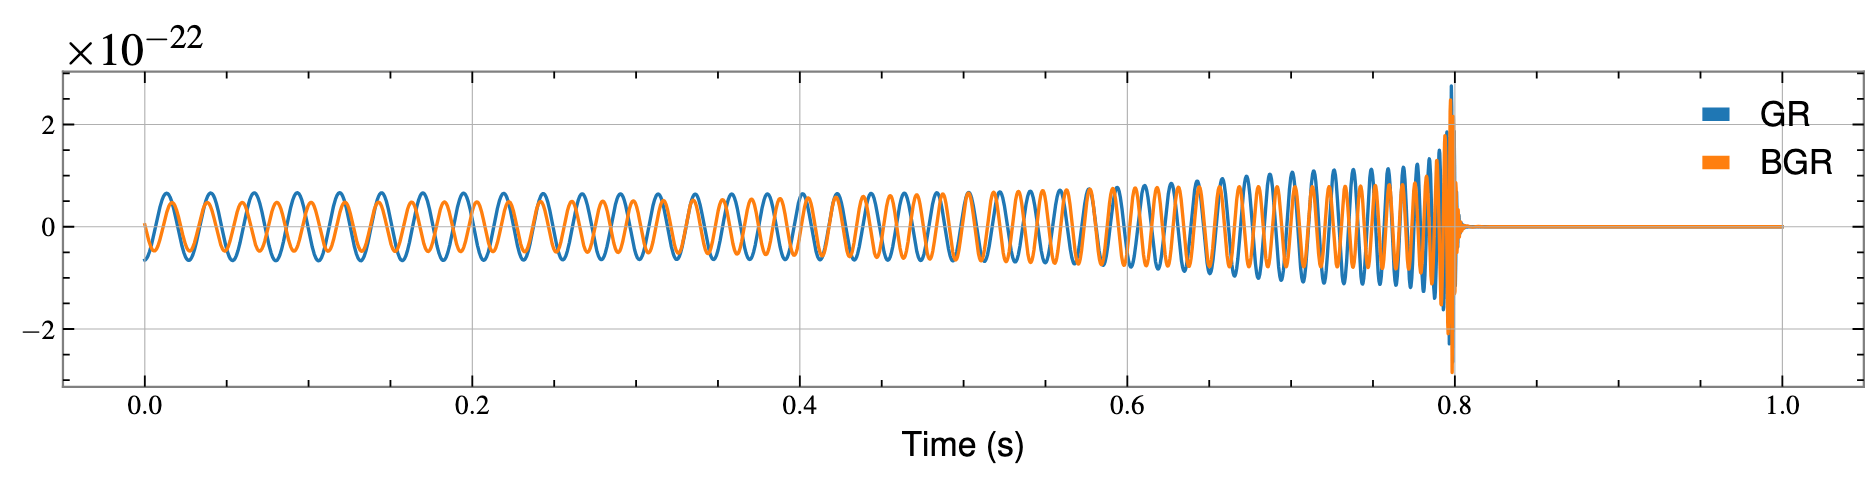
Test of General Relatively
2403.18936
hewang@ucas.ac.cn
2407.07229
2103.01641
By He Wang
2025/07/03 15:00-17:00 @NKU