Multi-output spectral mixture Gaussian processes for lag estimation in multi-wavelength astronomical time series
Shih Ching Fu
shihching.fu@postgrad.curtin.edu.au
Supervisors:
Dr Arash Bahramian, Dr Aloke Phatak,
Dr James Miller-Jones, Dr Suman Rakshit
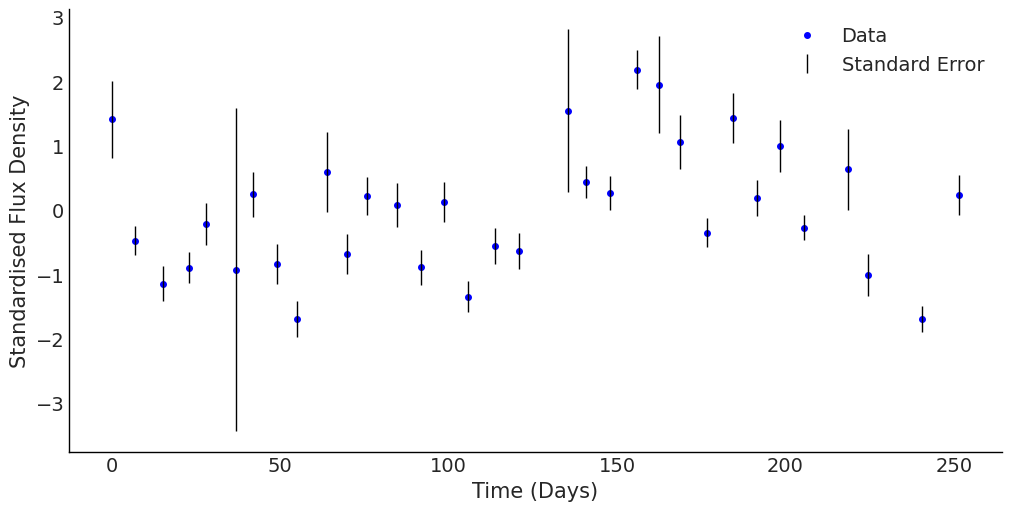
Light Curves
- Light curves are time series data describing the changing brightest of a source over time.
- The shape of a light curve can identify and reveal properties of the underlying object or event.
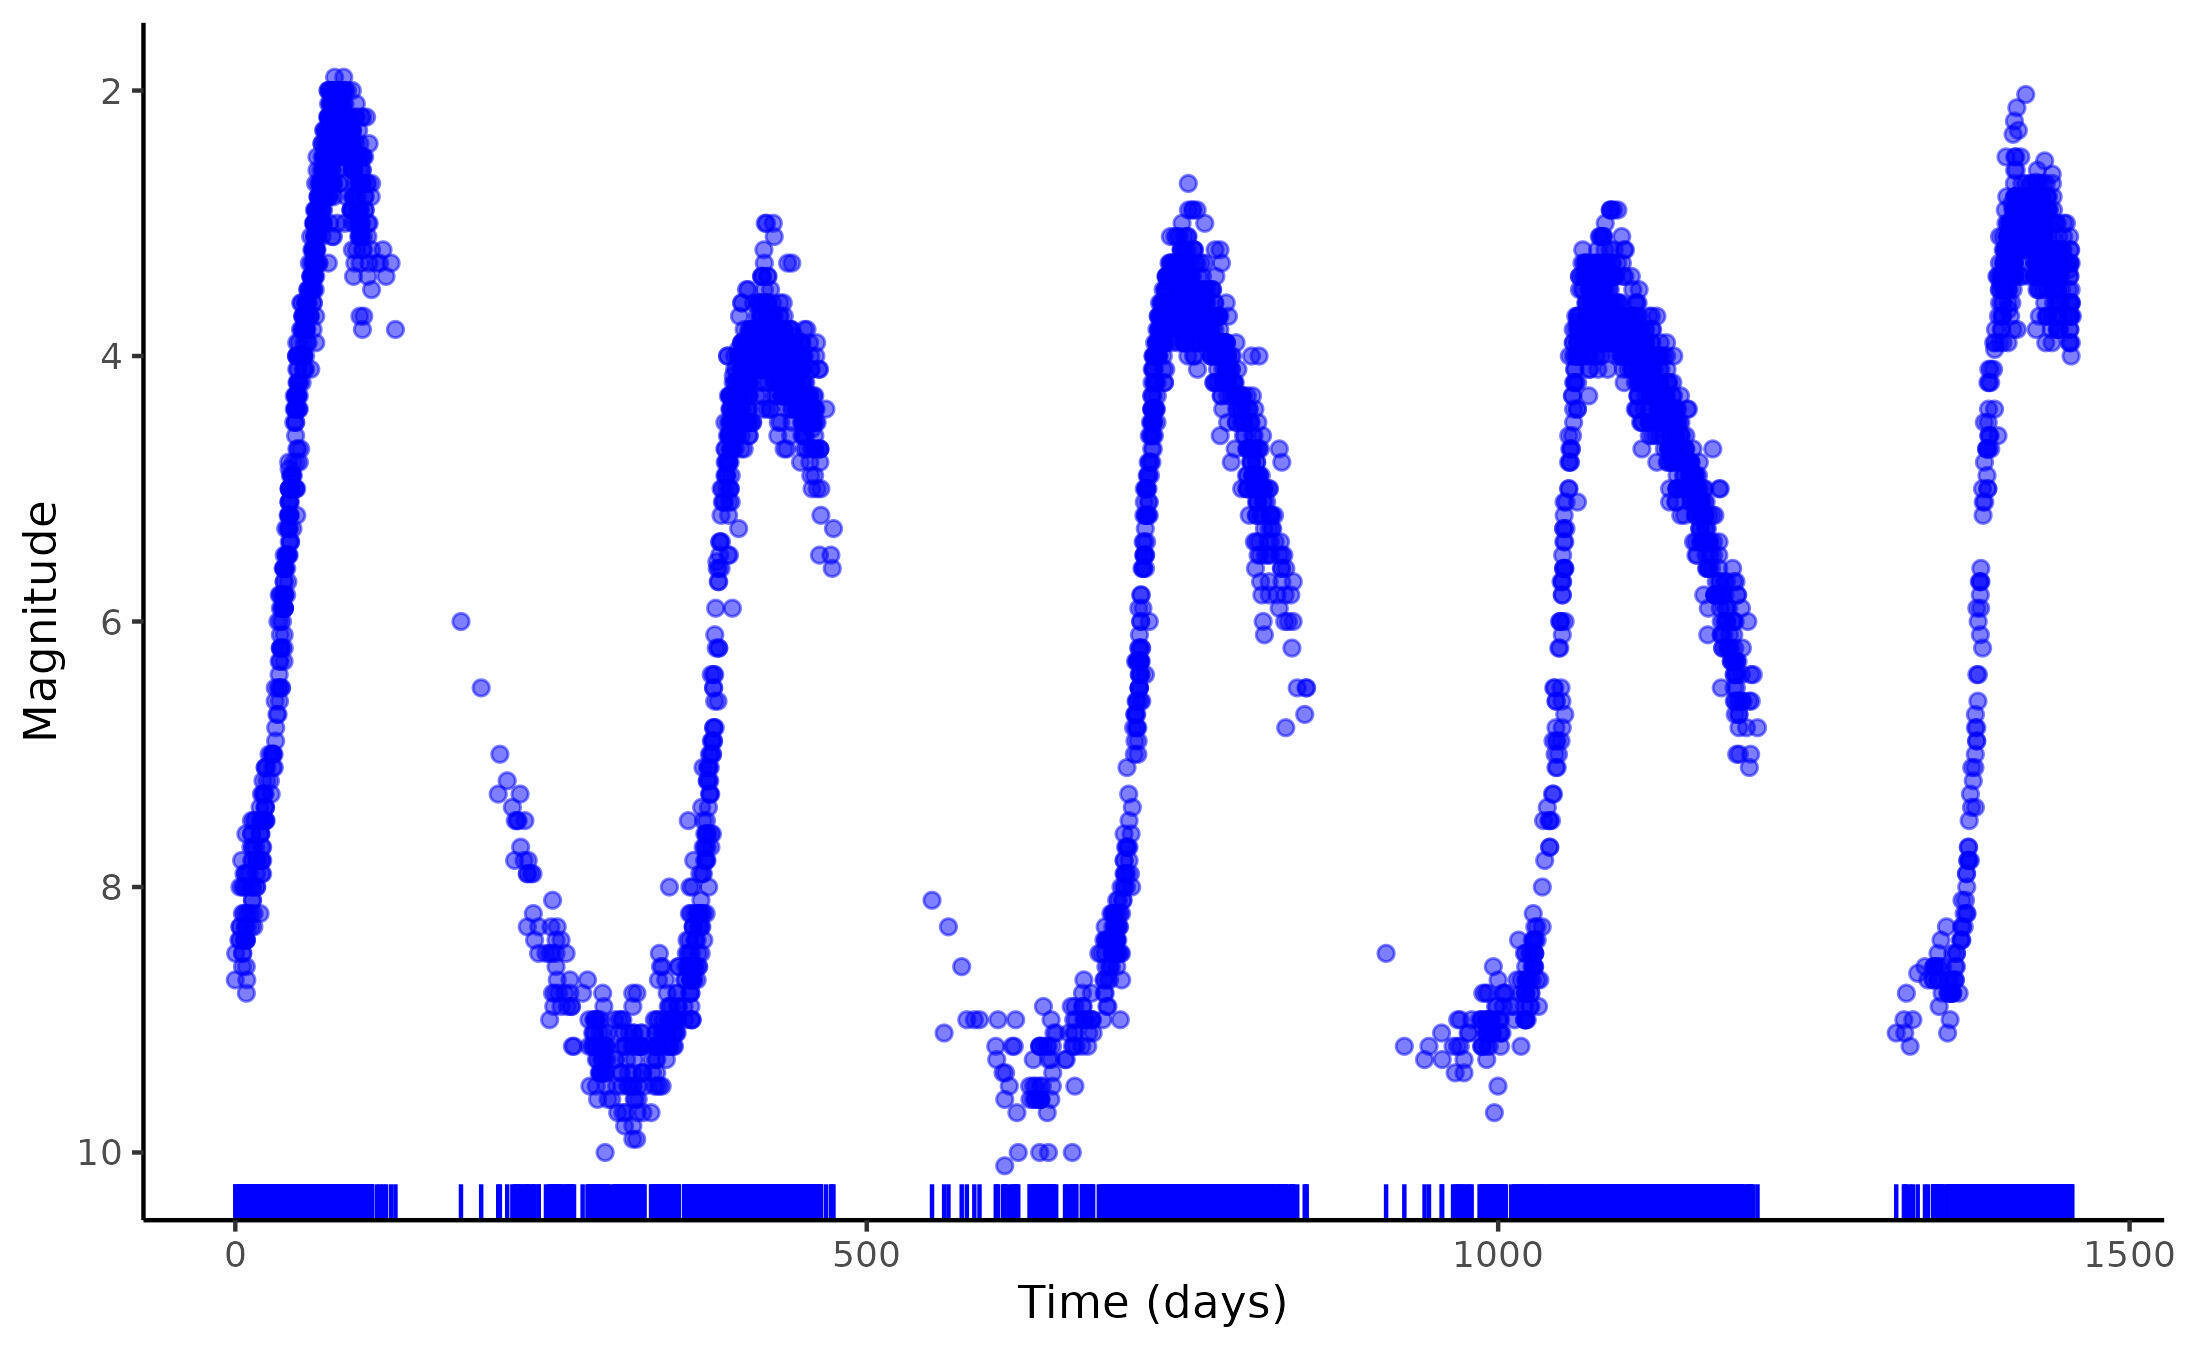
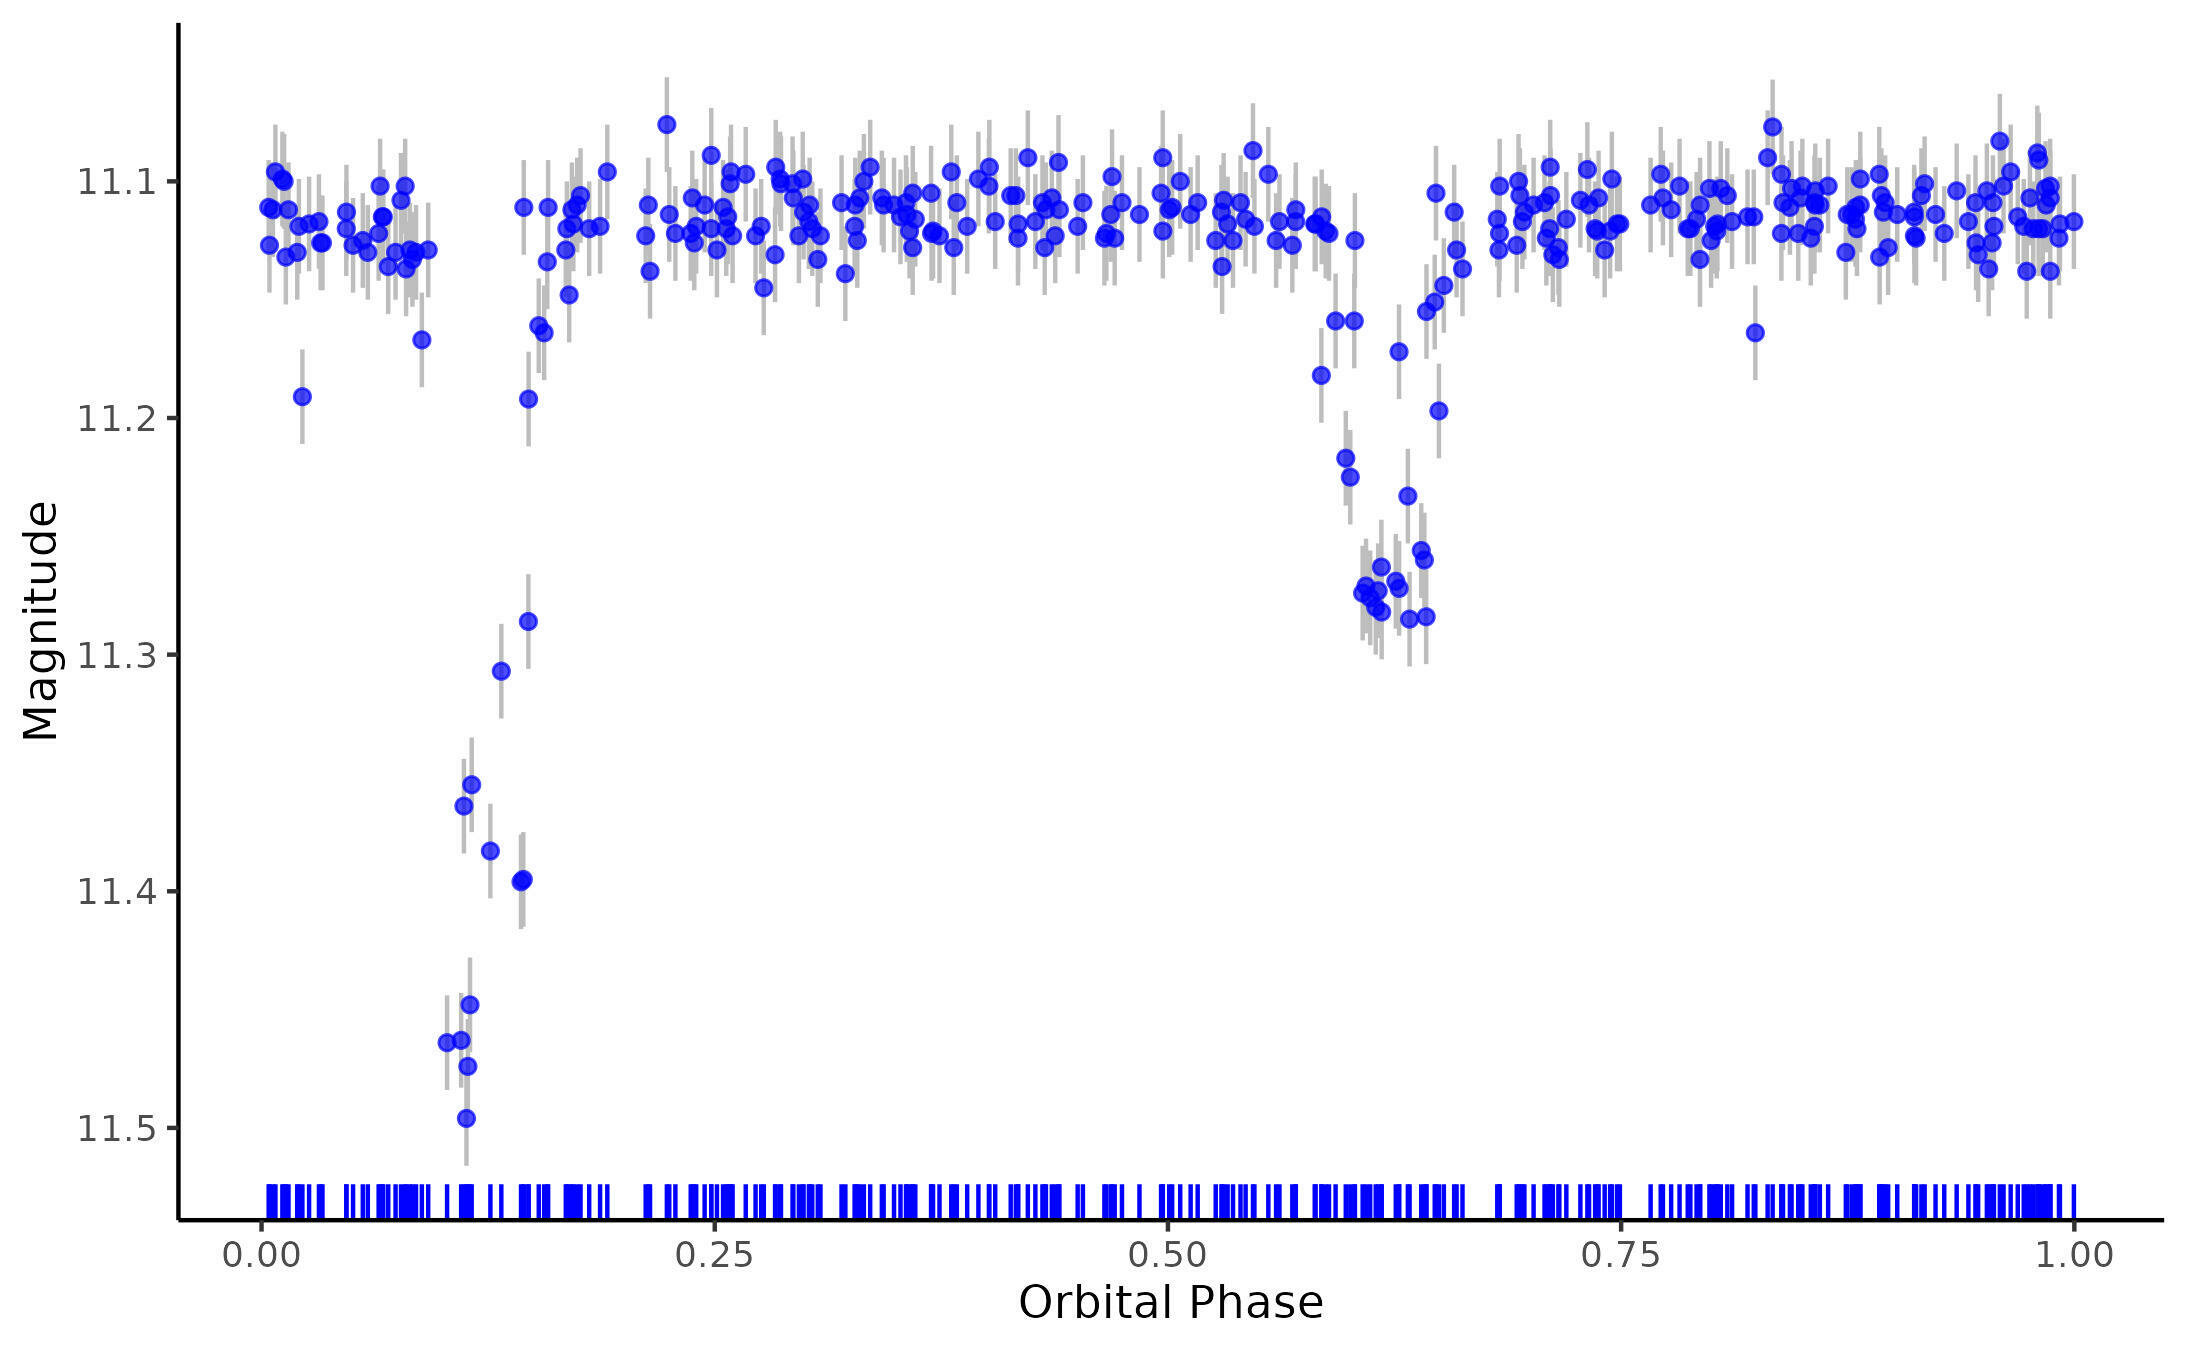
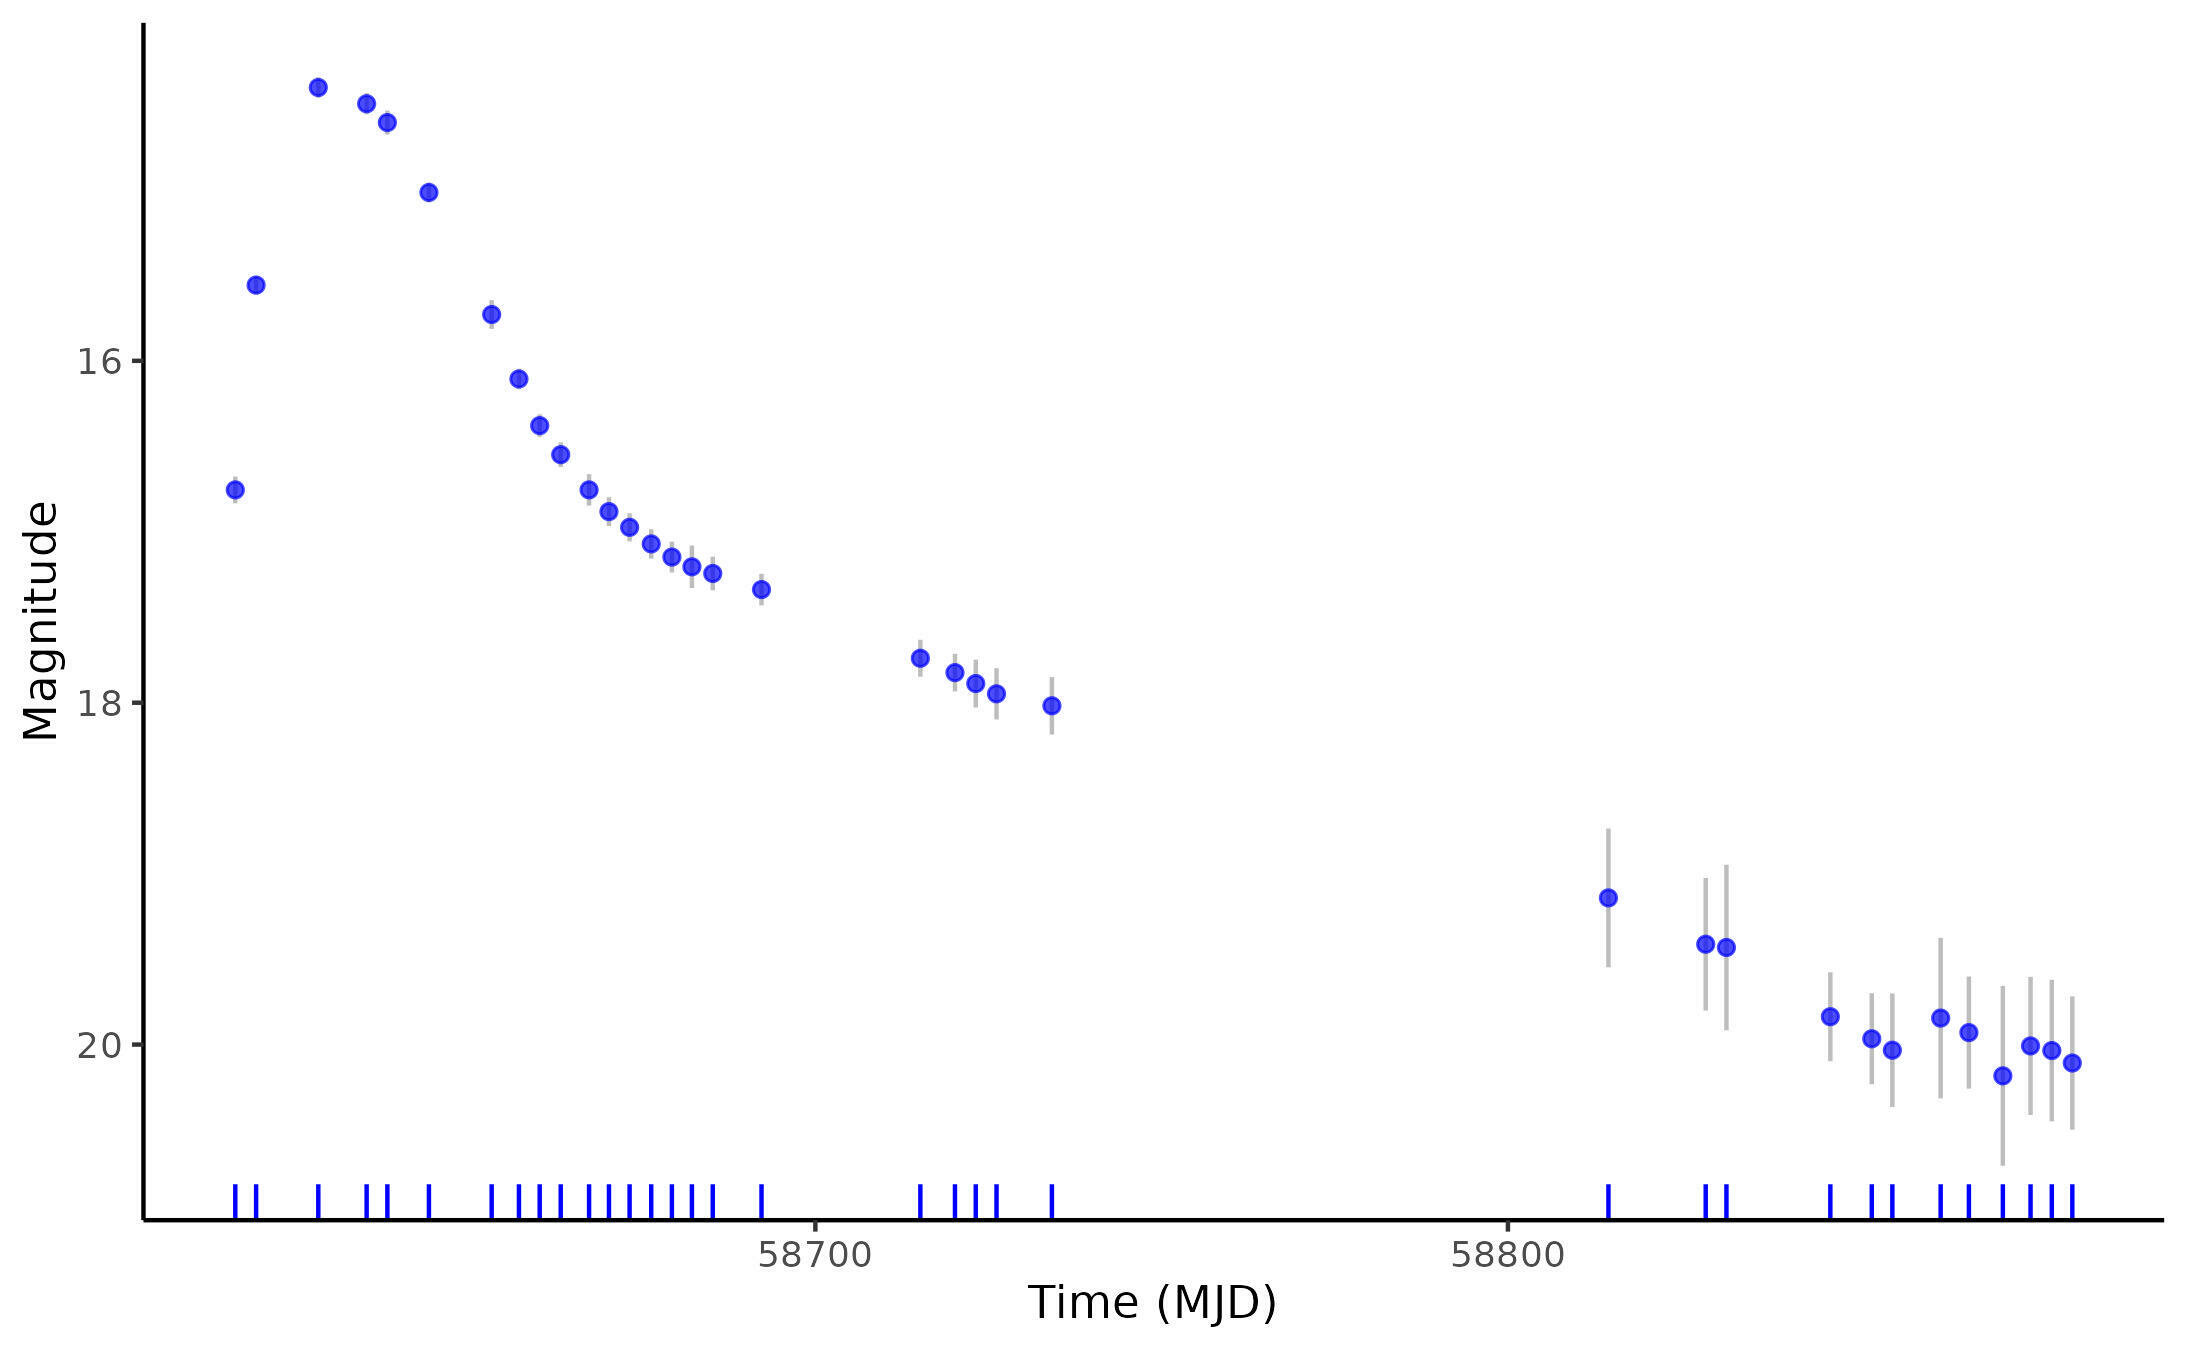
Treat the varying brightness of a source as a stochastic process
Magnitude
Magnitude
Magnitude
Time (days)
Orbital Phase
Time (MJD)
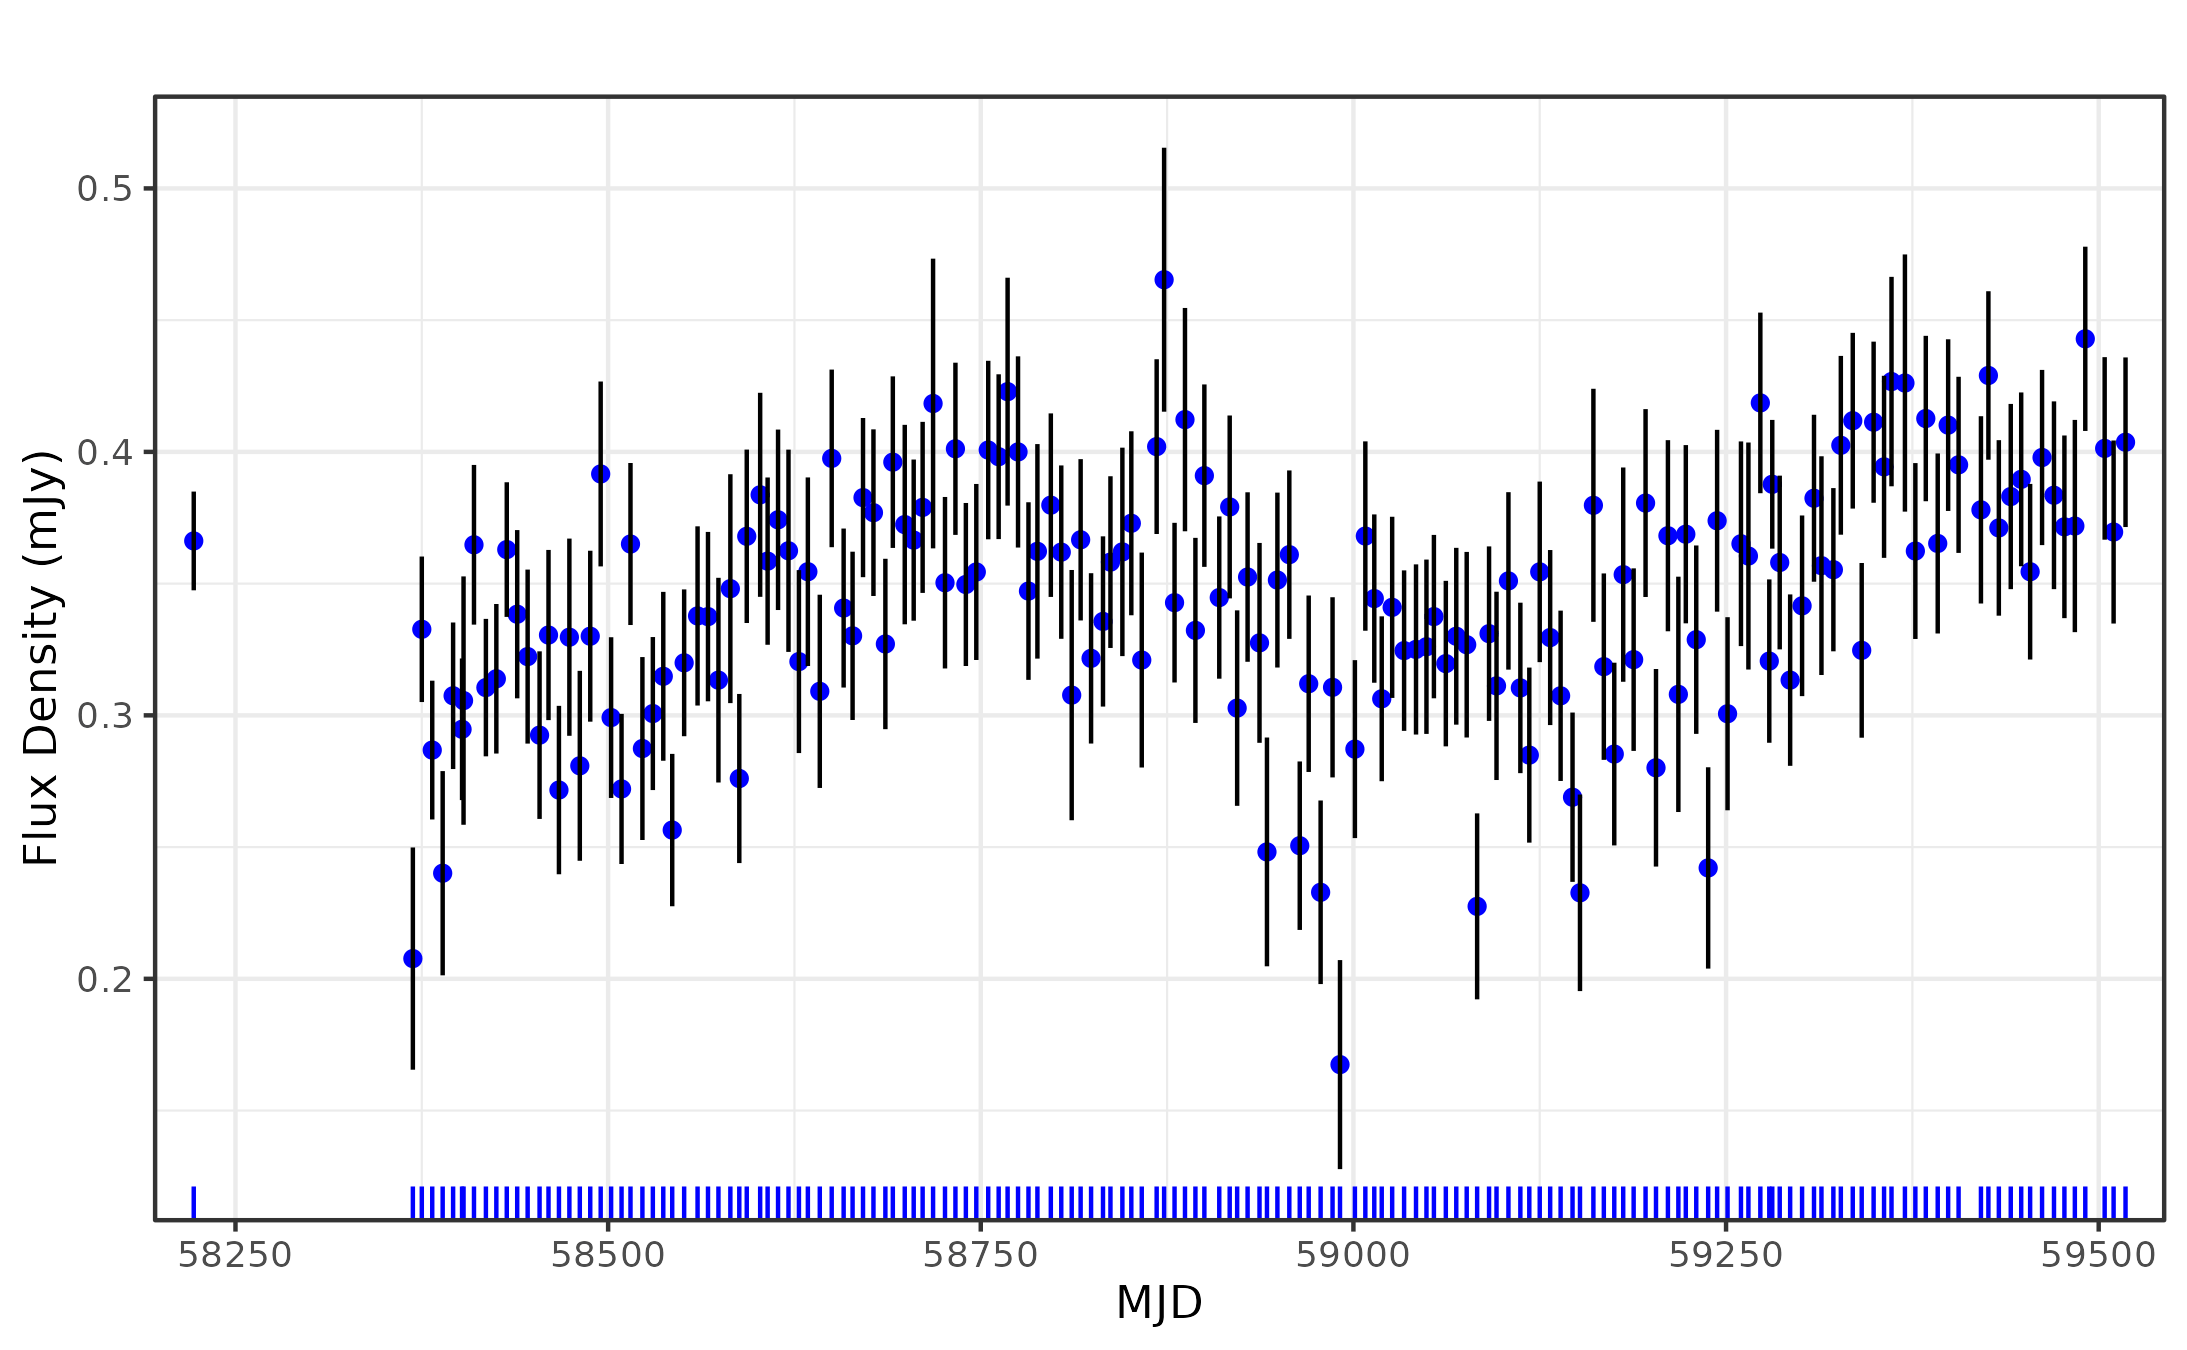
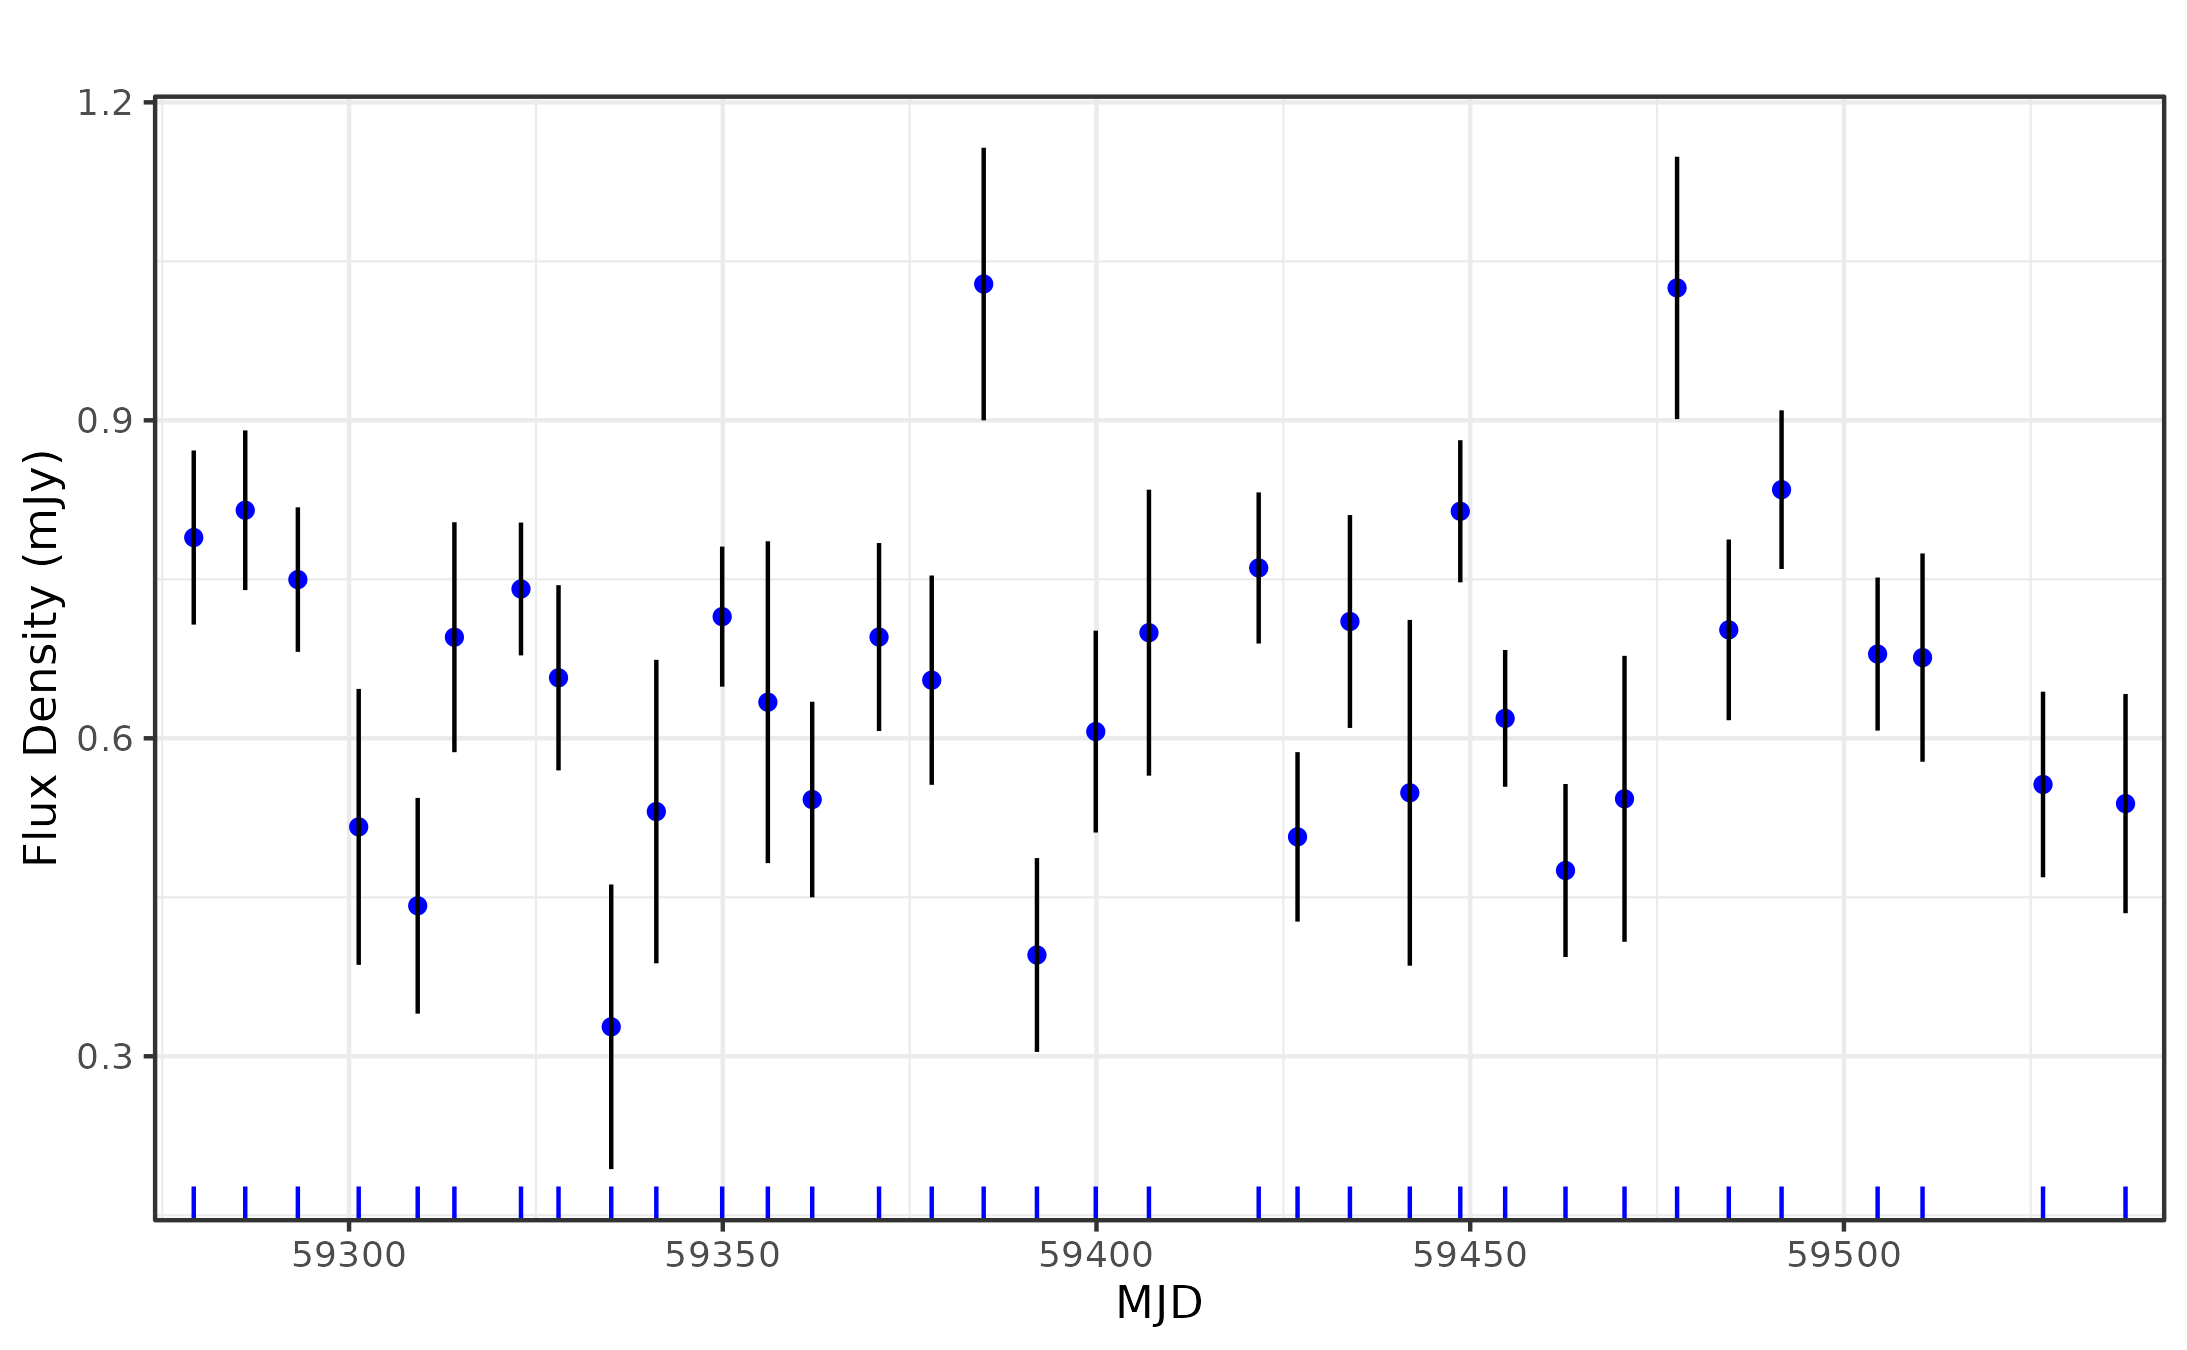
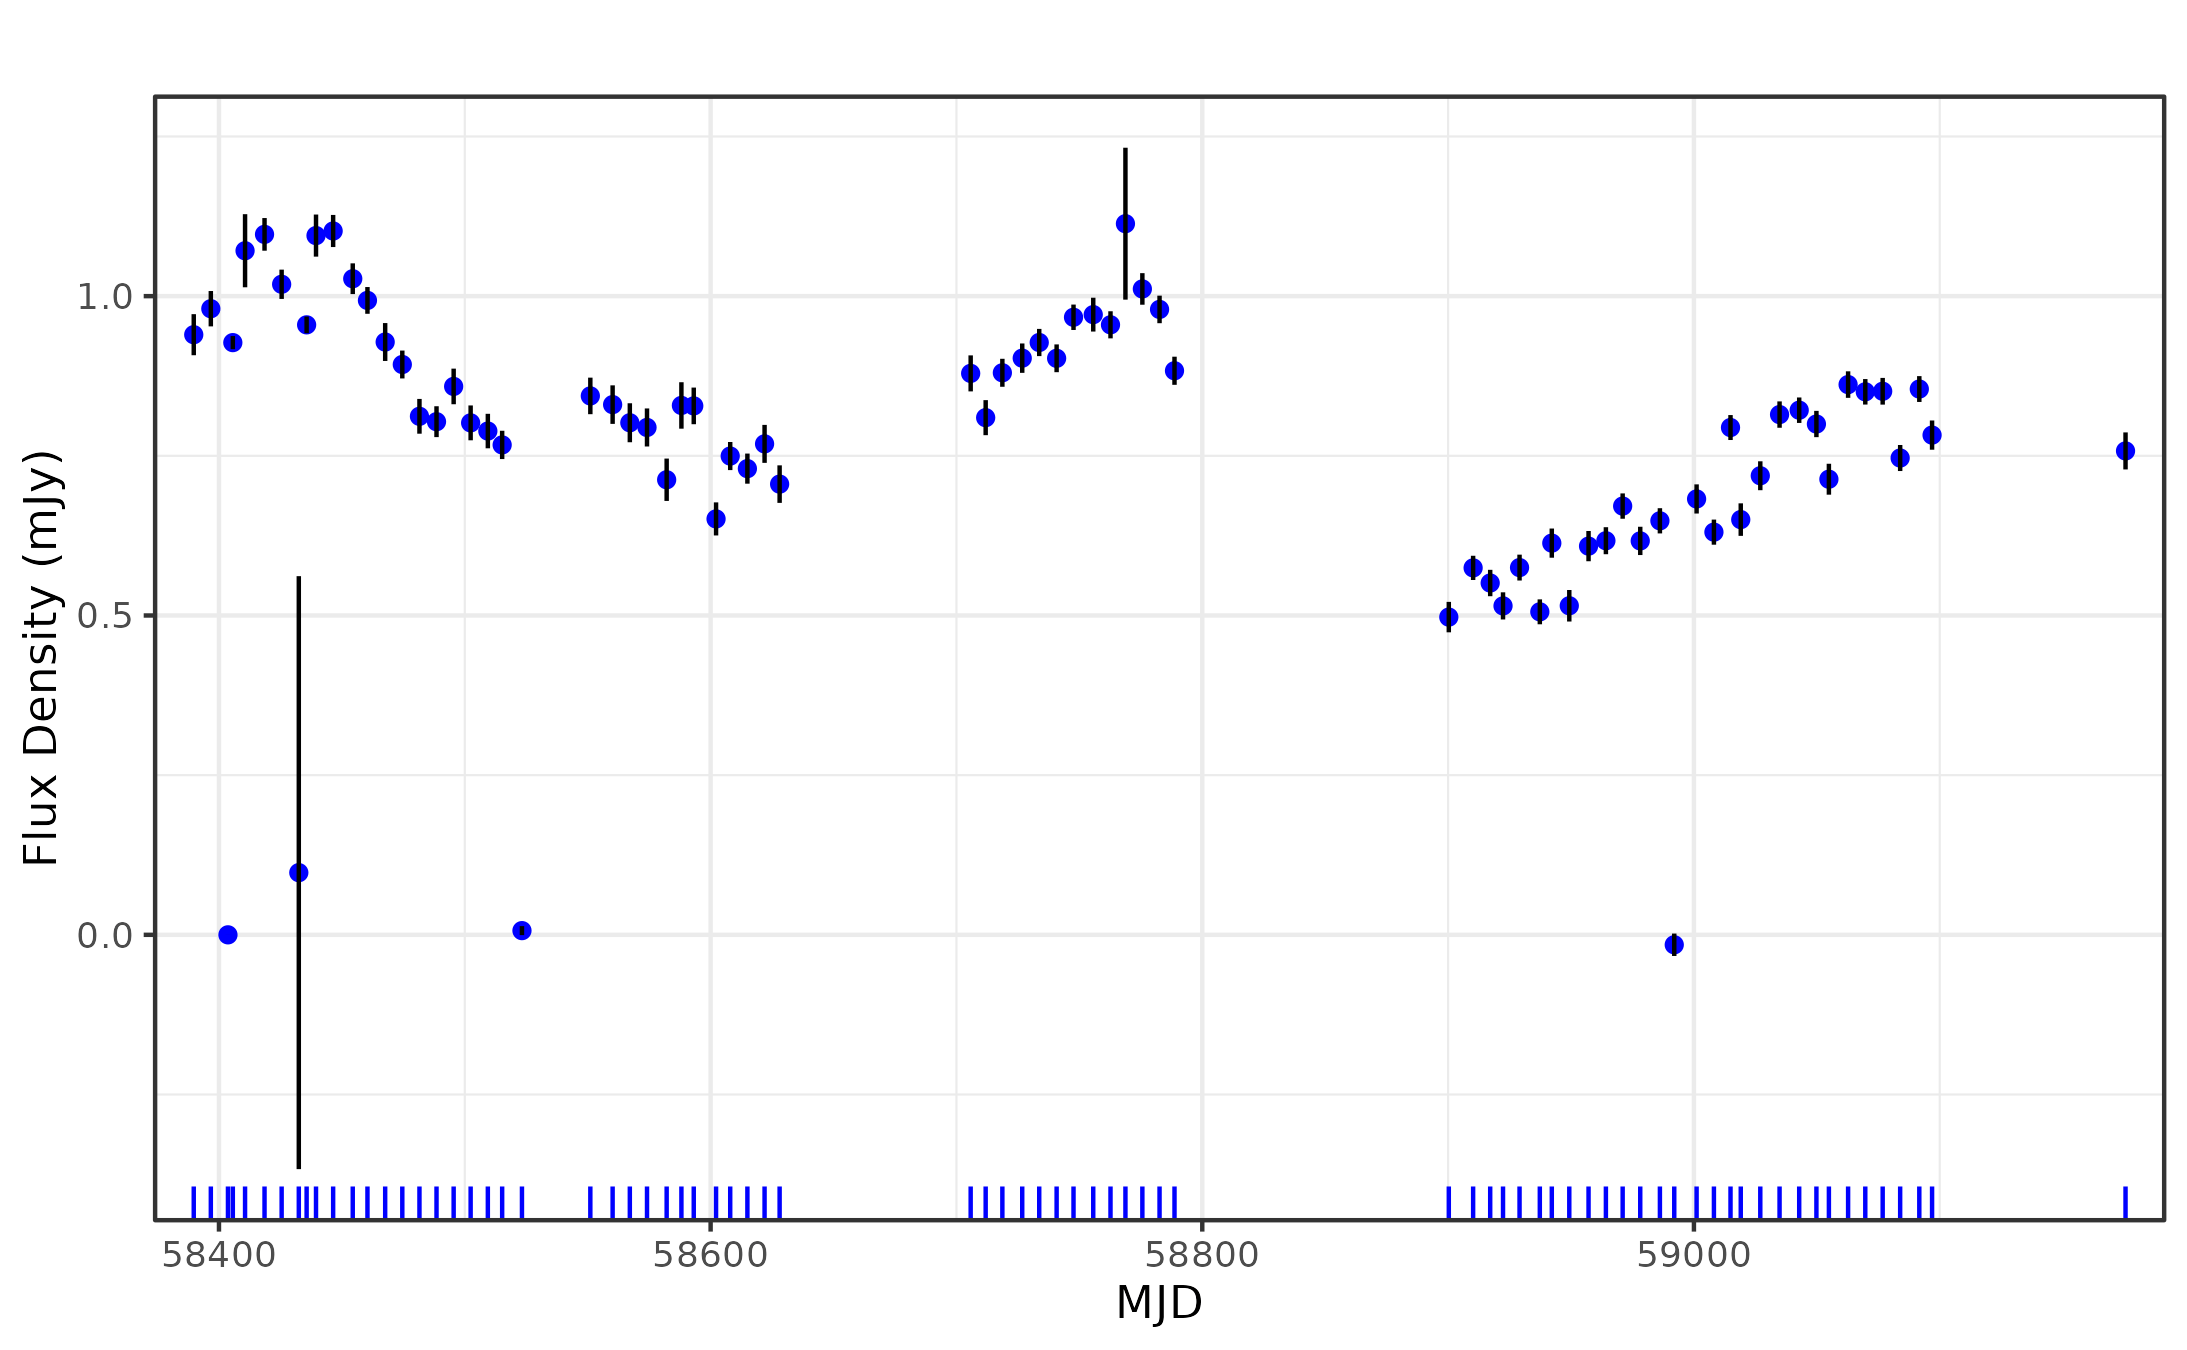
Heterogeneous Data
- Different cadences
- Sparse observations
- Uneven sampling rates
- Varying noise levels
Multivariate Normal
Y is a vector of n Gaussian distributed random variables.
\begin{bmatrix}
Y_1 \\
\vdots \\
Y_n
\end{bmatrix} \sim \mathcal{N}_n (\boldsymbol{\mu}, \boldsymbol{\Sigma}_{n \times n})
\boldsymbol{\Sigma}_{n \times n} =
\begin{bmatrix}
\Sigma_{11} & \dots & \Sigma_{1n} \\
\vdots & \ddots & \vdots \\
\Sigma_{n1} & \dots & \Sigma_{nn}
\end{bmatrix}
where \(\boldsymbol\mu = (\mu_1, \dots, \mu_n)\) and \(\boldsymbol{\Sigma}\) is a \(n \times n \) covariance matrix.
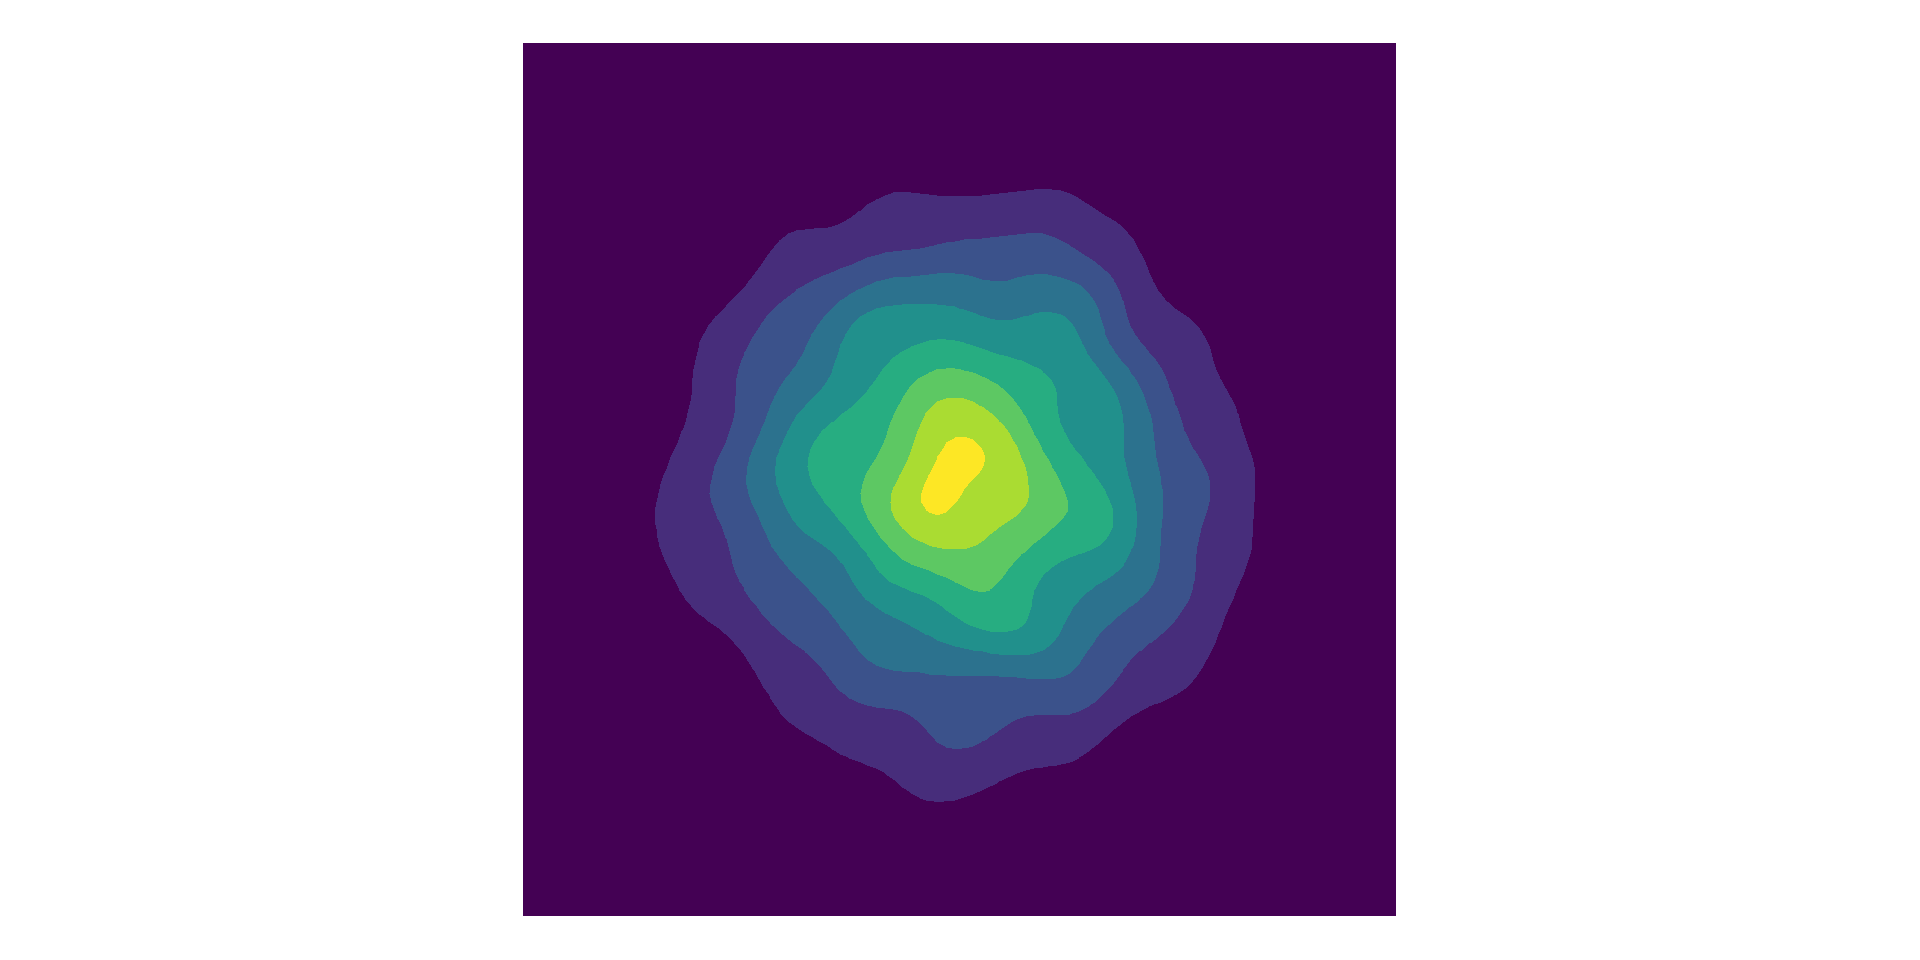
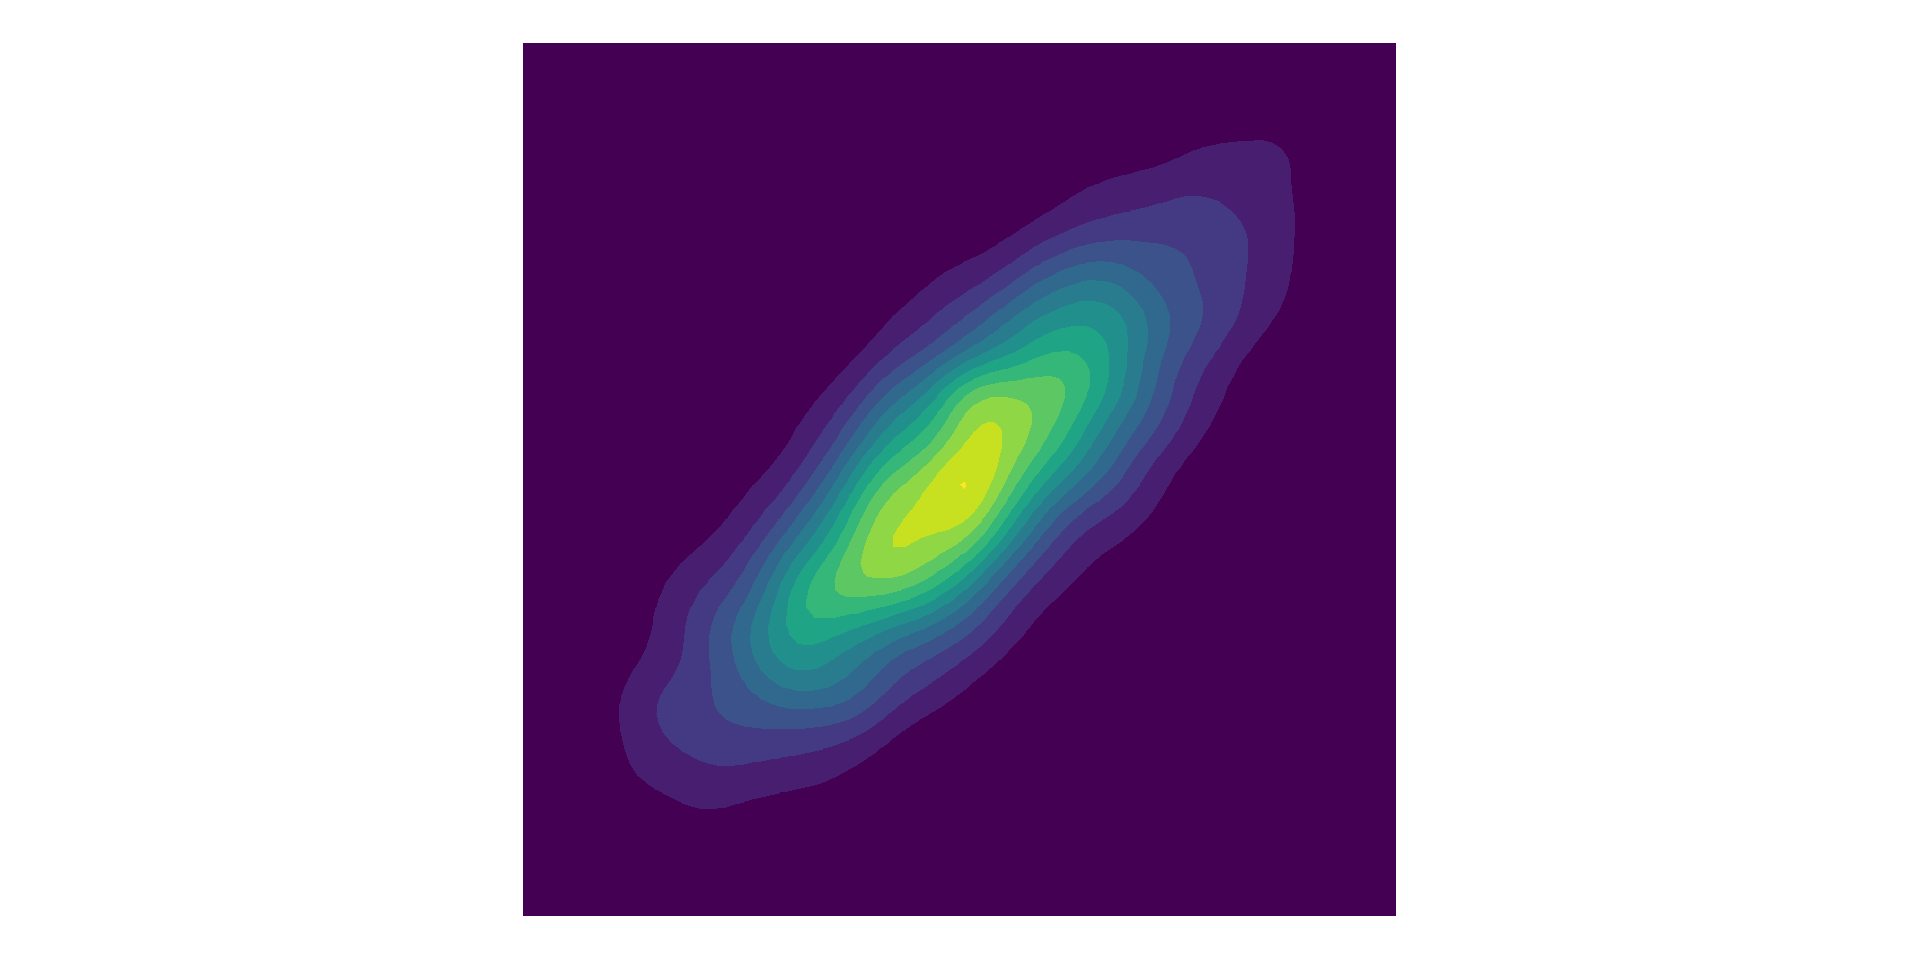
\mathbf{\Sigma} =
\begin{bmatrix}
1 & 0 \\
0 & 1
\end{bmatrix}
\mathbf{\Sigma} =
\begin{bmatrix}
1 & 0.8 \\
0.8 & 1
\end{bmatrix}
- Symmetric, positive semi-definite matrix.
- Linear combinations are also valid covariance matrices.
Gaussian Processes (GPs)
Extend multivariate Gaussian to 'infinite' dimensions.
- Mean function, \(\mu(t)\)
- Covariance or kernel function, \( \kappa(t,t'; \boldsymbol{\theta}) \)
\begin{bmatrix}
Y_1 \\
Y_2 \\
\vdots \\
\end{bmatrix} \sim \mathcal{GP} (\mu(t), \boldsymbol{K})
where \(\mu = \mu(t)\) and \( K_{ij} = \kappa(t_i, t_j; \boldsymbol{\theta}) \), for \( i,j = 1, 2, \dots \)
Rather than specify a fixed covariance matrix with fixed dimensions, compute covariances using the kernel function.
\boldsymbol{K} =
\begin{bmatrix}
K_{11} & \dots & K_{1.} \\
\vdots & \ddots & \vdots \\
K_{.1} & \dots & K_{..}
\end{bmatrix}
Gaussian Process Regression
f(\boldsymbol{x}) \sim \mathcal{GP}(\boldsymbol{0}, \kappa(\boldsymbol{x}, \boldsymbol{x}'; \boldsymbol{\theta}))
y(\boldsymbol{x}_i) = f(\boldsymbol{x}_i) + \varepsilon_i
\varepsilon_i \sim \mathcal{N}(0, \sigma^2)
\begin{bmatrix}
y(\boldsymbol{x}_1)\\
\vdots \\
y(\boldsymbol{x}_n)
\end{bmatrix} \sim \mathcal{N}\left(\begin{bmatrix}0\\ \vdots \\ 0 \end{bmatrix},
\begin{bmatrix}
\kappa(\boldsymbol{x}_1, \boldsymbol{x}_1) & \dots & \kappa(\boldsymbol{x}_1, \boldsymbol{x}_n) \\
\vdots & \ddots & \vdots \\
\kappa(\boldsymbol{x}_n, \boldsymbol{x}_1) & \dots & \kappa(\boldsymbol{x}_n, \boldsymbol{x}_n)
\end{bmatrix} + \sigma^2
\begin{bmatrix}
1 & \dots & 0 \\
\vdots & \ddots & \vdots \\
0 & \dots & 1
\end{bmatrix}\right)
\boldsymbol{y} \sim \mathcal{N}(\boldsymbol{0}, \boldsymbol{K} + \sigma^2 \boldsymbol{I})
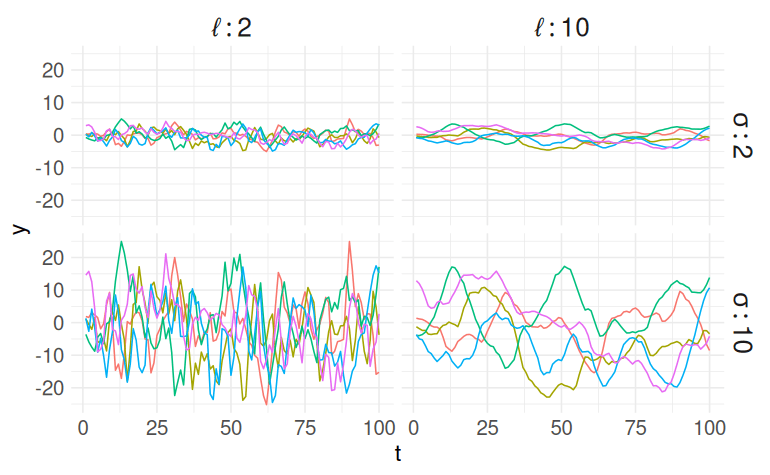
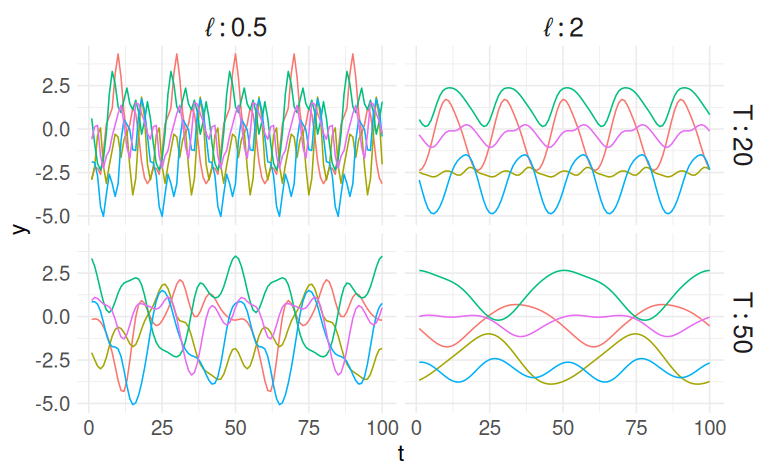
Kernel Functions
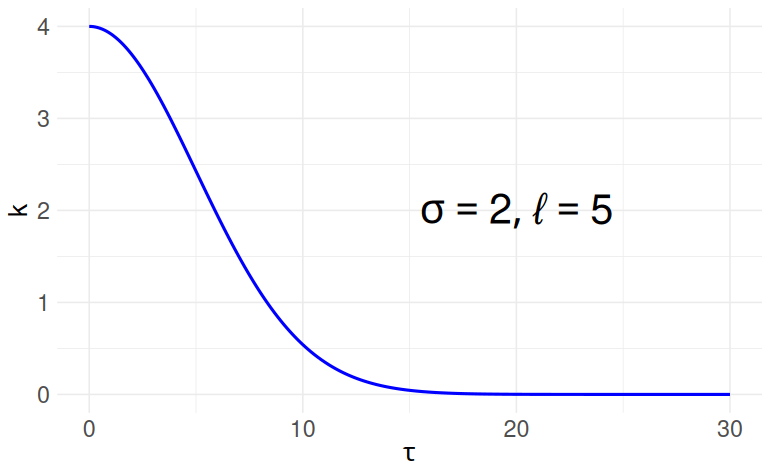
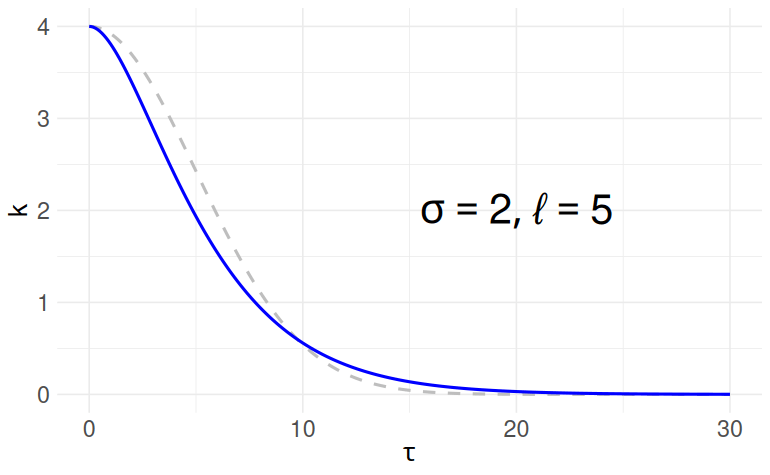
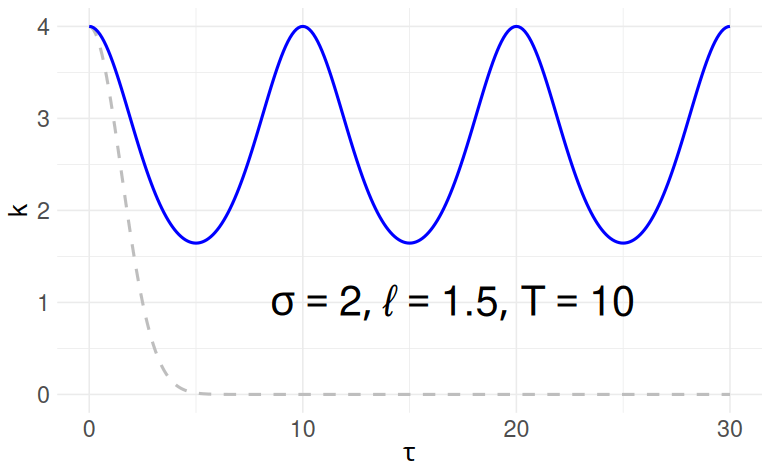
Squared Exponential
Matern 3/2
Periodic
\tau = | t_r - t_c |; \sigma, \ell, T > 0
$$\kappa(\tau; \sigma, \ell) = \sigma^2 \exp\left\{ -\frac{1}{2}\left( \frac{\tau}{\ell}\right)^2\right\}$$
$$\kappa(\tau; \sigma, \ell) = \sigma^2 \left( 1 + \sqrt{3}\frac{\tau}{\ell}\right) \exp\left\{ - \sqrt{3} \frac{\tau}{\ell}\right\}$$
$$\kappa(\tau; \sigma, \ell, T) = \sigma^2 \exp\left\{ -\frac{2}{\ell^2} \sin^2\left( \pi \frac{\tau}{T}\right)\right\}$$
Squared Exponential (Gaussian) Kernel
\kappa(\tau; \sigma, \ell) = \sigma^2 \exp\left\{ -\frac{1}{2}\left( \frac{\tau}{\ell}\right)^2\right\}
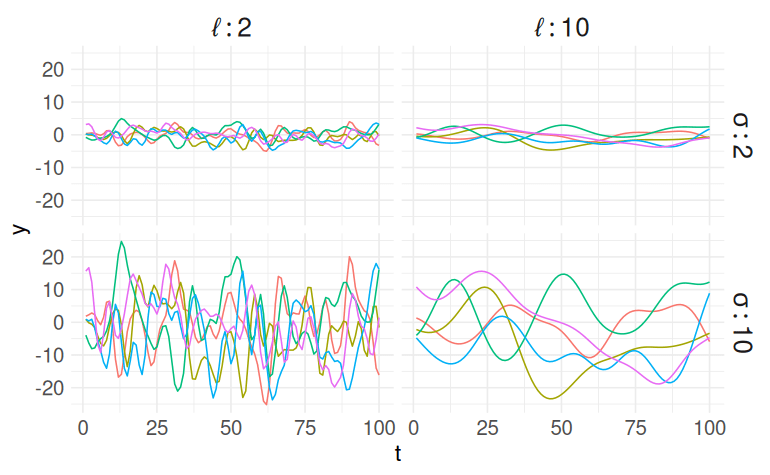
\tau = | t_r - t_c | \\
\sigma, \ell > 0
Bayesian Hierarchical Model
\begin{gather*}
i, r,c = 1, \dots, n.\\
\boldsymbol\theta = (\sigma_\mathrm{SE}, \ell_\mathrm{SE}, \sigma_\mathrm{M32}, \ell_\mathrm{M32}, \sigma_\mathrm{P}, \ell_\mathrm{P}, T)
\end{gather*}
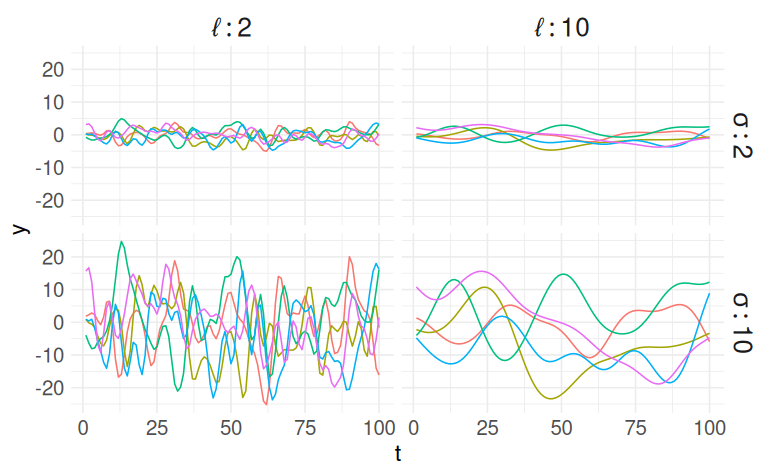
\begin{align*}
[\boldsymbol\Sigma]_{r,c} &= \kappa(t_r - t_c \mid \boldsymbol{\theta})\\
&= \kappa_1(\tau; \sigma_\mathrm{SE}, \ell_\mathrm{SE}) + \kappa_2(\tau; \sigma_\mathrm{M32}, \ell_\mathrm{M32}) + \kappa_3(\tau; \sigma_\mathrm{P}, \ell_\mathrm{P}, T)
\end{align*}
Squared Exponential
Matern 3/2
Periodic
\(Y_i \sim \mathcal{N}\left(f_i, \hat{e_i}^2\right)\)
\(\boldsymbol{f} \sim \mathcal{GP}\left(\boldsymbol{0}, \boldsymbol{\Sigma}_{n \times n}\right)\)
Hyperparameters
Respone
GP prior
"Single-output" GP
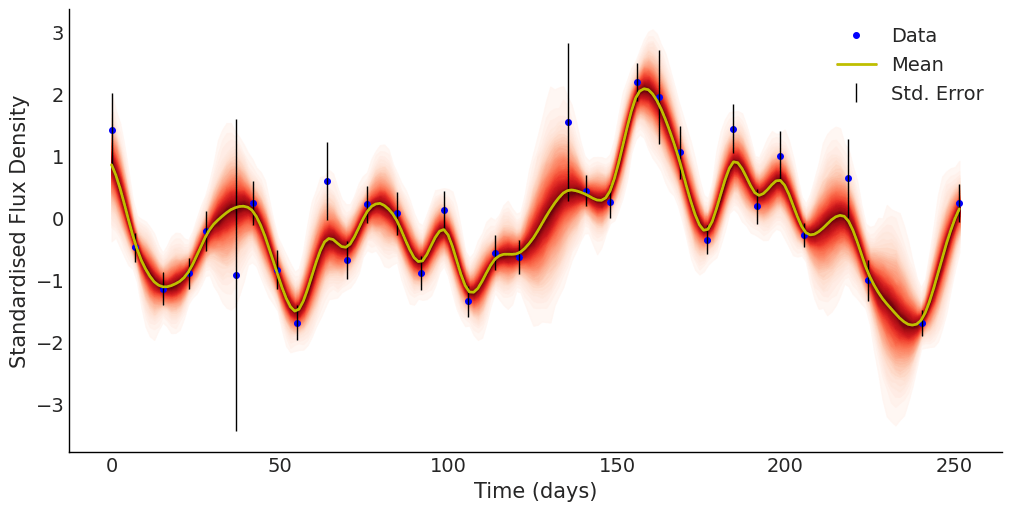
\sigma_\mathrm{SE} = 0.37\\
\ell_\mathrm{SE} = 48.1\\
\sigma_\mathrm{M32} = 1.21\\
\ell_\mathrm{M32} = 12.4\\
\sigma_\mathrm{P} = 0.45\\
\ell_\mathrm{P} = 47.1\\
T = 26.1
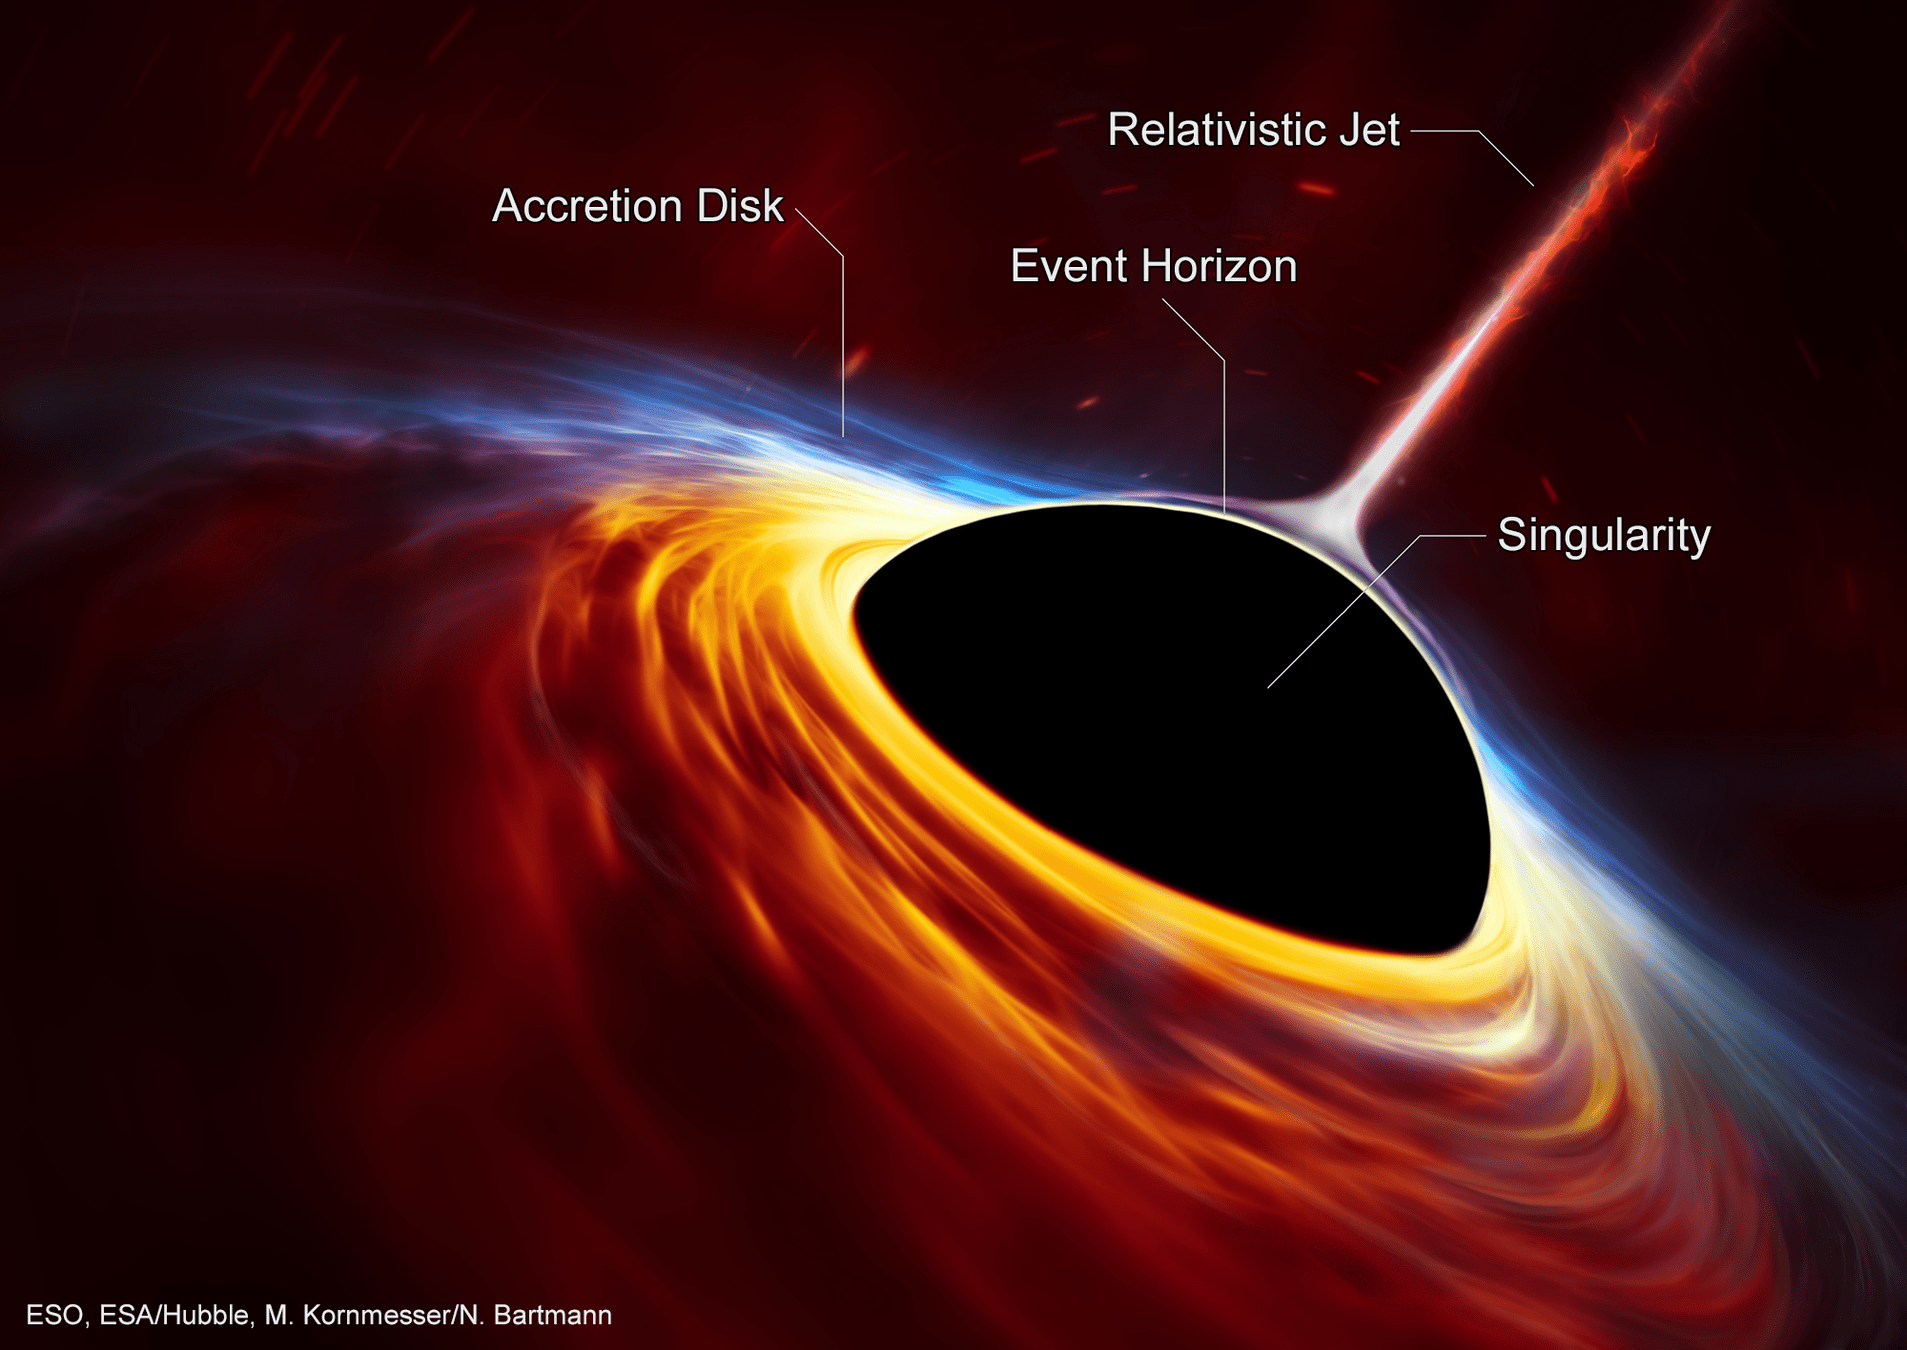
Sagittarius A* (Sgr A*)
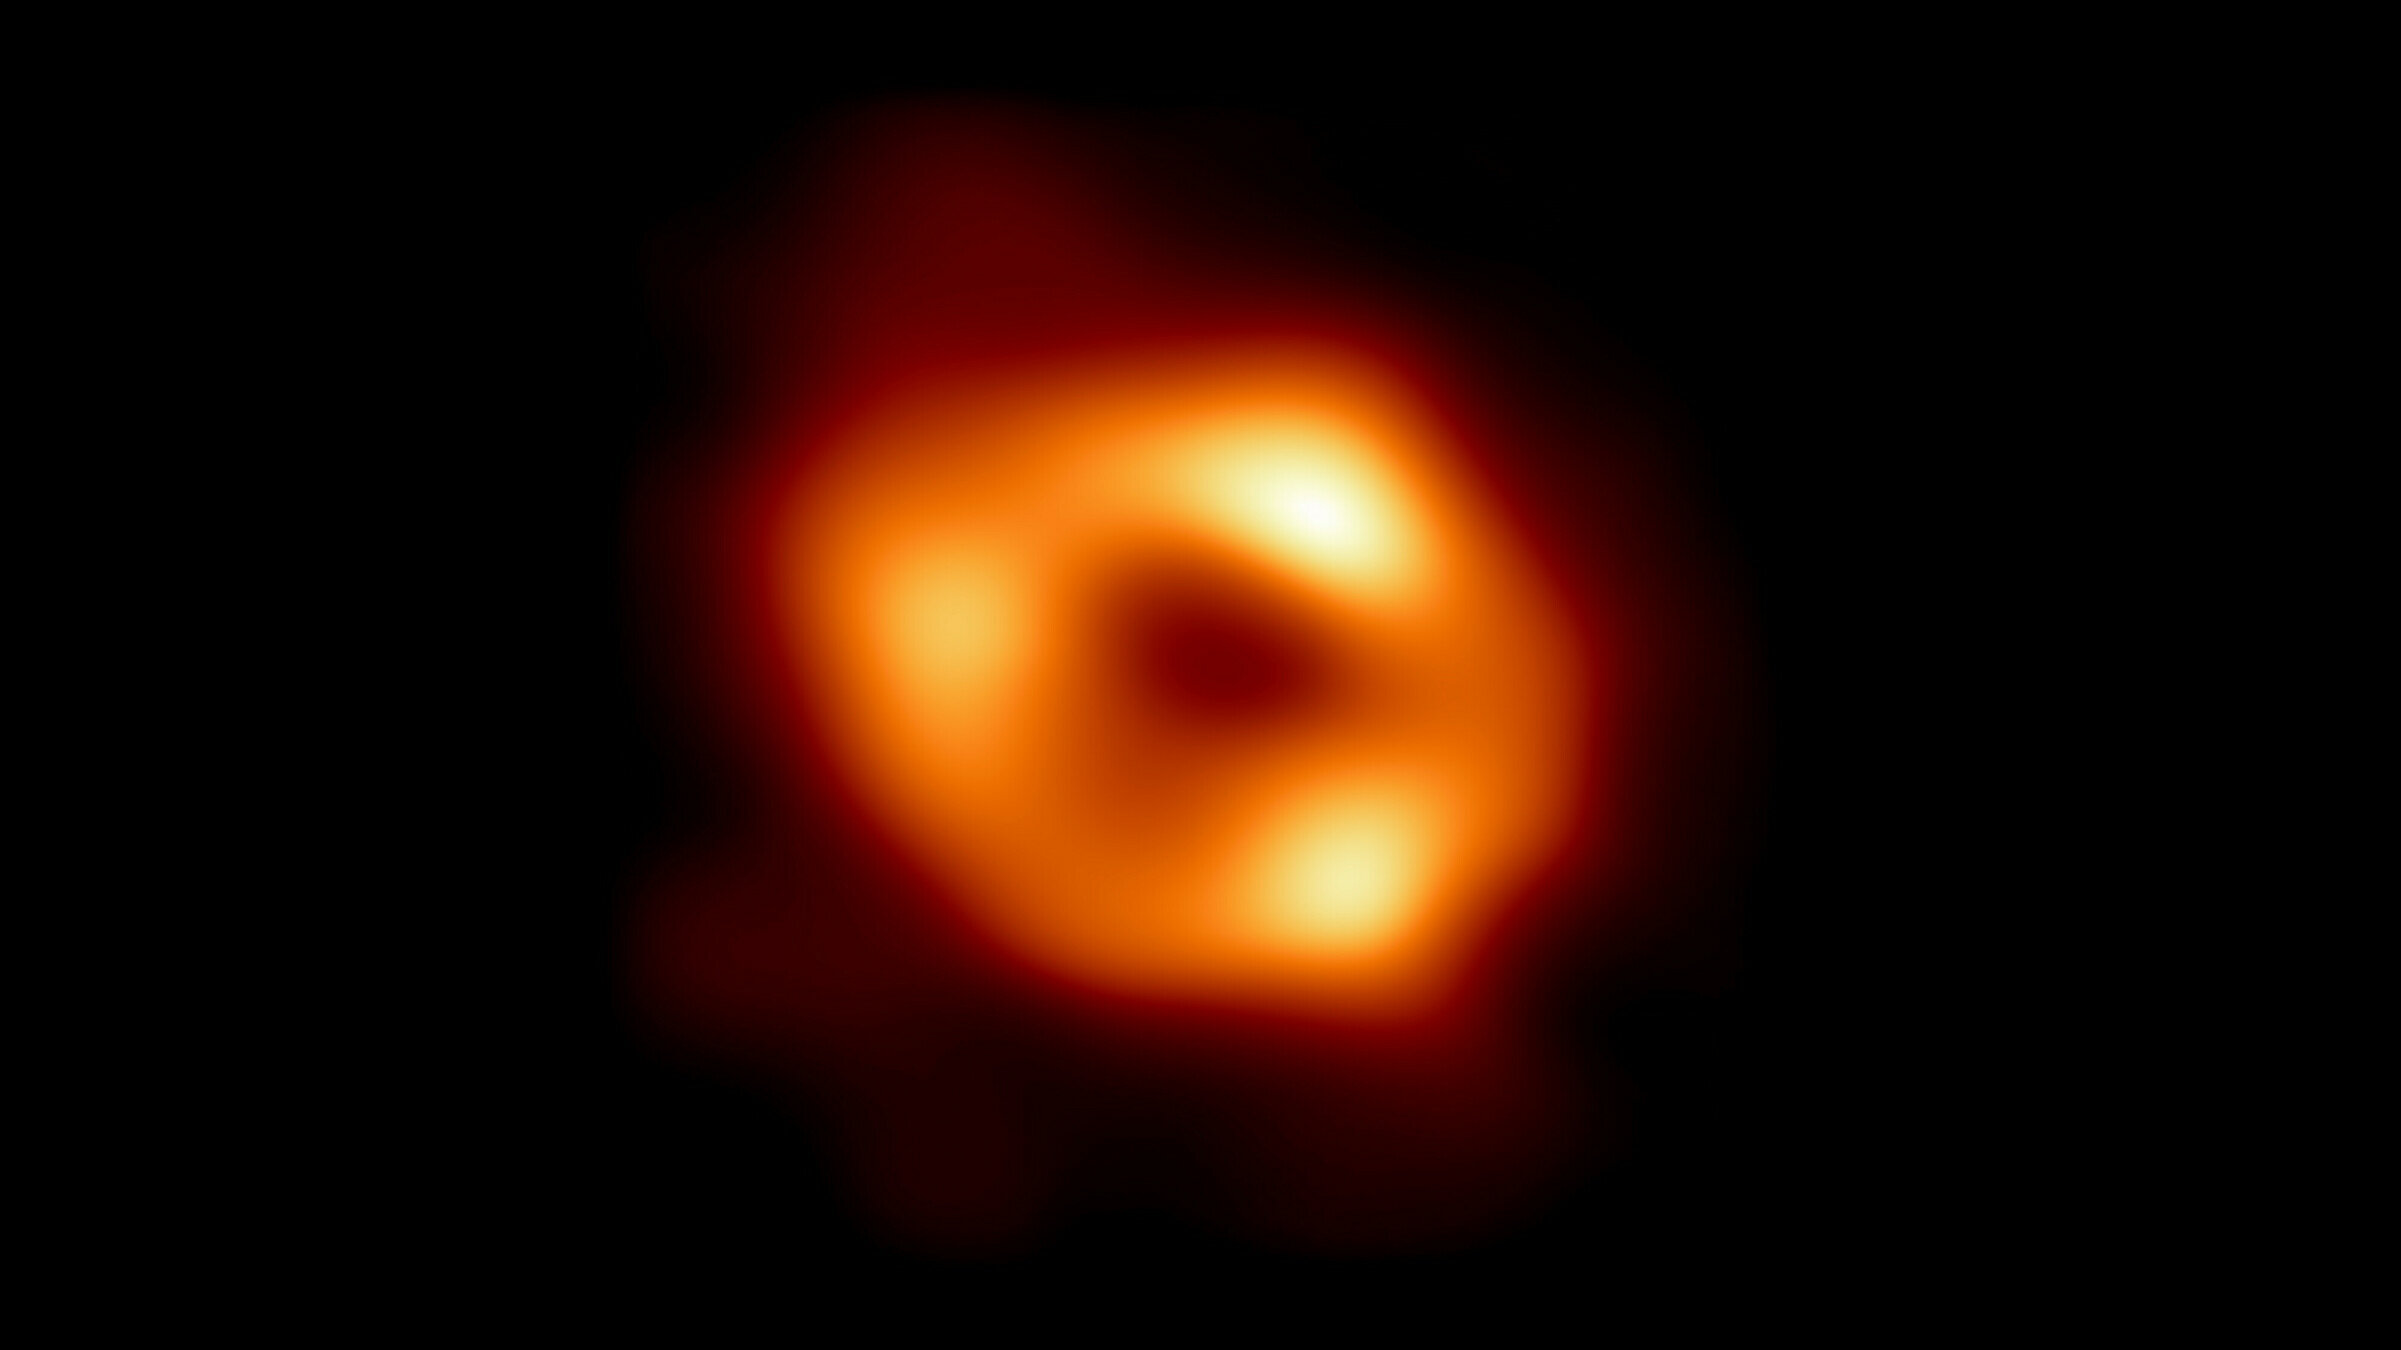
- Supermassive Black Hole (SMBH) at the centre of the Milky Way.
- 4 million solar masses.
- ~27,000 ly from Earth
- Image created from observations taken in 2017 by the Event Horizon Telesope (EHT) Collaboration.
Anatomy of a Black Hole
Multi-band time-domain astronomy
- Estimate the characteristic timescales of the variability in the black hole emissions.
- Characterise the relationship between emissions of different wavelengths, e.g, time delay between bands.
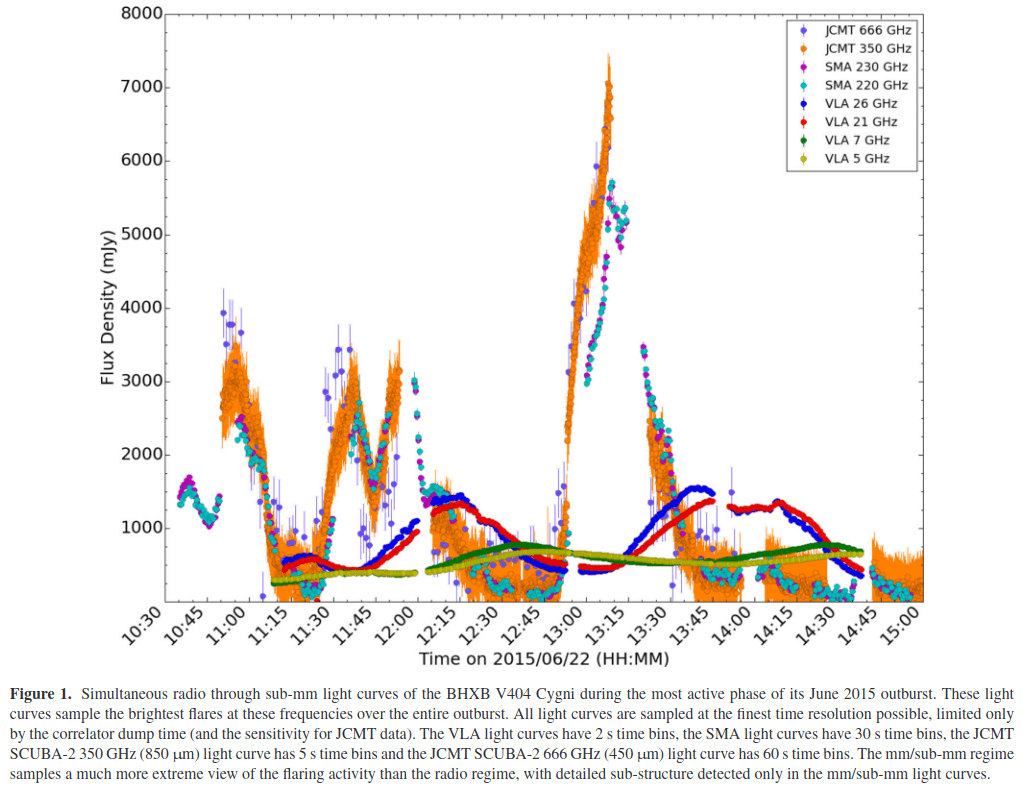
Credit: Tetarenko et al. (2017)
Black hole X-ray binary
V404 Cygni
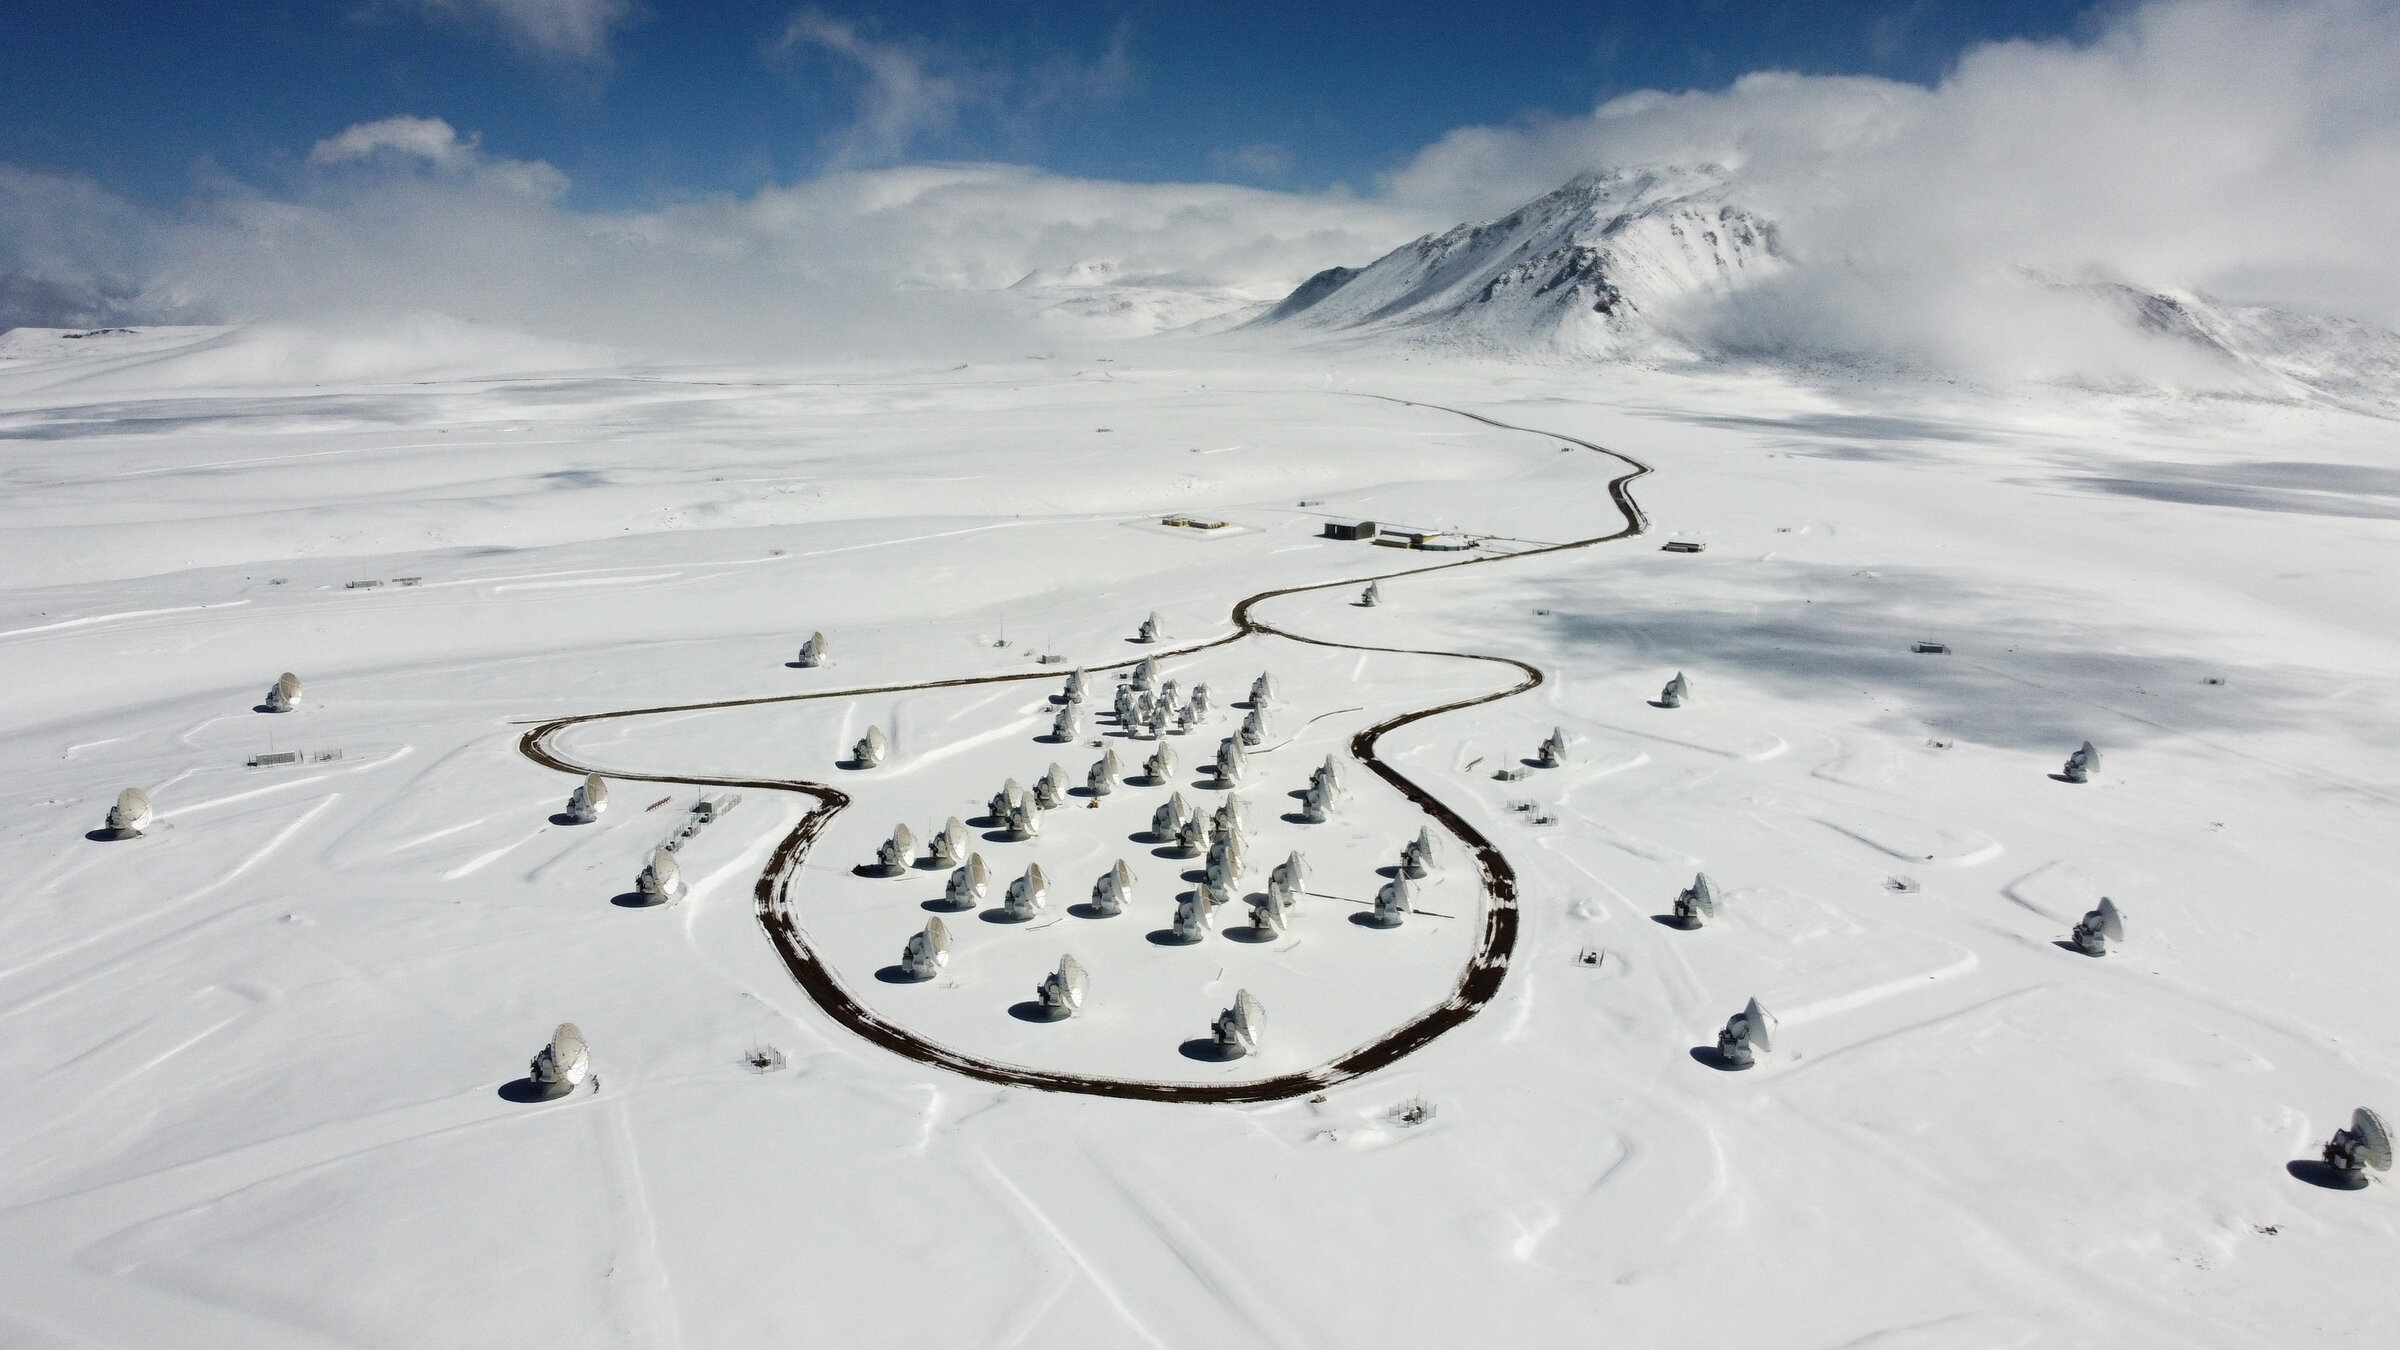
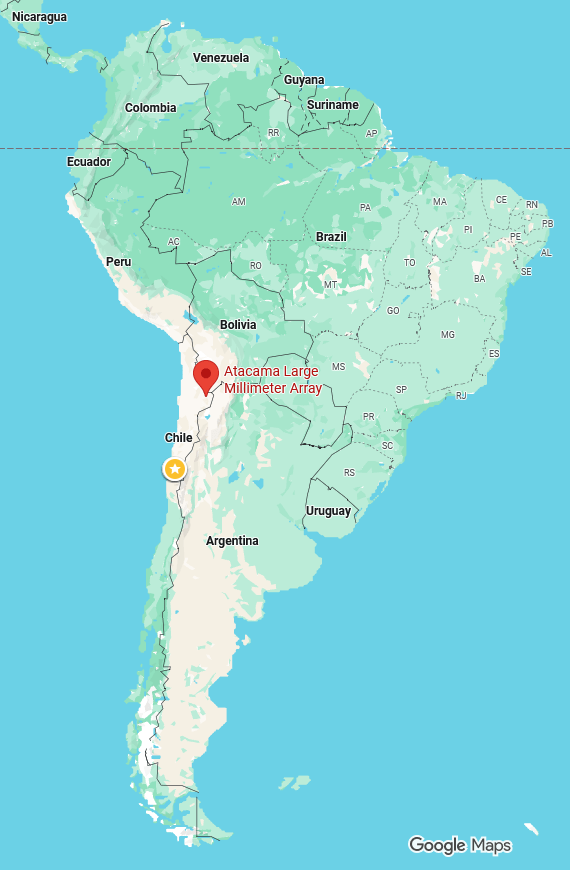
Atacama Large Millimeter Array (ALMA)
- Chilean Atacama Desert at 5000m elevation.
- 66 high-precision dish antennas: 54 x 12m and 12 x 7m across.
- Radio and infrared.
- Member site of EHT Collaboration.
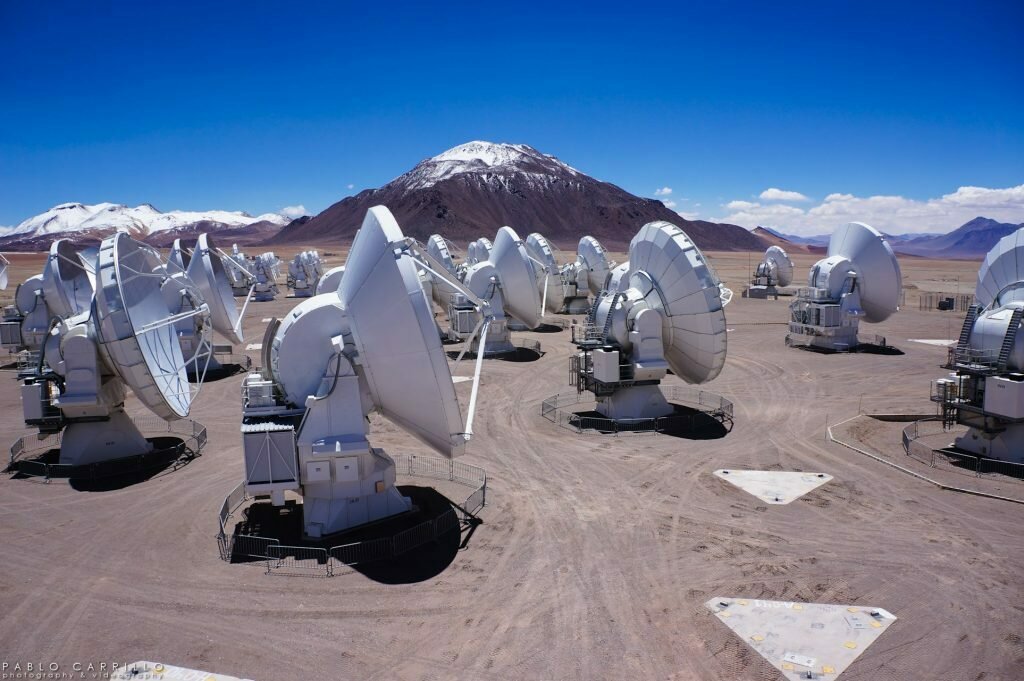
Credit: NRAO/AUI/NSF
Credit: ALMA (ESO/NAOH/NRAO)
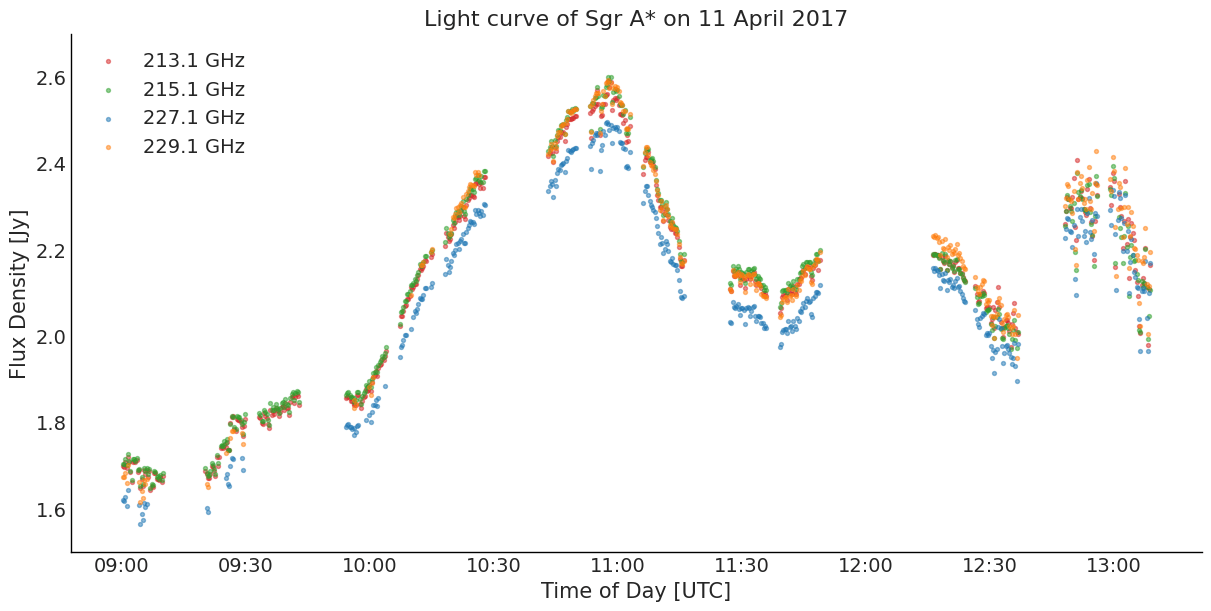
Multi-band Light Curve
Multi-Output GP (MOGP)
\begin{bmatrix}
\boldsymbol{y}_1\\
\boldsymbol{y}_2
\end{bmatrix} \sim \mathcal{N}\left(\begin{bmatrix}\boldsymbol{0}\\ \boldsymbol{0} \end{bmatrix},
\begin{bmatrix}
\boldsymbol{K}_1 & \boldsymbol{0} \\
\boldsymbol{0} & \boldsymbol{K}_2
\end{bmatrix} +
\begin{bmatrix}
\sigma^2_1 \boldsymbol{I} & \boldsymbol{0} \\
\boldsymbol{0} & \sigma^2_2 \boldsymbol{I}
\end{bmatrix}\right)
\boldsymbol{y} \sim \mathcal{N}(\boldsymbol{0}, \boldsymbol{K}_{\boldsymbol{f},\boldsymbol{f}} + \boldsymbol{\Sigma})
\((n_1 + n_2) \times 1\)
\((n_1 + n_2) \times (n_1 + n_2)\)
Cross-covariance
\(\boldsymbol{K}_{\boldsymbol{f},\boldsymbol{f}}\)
f_1(\boldsymbol{x}) \sim \mathcal{GP}(\boldsymbol{0}, \kappa_1(\boldsymbol{x}, \boldsymbol{x}'))
\boldsymbol{y}_1 \sim \mathcal{N}(\boldsymbol{0}, \boldsymbol{K}_1 + \sigma^2_1 \boldsymbol{I})
\mathcal{D}_1 = \{ ( \boldsymbol{x}_{i,1}, y_1(\boldsymbol{x}_{i,1}) ) ; i = 1, \dots, n_1\}
f_2(\boldsymbol{x}) \sim \mathcal{GP}(\boldsymbol{0}, \kappa_2(\boldsymbol{x}, \boldsymbol{x}'))
\boldsymbol{y}_2 \sim \mathcal{N}(\boldsymbol{0}, \boldsymbol{K}_2 + \sigma^2_2 \boldsymbol{I})
\mathcal{D}_2 = \{ ( \boldsymbol{x}_{i,2}, y_2(\boldsymbol{x}_{i,2}) ) ; i = 1, \dots, n_2\}
MOGP Kernels
- Choose a cross-covariance function \( \operatorname{cov}[f_1(\boldsymbol{x}),f_2(\boldsymbol{x}')]\) such that \( \boldsymbol{K}_{\boldsymbol{f},\boldsymbol{f}}\) is a valid covariance matrix, i.e., positive semi-definite.
- Many forms of "separable" kernels where \(\boldsymbol{K}_{\boldsymbol{f},\boldsymbol{f}}\) is decomposed into submatrices, e.g., LMC, ICM, SLFM, see Alvarez et al. (2012).
\begin{bmatrix}
\boldsymbol{f}_1\\
\boldsymbol{f}_2
\end{bmatrix} \sim \mathcal{N}\left(\begin{bmatrix}\boldsymbol{0}\\ \boldsymbol{0} \end{bmatrix},
\begin{bmatrix}
\boldsymbol{K}_1 & \\
& \boldsymbol{K}_2
\end{bmatrix} +
\begin{bmatrix}
\sigma^2_1 \boldsymbol{I} & \boldsymbol{0} \\
\boldsymbol{0} & \sigma^2_2 \boldsymbol{I}
\end{bmatrix}\right)
\(\boldsymbol{K}_{\boldsymbol{f},\boldsymbol{f}}\)
?
?
Semiparametric Latent Factor Model (SLFM)
Fit each band as a linear combination of two latent GPs,
where \(d = 1,2\) output bands and \(q = 1,2\) latent processes
\begin{align*}
\begin{bmatrix}
\boldsymbol{f}_1\\
\boldsymbol{f}_2
\end{bmatrix} &=
\begin{bmatrix}
a_{1,1} & a_{1,2} \\
a_{2,1} & a_{2,2}
\end{bmatrix} \times
\begin{bmatrix}
u_1(\boldsymbol{x}) \\
u_2(\boldsymbol{x})
\end{bmatrix} =
\begin{bmatrix}
\boldsymbol{a}_1 & \boldsymbol{a}_2
\end{bmatrix} \times
\begin{bmatrix}
u_1(\boldsymbol{x}) \\
u_2(\boldsymbol{x})
\end{bmatrix}
\end{align*}
\boldsymbol{f}(\boldsymbol{x}) = \boldsymbol{a}_1 u_1 (\boldsymbol{x}) + \boldsymbol{a}_1 u_2 (\boldsymbol{x})
\begin{align*}
u_1(\boldsymbol{x}) &\sim \mathcal{GP}(\boldsymbol{0}, \kappa_1(x, x'))\\
u_2(\boldsymbol{x}) &\sim \mathcal{GP}(\boldsymbol{0}, \kappa_2(x, x'))
\end{align*}
f_d(\boldsymbol{x}) = \sum^2_q a_{d,q} u_q(\boldsymbol{x})
Alternatively,
Semi-parametric Latent Factor kernel
\begin{align*}
\boldsymbol{K}_{\boldsymbol{f},\boldsymbol{f}} &=
\begin{bmatrix}
\mathrm{cov}[f_1(\boldsymbol{x}), f_1(\boldsymbol{x'})] & \dots & \mathrm{cov}[f_1(\boldsymbol{x}), f_4(\boldsymbol{x'})]\\
\vdots & \ddots & \vdots \\
\mathrm{cov}[f_1(\boldsymbol{x'}), f_4(\boldsymbol{x})] & \dots & \mathrm{cov}[f_4(\boldsymbol{x}), f_4(\boldsymbol{x'})]
\end{bmatrix} \\
&= \sum^2_q \boldsymbol{a}_q \boldsymbol{a}_q^\top \otimes \kappa_q(\boldsymbol{x}, \boldsymbol{x}') \\
&= \sum^2_q \boldsymbol{B}_q \otimes \boldsymbol{K}_{f_q, f_q}
\end{align*}
Co-regionalisation Matrices
Kronecker product
-
Cross-covariance between channels is the same shape as the auto-covariance.
-
Cannot model any lag between channels.
Spectral Mixture Kernel
- Design a multi-output kernel in the spectral (Fourier) domain rather than in the time domain.
- Cramer's Theorem guarantees a valid kernel in the time-domain if the matrix of cross-spectral densities \(\mathbf{S}(\omega) \) is
- Hermitian,
- positive semi-definite, and
- integrable
- Alternatively:
- non-negative
- symmetrical about origin
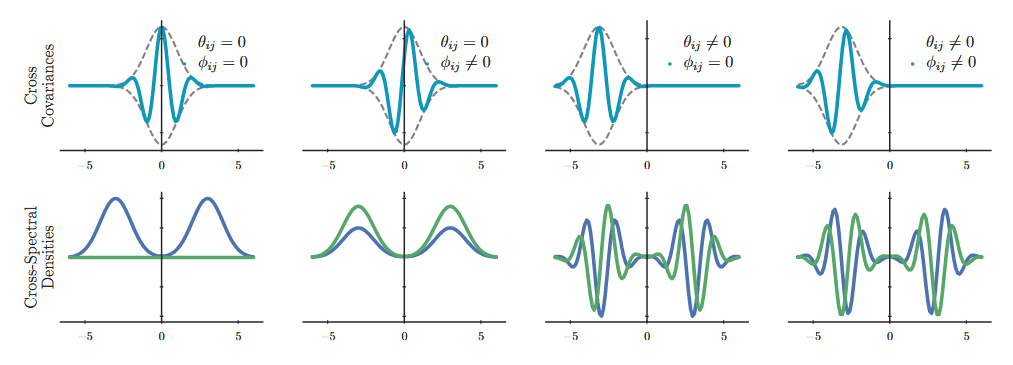
(Figure adapted from Parra & Tobar 2017)
Spectral Mixture Kernel
Closed-form covariance functions after inverse Fourier transform.
k_{ij}(\tau) = \sum_{q=1}^{Q} \alpha_{ij}^{(q)}
\exp\!\Big(-\tfrac{1}{2}\,\Sigma_{ij}^{(q)}\big(\tau + \theta_{ij}^{(q)}\big)^2\Big)
\cos\!\Big(\mu_{ij}^{(q)}\big(\tau + \theta_{ij}^{(q)}\big) + \phi_{ij}^{(q)}\Big)
For \(Q\) spectral components, the covariance between bands \(i\) and \(j\) at lag \(\tau = t - t'\) is
k_{ij}(\tau) = \alpha_{ij}
\exp\!\Big(-\tfrac{1}{2}\,\Sigma_{ij}\big(\tau + \theta_{ij}\big)^2\Big)
\cos\!\Big(\mu_{ij}\big(\tau + \theta_{ij}\big) + \phi_{ij}\Big)
For a single component, \(Q = 1\):
"Squared Exponential envelope"
Periodic oscillation
Spectral Mixture Kernel
k_{ij}(\tau) = \alpha_{ij}
\exp\!\Big(-\tfrac{1}{2}\,\Sigma_{ij}\big(\tau + \theta_{ij}\big)^2\Big)
\cos\!\Big(\mu_{ij}\big(\tau + \theta_{ij}\big) + \phi_{ij}\Big)
The cross-band parameters are built from the per-band weight \(w_i\), spectral mean \(\mu_i\), spectral variance \(\Sigma_i\), delay \(\theta_i\) and phase \(\phi_i\):
\Sigma_{ij} = \frac{2\,\Sigma_i\Sigma_j}{\Sigma_i + \Sigma_j} \\
Width of cross-covariance envelope
\theta_{ij} = \theta_i - \theta_j
Delay between bands
\phi_{ij} = \phi_i - \phi_j
Phase offset
\mu_{ij} = \frac{\Sigma_j\mu_i + \Sigma_i\mu_j}{\Sigma_i + \Sigma_j}
Oscillation frequency of cross-covariance
w_{ij} = w_i w_j \exp\!\left\{-\frac{\big(\mu_i - \mu_j\big)^2}{4\big(\Sigma_i + \Sigma_j\big)}\right\}
Strength of coupling between bands
\alpha_{ij} = w_{ij}\sqrt{2\pi\,\Sigma_{ij}}
Amplitude of cross-covariance
Four-band Light Curve
Two-band Light Curve
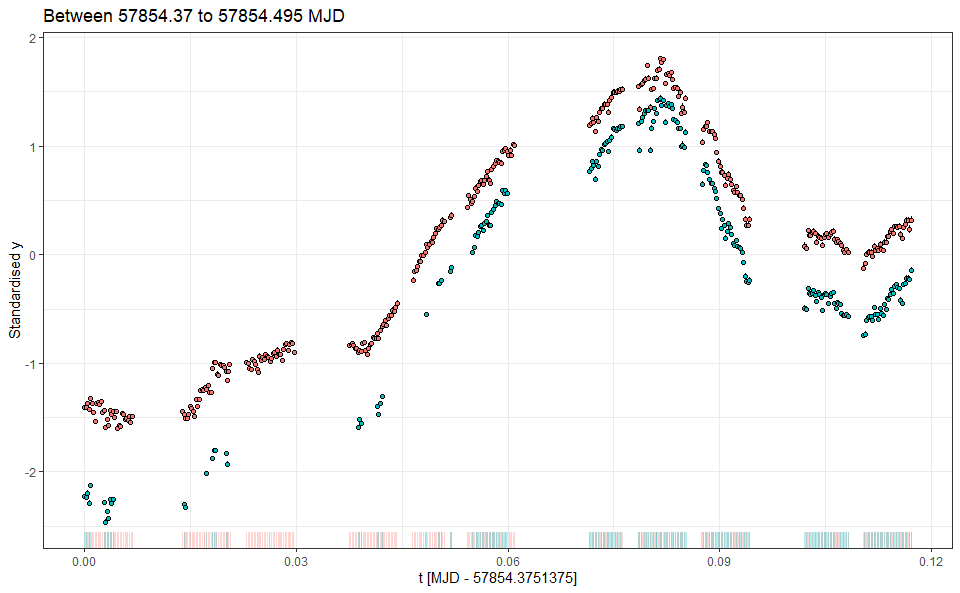
Two-output MOGP Model
\mathbf{y} = \begin{pmatrix} \mathbf{y}_1 \\ \mathbf{y}_2 \end{pmatrix} \in \mathbb{R}^{M},
\qquad \mathbf{y}_i = (y_{i,1},\dots,y_{i,N_i})^\top, \qquad M = N_1 + N_2
y_{i,n} = f_i(t_{i,n}) + \varepsilon_{i,n}, \qquad
\varepsilon_{i,n} \sim \mathcal{N}(0, \sigma_{i,n}^2),
\mathbf{f} = (f_1, f_2)
\operatorname{cov}\big(f_i(t), f_j(t')\big) = k_{ij}(t - t')
\mathbf{y} \mid \boldsymbol{\Theta} \sim
\mathcal{N}\!\big(\mathbf{0},\; \mathbf{K} + \mathbf{D}),
\qquad \mathbf{D} = \operatorname{diag}\big(\sigma_{1,1}^2,\dots,\sigma_{1,N_1}^2,
\sigma_{2,1}^2,\dots,\sigma_{2,N_2}^2\big)
\mathbf{K} = \begin{pmatrix} \mathbf{K}_{11} & \mathbf{K}_{12} \\
\mathbf{K}_{12}^\top & \mathbf{K}_{22} \end{pmatrix}, \qquad
[\mathbf{K}_{ij}]_{n,m} = k_{ij}\big(t_{i,n} - t_{j,m}\big)
Data Model
Process Model
\boldsymbol{\Theta} = \Big\{\Sigma_i,\ \mu_i, w_i, \theta_i, \phi_i\Big\}_{i \in \{1,2\}}
Parameter Model
\Sigma_i = \big(\ell_i\big)^{-2}, \qquad \ell_{\min} \le \ell_i \le \ell_{\max}
v_i^{(q)} = k_{ii}^{(q)}(0) = \big(w_i^{(q)}\big)^2\sqrt{2\pi\,\Sigma_i^{(q)}}
v_i^{(q)} = \varsigma_i^{2}\, s_i^{(q)}, \qquad
\mathbf{s}_i = \big(s_i^{(1)},\dots,s_i^{(Q)}\big) \in \Delta^{Q-1},
\sum_{q=1}^{Q} s_i^{(q)} = 1
length-scale in time
variance contribution of component \(q\)
split from total variance of band \(i\)
\theta_1^{(q)} = \phi_1^{(q)} = 0, \qquad
\theta_2^{(q)} \equiv \vartheta_q \in \mathbb{R}, \qquad
\phi_2^{(q)} \equiv \varphi_q \in (-\pi, \pi),
Identifiability constraints
0 < \mu_1^{(1)} < \mu_1^{(2)} < \dots < \mu_1^{(Q)}, \qquad
\mu_2^{(q)} > 0 \ \ (q = 1,\dots,Q).
Priors
\begin{align*}
\varsigma_i &\sim \mathrm{lognormal}\big(0,\ \tau_\varsigma^2\big), && i = 1,2, \\
\mathbf{s}_i &\sim \mathrm{Dirichlet}\big(a\,\mathbf{1}_Q\big), && i = 1,2, \\
\big(\mu_1^{(1)},\dots,\mu_1^{(Q)}\big) &\sim \prod_{q=1}^{Q}\N\big(\mu_1^{(q)} \mid 0, \tau_\mu^2\big)\,
\mathbf{I}\big[0 < \mu_1^{(1)} < \dots < \mu_1^{(Q)}\big], \\
\mu_2^{(q)} &\sim \mathcal{N}^{+}\big(0,\ \tau_\mu^2\big), && q = 1,\dots,Q, \\
\ell_i^{(q)} &\sim \mathrm{lognormal}\big(m_\ell,\ s_\ell^2\big)\ \text{truncated to } [\ell_{\min}, \ell_{\max}], && i = 1,2,\ q = 1,\dots,Q, \\
\vartheta_q &\sim \mathcal{N}(0, 1), && q = 1,\dots,Q, \\
\varphi_q &\sim \mathrm{Unif}(-\pi, \pi), && q = 1,\dots,Q,
\end{align*}
Posterior Predictive Curves
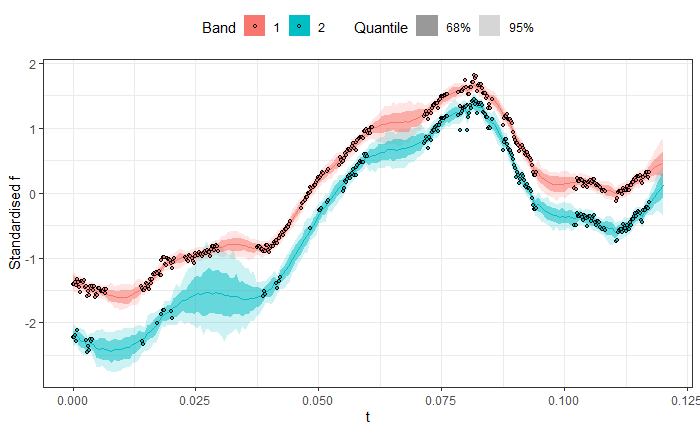
Hyperparameter Posteriors
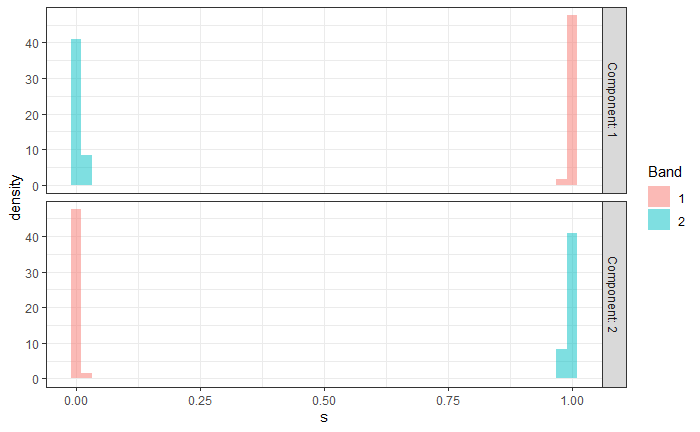
\(s_{q,i}\) is the share of a band \(i\)’s signal variance carried by component \(q\).
- Band 1 is almost completely encoded by Component 1
- Band 2 is almost completely encoded by Component 2
Hyperparameter Posteriors
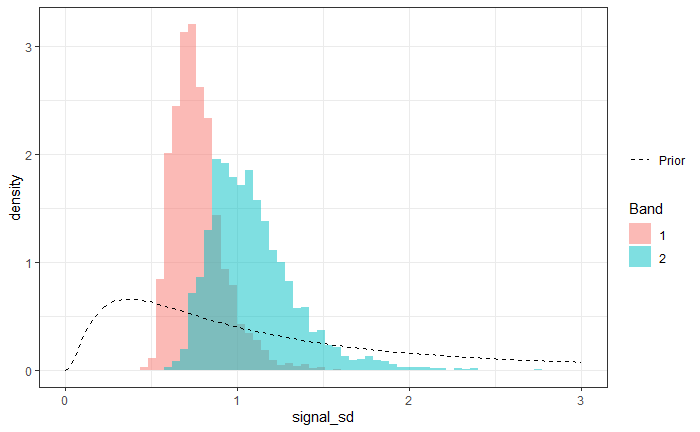
\(\varsigma_i\) is the total standard deviation of the signal captured in band \(i\) .
- There is a reasonable sharing of signal variance between both bands.
Hyperparameter Posteriors
\(\ell_{q,i}\) is the length scale of Component \(q\) band \(i\) .
- Component 1 has a length scale of approximately 11 minutes.
- Component 2 has a length scale of approximately 14 minutes.
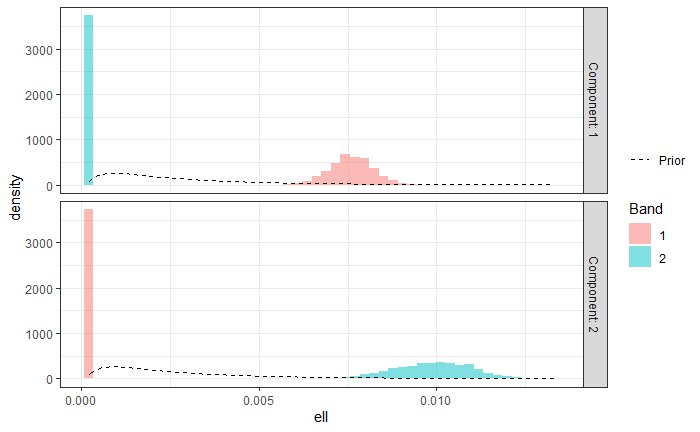
| Band 1 | Band 2 | |
|---|---|---|
| Component 1 | 0.0076 | 0.0002 |
| Component 2 | 0.0002 | 0.010 |
Hyperparameter Posteriors
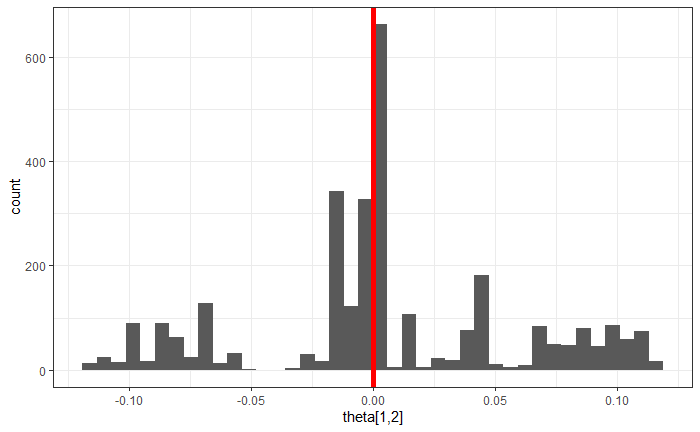
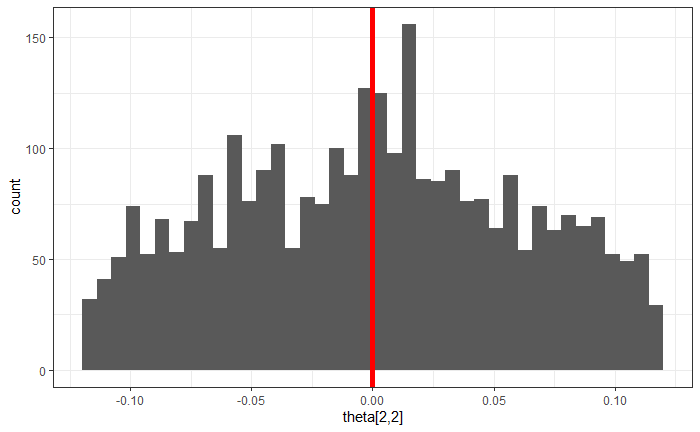
\(\vartheta_{q}\) is time delay between Bands 1 and 2.
- Inconclusive estimates for \(\vartheta_q\).
- Time delays are perhaps too similar to sampling and noise.
Summary
- Multi-band light curves of Sgr A* with different sampling rates.
- Tried using MOGP regression to characterise the:
- time scale of variation, and
- time delays between bands.
- Time scales of variability between 11 to 14 minutes.
- No reliable time delay was found. Still a work in progress!
- Navigating the literature between astronomy, astrophysics, statistics, and machine learning, has been tricky.
Multi-output spectral mixture Gaussian processes for lag estimation in multi-wavelength astronomical time series
By Shih Ching Fu
Multi-output spectral mixture Gaussian processes for lag estimation in multi-wavelength astronomical time series
Multi-Output Gaussian Process (MOGP) regression extends univariate Gaussian Process regression to cases where multiple response variables should be modelled together. For example, these may be response variables that co-vary because they share an underlying origin. This makes MOGP regression perfectly suited for modelling the multi-band data collected by astronomical facilities such as the Atacama Large Millimeter/submillimeter Array (ALMA). In this instance, the multiple outputs correspond to the brightness of emissions from a celestial source as detected at different electromagnetic (EM) frequencies. Here, the celestial source is Sagittarius A* (Sgr A*), the supermassive black hole (SMBH) at the Galactic centre of the Milky Way, and we assume that its changing brightness over time, known as its light curve, is a stochastic process. Using a Bayesian hierarchical model, we demonstrate how MOGPs can be used to infer the relationship between the brightnesses observed at different frequency bands, known as the spectral index. We compare the results of different modelling decisions, such as the choice of cross-covariance structure, and despite light curves being notoriously sparse and unevenly sampled, we obtain a reasonable estimate of the spectral index. Astronomers are interested in the spectral index because it offers clues to the mechanism behind the EM emission.